. 2021 May;34(3):641-647.
doi: 10.1111/pcmr.12937. Epub 2020 Nov 17.

Recurrent co-alteration of HDGF and SETDB1 on chromosome 1q drives cutaneous melanoma progression and poor prognosis

Affiliations

Recurrent co-alteration of HDGF and SETDB1 on chromosome 1q drives cutaneous melanoma progression and poor prognosis

Maurizio Fazio et al. Pigment Cell Melanoma Res. 2021 May.

Abstract

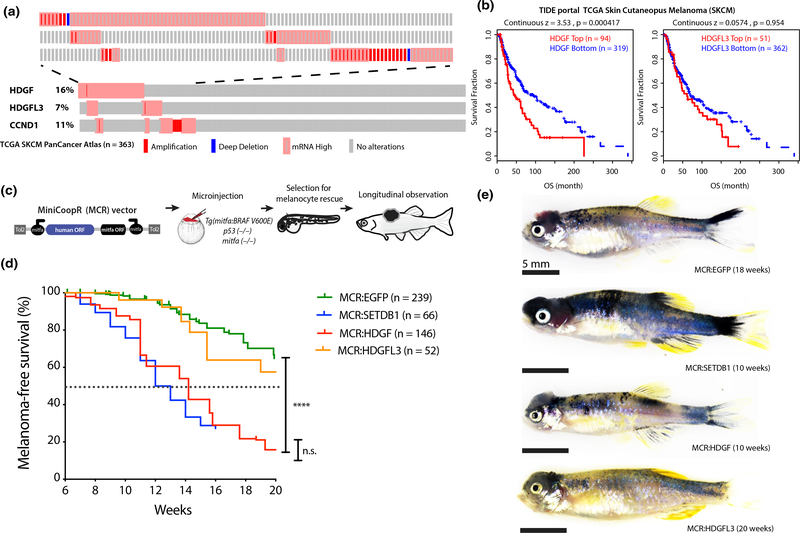
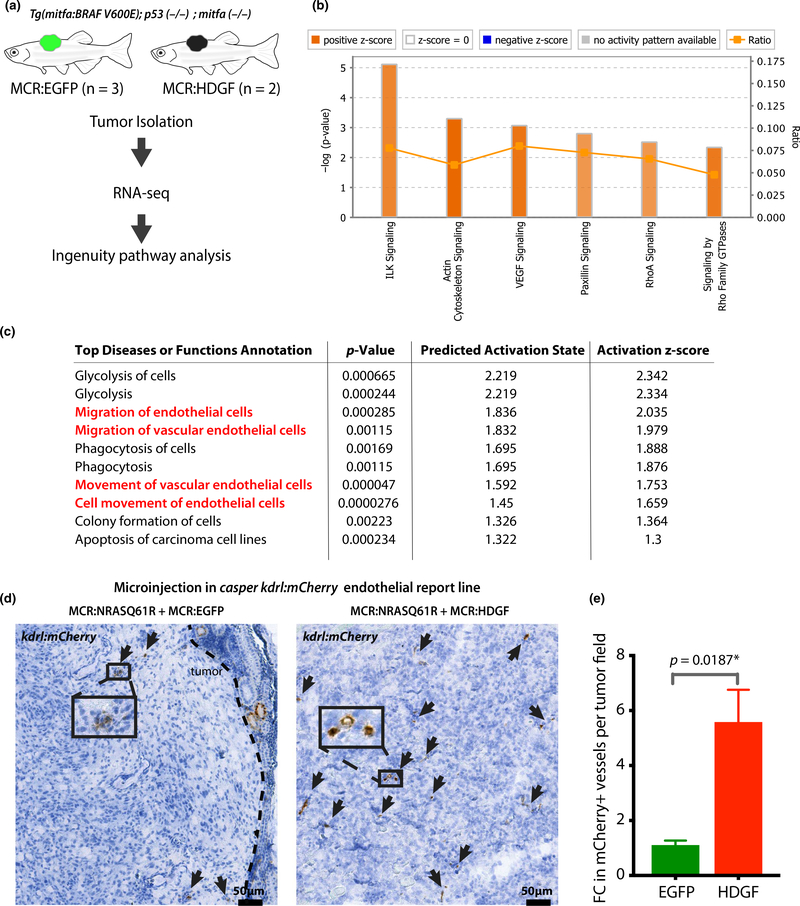
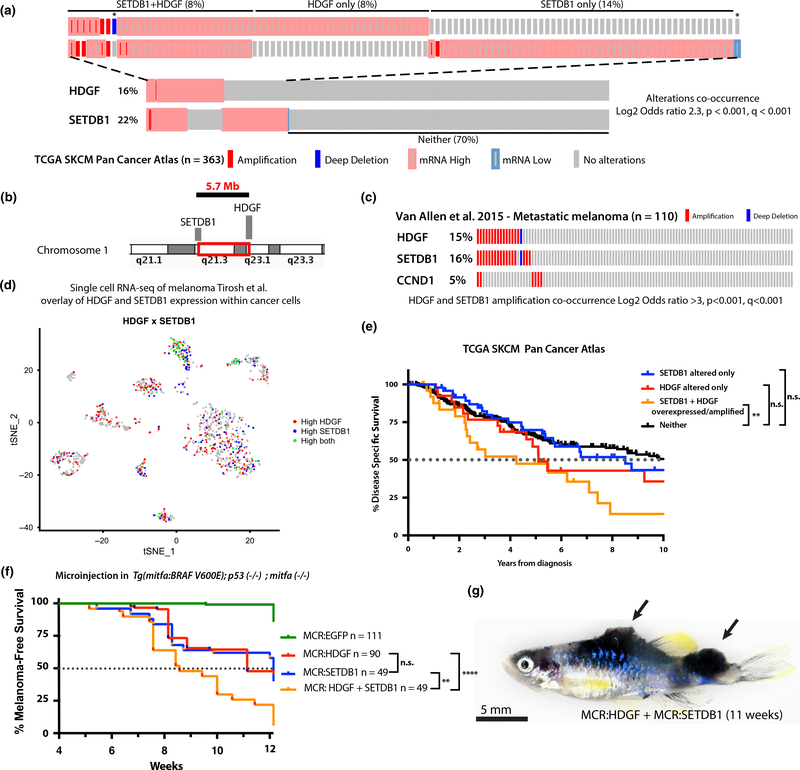
A progressive increase in copy number variation (CNV) characterizes the natural history of cutaneous melanoma progression toward later disease stages, but our understanding of genetic drivers underlying chromosomal arm-level CNVs remains limited. To identify candidate progression drivers, we mined the TCGA SKCM dataset and identified HDGF as a recurrently amplified gene whose high mRNA expression correlates with poor patient survival. Using melanocyte-specific overexpression in the zebrafish BRAFV600E -driven MiniCoopR melanoma model, we show that HDGF accelerates melanoma development in vivo. Transcriptional analysis of HDGF compared to control EGFP tumors showed the activation of endothelial/angiogenic pathways. We validated this observation using an endothelial kdrl:mCherry reporter line which showed HDGF to increases tumor vasculature. HDGF is frequently co-altered with the established melanoma driver SETDB1. Both genes are located on chromosome 1q, and their co-amplification is observed in up to 13% of metastatic melanoma. TCGA patients with both genes amplified and/or overexpressed have a worse melanoma specific survival. We tested co-expression of HDGF and SETDB1 in the MiniCoopR model, which resulted in faster and more aggressive melanoma development than either gene individually. Our work identifies the co-amplification of HDGF and SETDB1 as a functional driver of melanoma progression and poor patient prognosis.


Conflict of interest statement

CONFLICT OF INTERESTS

LIZ is a founder and stockholder of Fate Therapeutics, Inc., Scholar Rock, Camp4 Therapeutics, Inc., Amagma Therapeutics, Inc., and a scientific advisor for Stemgent.

Figures

FIGURE 1
FIGURE 1
Frequent amplification or overexpression of HDGF correlates with poor prognosis in melanoma patients and accelerates melanoma in a zebrafish transgenic model. (a) Oncoprint of HDGF, HDGFL3 and commonly amplified gene CCND1 in TCGA skin cutaneous melanoma dataset showing copy number changes and mRNA expression (Z score > 2) compared to diploid samples. Mutations are not shown and no patient had evidence of “mRNA low.” Each individual rectangle represents a patient. The top part of the figure is a close-up of altered patients. (b) Correlation of mRNA expression of HDGF and HDGFL3, with Overall survival in TCGA skin cutaneous melanoma dataset from TIDE portal. This analysis identifies the Z expression threshold resulting in maximal curve separation (logRank Mantel-Cox p) across the two groups. For bottom versus top quartile, see Figure S1b–c. (c) Schematic of in vivo MCR experimental design (top) and (d) Kaplan–Meier survival curve (bottom) showing the tumor onset of MCR vectors microinjected in Tg(mitfa:BRAFV600E);tp53-/-;mitfa-/- to drive melanocyte-specific expression of HDGF (red) or HDGFL3 (orange), EGFP (green) and SETDB1 (blue) (****=p < .0001) (logRank Mantel-Cox p). Median onset is indicated by the dotted line. (e) Representative image of the gross anatomy of a tumor-bearing fish. Bright field image, all scale bars are 5mm. Pigmented raised melanoma tumors are visible on the head region of each fish
FIGURE 2
FIGURE 2
HDGF increases angiogenesis. (a) Outline of RNA isolation and transcriptional analysis in MCR:EGFP and MCR:HDGF mitfa:BRAFV600E;tp53-/--driven tumors. (b) Ingenuity pathway analysis (IPA) showing the most significant activated pathways (Z score > 2) in HDGF tumors compared to EGFP tumor controls. Color intensity corresponds to Z score value (i.e., darker orange, larger Z score). (c) IPA analysis showing the most significantly activated diseases or function annotations in MCR:HDGF tumors compared to MCR:EGFP controls. Terms relating to endothelial cell migration/angiogenesis are highlighted in red. (d) Analysis of the effect of HDGF on tumor vasculature in the MCR:NRASQ61R model. MCR:EGFP or MCR:HDGF was co-injected with MCR:NRASQ61R into one cell stage casper embryos carrying the krdl:mCherry transgenic vasculature reporter line. 8- to 10-week-old tumor-bearing zebrafish were fixed and subjected to anti-mCherry immunohistochemistry using DAB (brown). Slides were bleached to remove melanin pigment interference. A representative image per genotype is shown. The brown signal in the tumor (mCherry) represents vasculature and is highlighted with arrows. (E) Quantification of DAB mCherry + vessels in 4 MCR:EGFP and 5 MCR:HDGF tumors (multiple fields of view/tumor, at 20x). A total of 22 fields were analyzed. The number of vessels per field was averaged per animal, and fold change (FC) was calculated by normalizing over the average of EGFP controls and analyzed via unpaired t test
FIGURE 3
FIGURE 3
HDGF and SETB1 frequent co-amplification or overexpression correlates with poor prognosis in melanoma patients and strongly accelerates melanoma in a zebrafish transgenic model. (a) Oncoprint of HDGF and SETDB1 in TCGA skin cutaneous melanoma dataset (Liu et al., 2018) showing significant co-occurrence of copy number changes and mRNA expression (Z score > 2). Mutations are not shown. The top part of the figure is a close-up of altered patients. Overall % prevalence in the cohort is reported for each group (SETDB1 + HDGF, HDGF only, SETDB1 only or neither). Each individual rectangle is a patient. Patients labeled with * were included in the neither group for survival analysis in 3E. (b) Illustration of the genomic localization and distance of HDGF and SETDB1 on chromosome 1. (c) Oncoprint of HDGF, SETDB1 and commonly amplified gene CCND1 in metastatic melanoma (Van Allen et al., 2015). (d) scRNA plot of metastatic melanoma (Tirosh et al., 2016) cancer cells showing co-expression of HDGF and SETDB1 at the single cell level in melanoma. Each cluster represents a patient, and only cancer cells are shown. (e) Kaplan–Meier disease-specific survival analysis of patients in Figure 1a (**p = .0099, n.s.= not significant) (logRank Mantel-Cox p). (f) Effect on tumor onset of MCR vectors microinjected into Tg(mitfa:BRAFV600E);tp53-/-;mitfa-/-. For HDGF + SETDB1, a pool of the two vectors (12.5pg + 12.5 pg of DNA) with the same total amount of plasmid DNA as the other conditions (25 pg) was injected. HDGF + SETDB1 versus SETDB1 p = .0013**, HDGF + SETDB1 versus HDGF p < .0001****, HDGF versus SETDB1 p = .25 (not significant), HDGF + SETDB1, HDGF, SETDB1 versus EGFP all p < .0001**** (logRank Mantel-Cox p). (g) Representative image of a MCR:HDGF + MCR:SETDB1 fish bearing multiple tumors. Bright field image, scale bar is 5 mm. Multiple pigmented raised melanoma tumors are visible on the dorsum and caudal peduncle regions and are marked by black arrows. See Figure S4f for quantification

References

    1. Ablain J, Xu M, Rothschild H, Jordan RC, Mito JK, Daniels BH, & Yeh I (2018). Human tumor genomics and zebrafish modeling identify SPRED1 loss as a driver of mucosal melanoma. Science, 362(6418), 1055–1060. 10.1126/science.aau6509 - DOI - PMC - PubMed
    1. Ackermann J, Frutschi M, Kaloulis K, McKee T, Trumpp A, & Beermann F (2005). Metastasizing melanoma formation caused by expression of activated N-RasQ61K on an INK4a-deficient background. Cancer Research, 65(10), 4005–4011. 10.1158/0008-5472.CAN-04-2970 - DOI - PubMed
    1. Akbani R, Akdemir KC, Aksoy BA, Albert M, Ally A, Amin SB, Arachchi H, Arora A, Auman JT, Ayala B, Baboud J, Balasundaram M, Balu S, Barnabas N, Bartlett J, Bartlett P, Bastian BC, Baylin SB, Behera M, ... Zou L. (2015). Genomic Classification of Cutaneous Melanoma. Cell, 161(7), 1681–1696. 10.1016/j.cell.2015.05.044 - DOI - PMC - PubMed
    1. Alexandrov LB, Kim J, Haradhvala NJ, Huang MN, Tian Ng AW, Wu Y, Boot A, Covington KR, Gordenin DA, Bergstrom EN, Islam SMA, Lopez-Bigas N, Klimczak LJ, McPherson JR, Morganella S, Sabarinathan R, Wheeler DA, Mustonen V, Getz G, ... Stratton MR. (2020). The repertoire of mutational signatures in human cancer. Nature, 578(7793), 94–101. 10.1038/s4158?6-020-1943-3 - DOI - PMC - PubMed
    1. Bao C, Wang J, Ma W, Wang X, & Cheng Y (2014). HDGF: A novel jack-of-all-trades in cancer. Future Oncology, 10(16), 2675–2685. 10.2217/fon.14.194 - DOI - PubMed

Publication types

MeSH terms

Substances