Case Reports
. 2020 Nov 25;183(5):1354-1366.e13.
doi: 10.1016/j.cell.2020.10.005. Epub 2020 Oct 9.

Vascular Disease and Thrombosis in SARS-CoV-2-Infected Rhesus Macaques

Affiliations
Case Reports

Vascular Disease and Thrombosis in SARS-CoV-2-Infected Rhesus Macaques

Malika Aid et al. Cell. .

Abstract

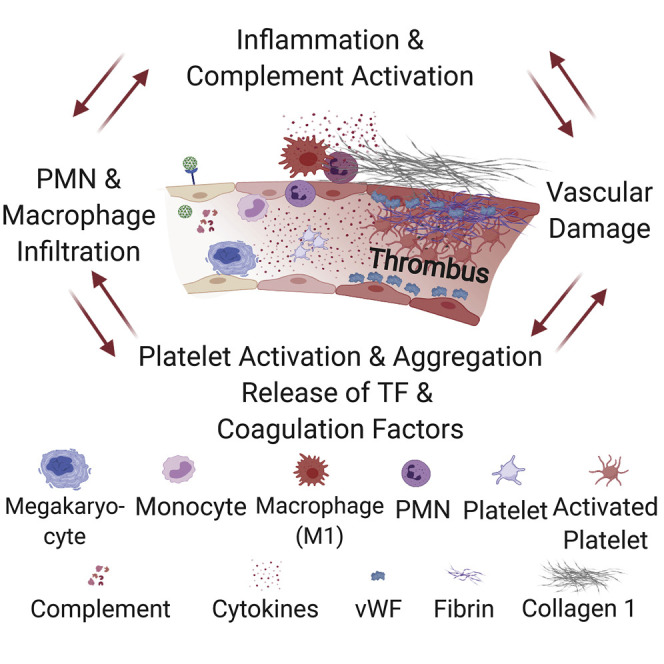
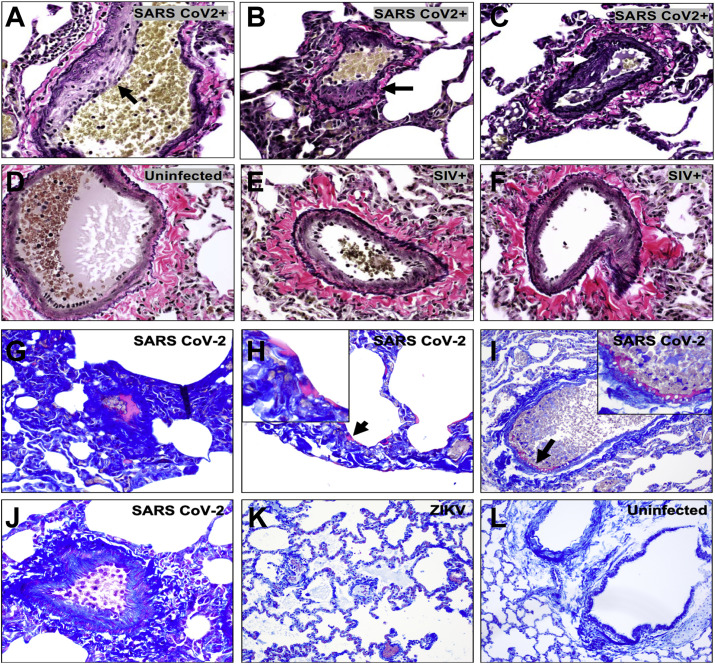
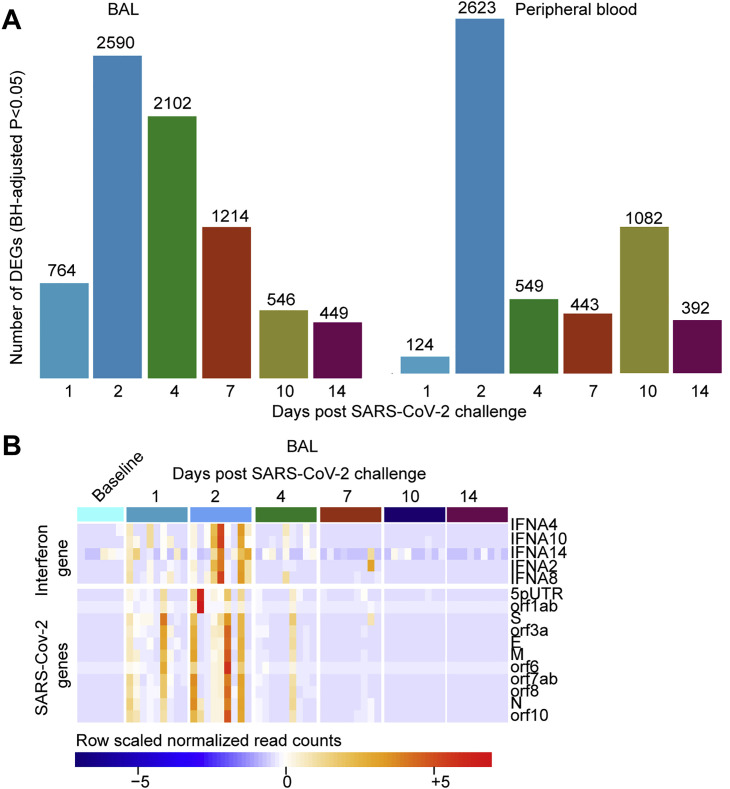
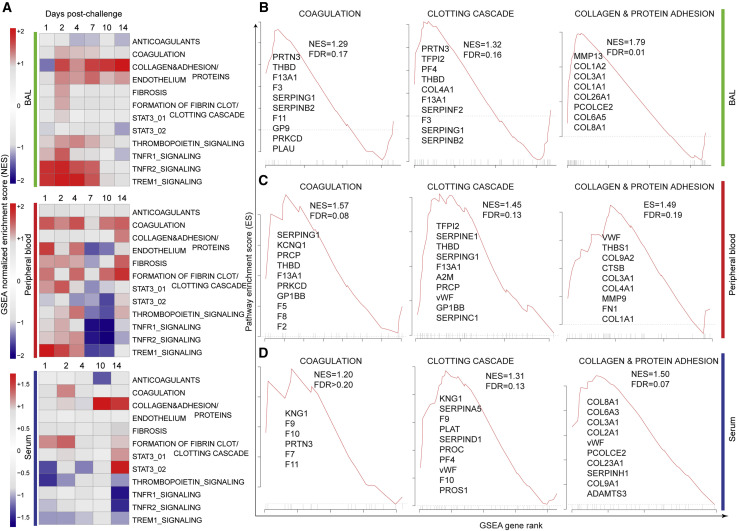
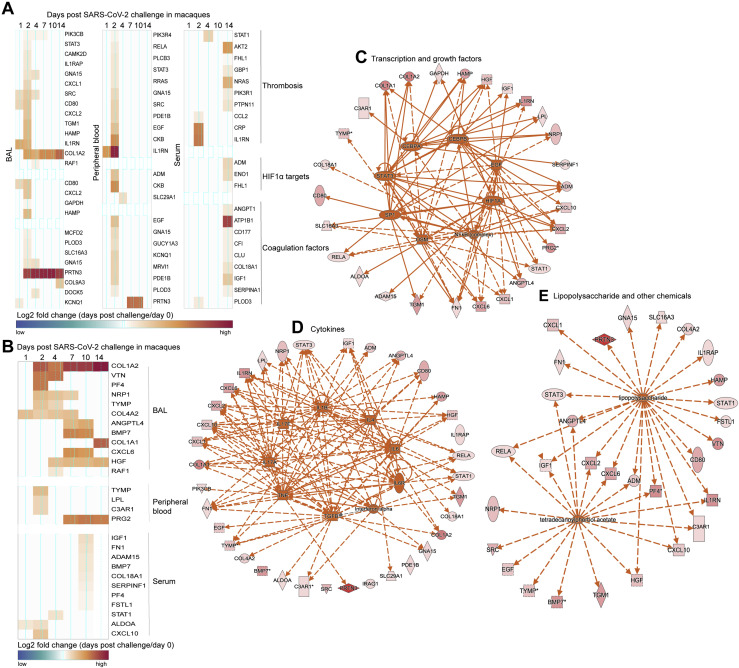
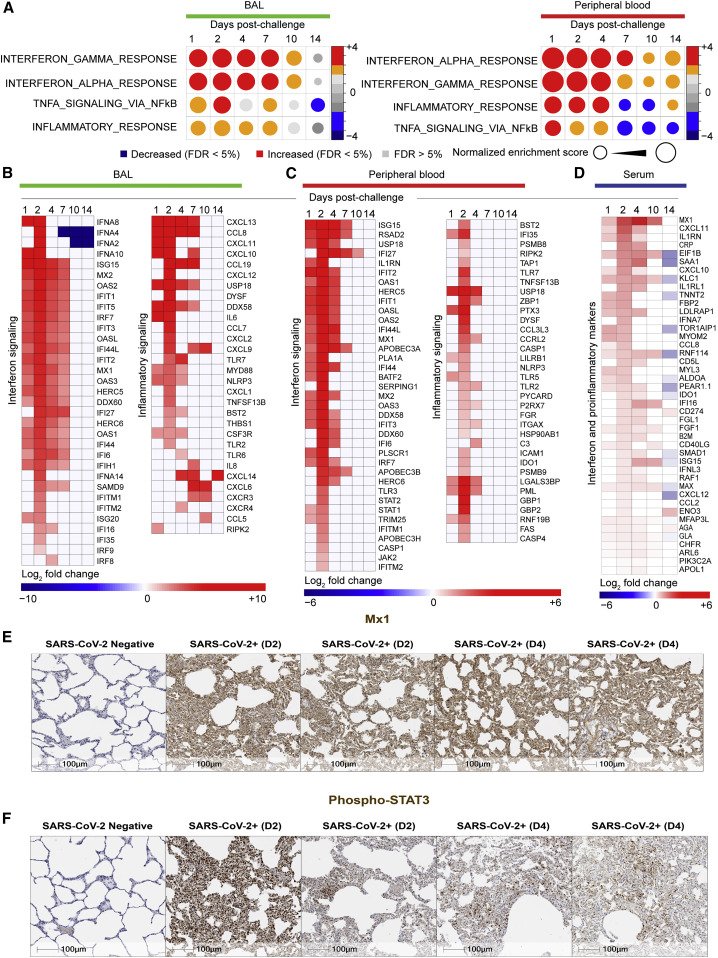
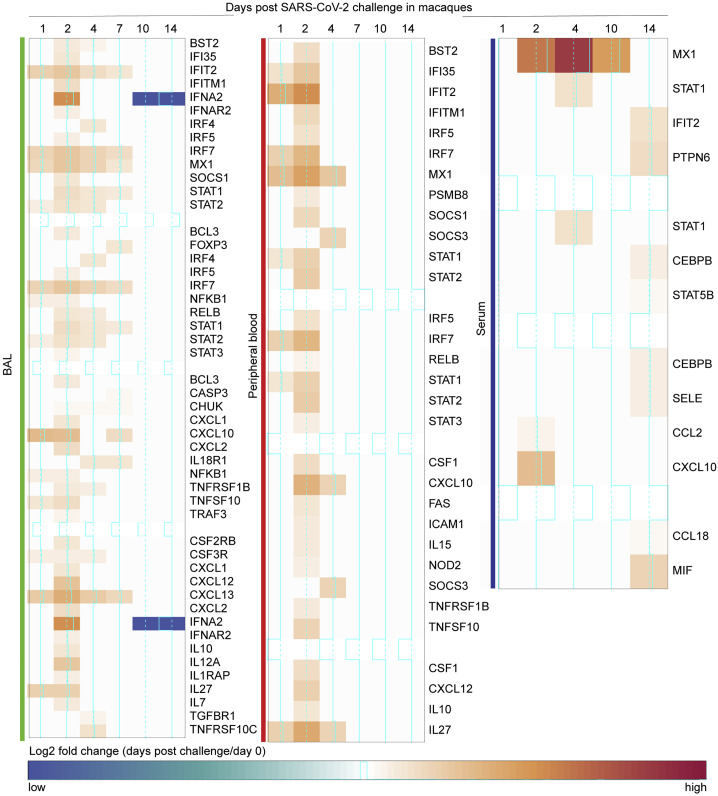
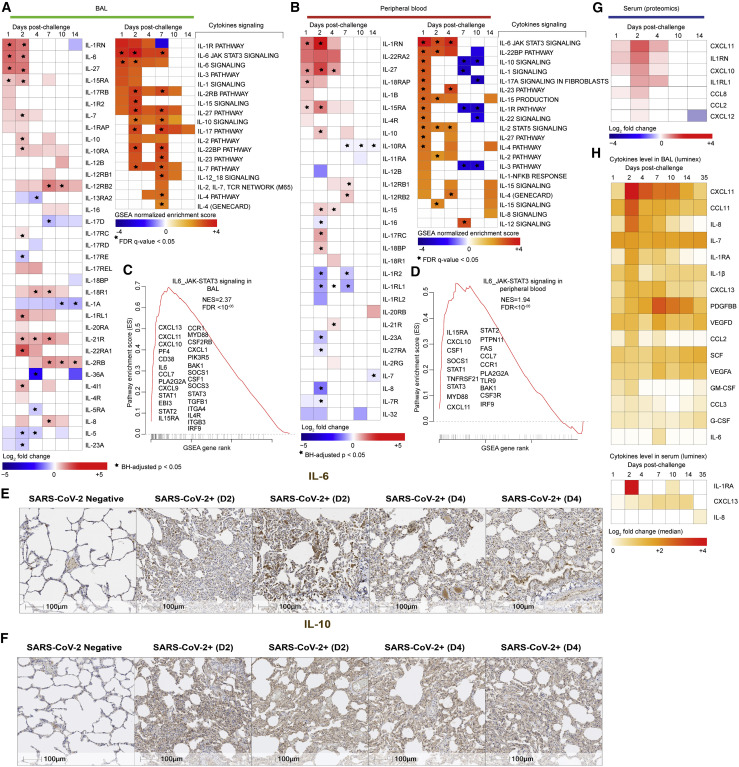
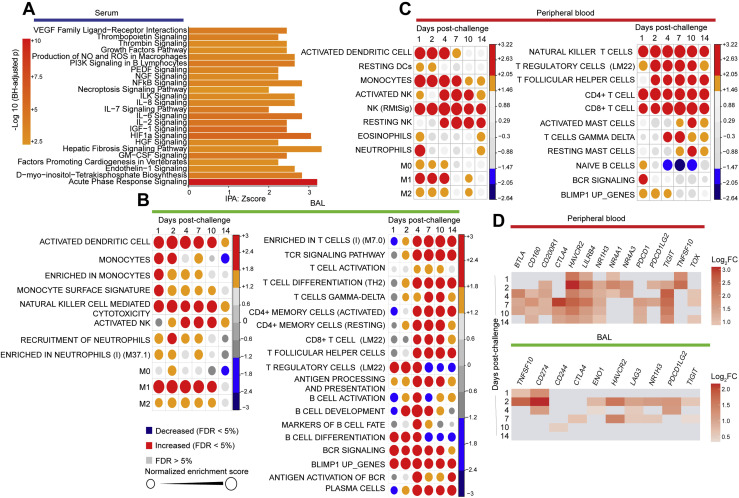
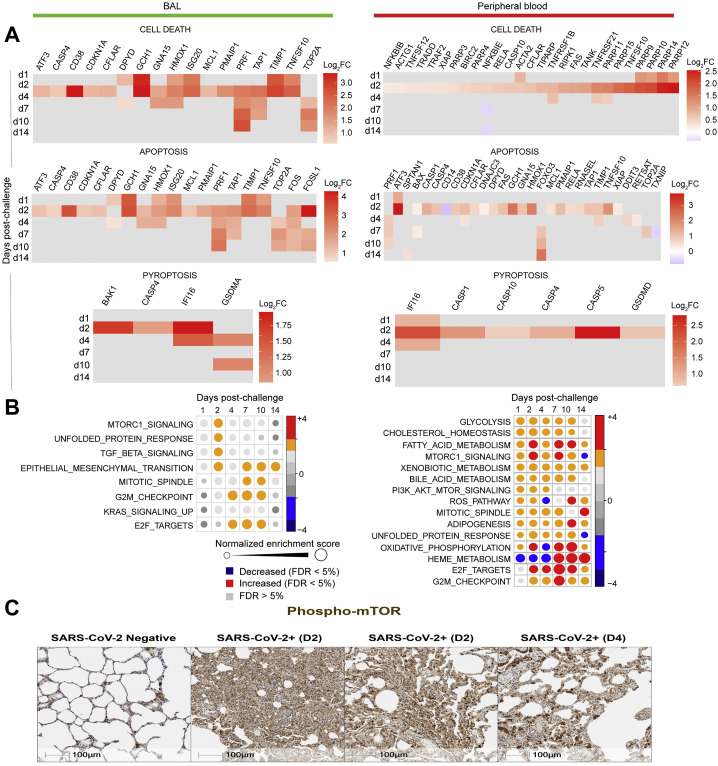
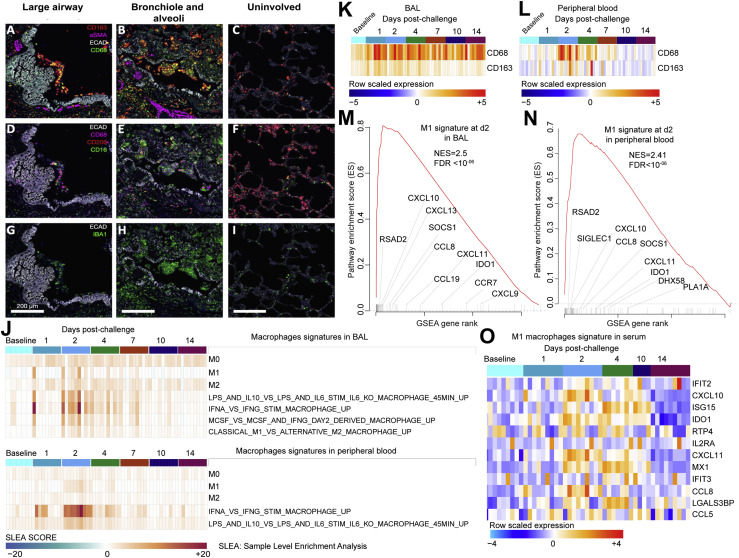
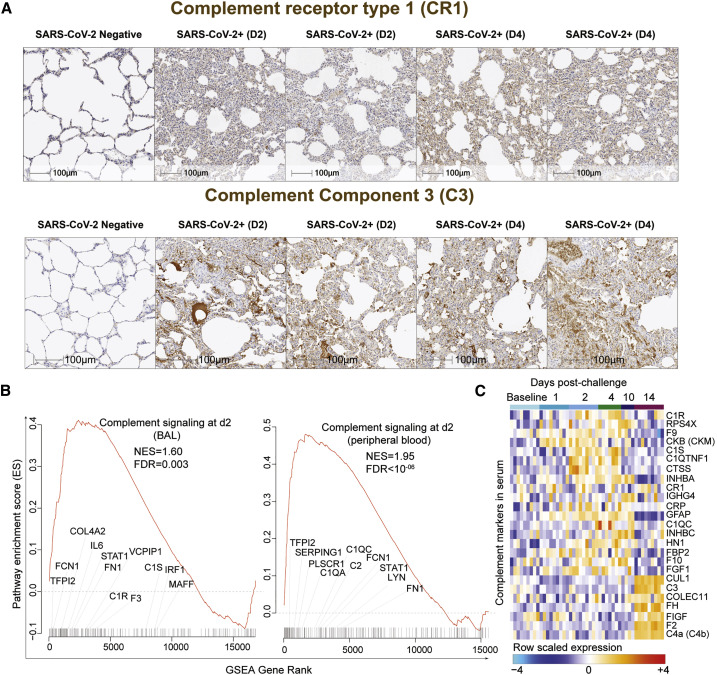
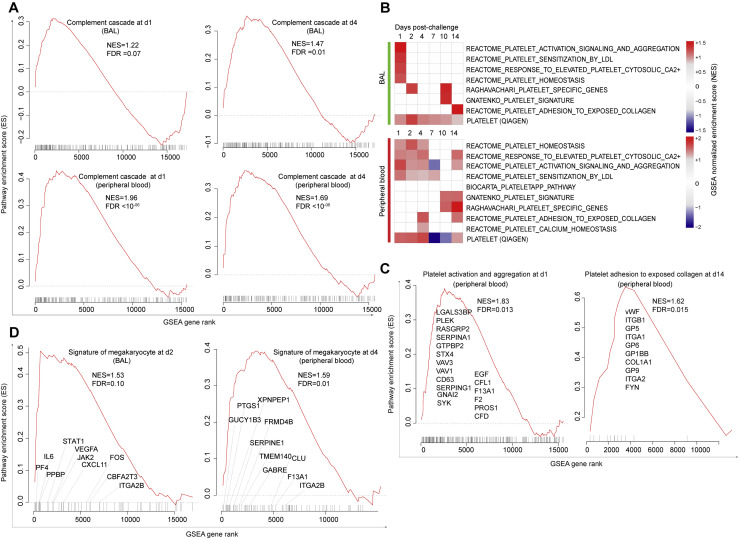
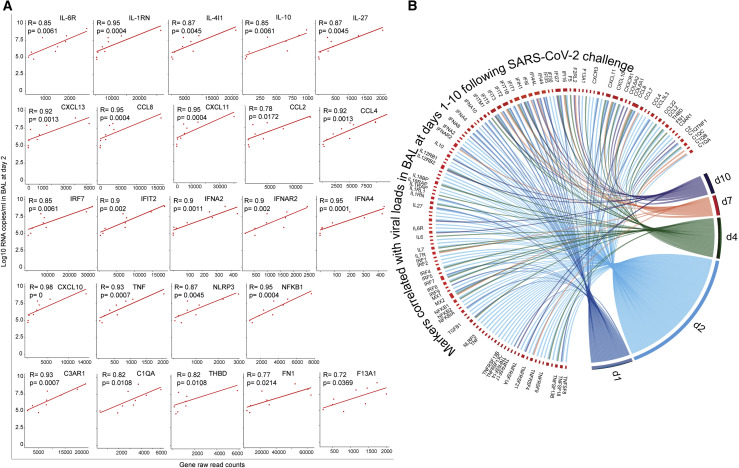
The COVID-19 pandemic has led to extensive morbidity and mortality throughout the world. Clinical features that drive SARS-CoV-2 pathogenesis in humans include inflammation and thrombosis, but the mechanistic details underlying these processes remain to be determined. In this study, we demonstrate endothelial disruption and vascular thrombosis in histopathologic sections of lungs from both humans and rhesus macaques infected with SARS-CoV-2. To define key molecular pathways associated with SARS-CoV-2 pathogenesis in macaques, we performed transcriptomic analyses of bronchoalveolar lavage and peripheral blood and proteomic analyses of serum. We observed macrophage infiltrates in lung and upregulation of macrophage, complement, platelet activation, thrombosis, and proinflammatory markers, including C-reactive protein, MX1, IL-6, IL-1, IL-8, TNFα, and NF-κB. These results suggest a model in which critical interactions between inflammatory and thrombosis pathways lead to SARS-CoV-2-induced vascular disease. Our findings suggest potential therapeutic targets for COVID-19.

Keywords: IFNα; SARS-CoV-2; coagulation; collagen; complement; macrophage; platelet; thrombosis; vWF; vascular.


Conflict of interest statement

Declaration of Interests The authors declare no competing interests.

Figures

None
Graphical abstract
Figure 1
Figure 1
Comparative Pathology of SARS-CoV-2-Associated Vascular Changes in Humans and Rhesus Macaques Histopathology images of endothelium from human autopsies of COVID-19 decedents (A–D) showing (A) Thrombi in capillaries of the septae (arrow; H&E stain). (B) Thrombus within alveolus (arrowhead) and fibrin deposition (magenta) within alveolar septae (Carstairs stain). (C) Alveolar setae expanded by a lymphocytic infiltrate, and organizing pneumonia (arrowhead) and medium-sized arteriole with endothelial injury (arrow) and lymphocytes within the tunica intima and media of the vessel wall and expanding adjacent alveolar septae (Verhoeff-Van Gieson [vvG] stain). (D) Organizing pneumonia with type II pneumocyte hyperplasia (arrowhead), and thrombosis () with endothelialitis in the septal vessels with lymphocytes undermining the endothelium (arrow; H&E stain). (E) Histopathology images of SARS-CoV-2-infected rhesus macaques demonstrate endothelialitis (H&E stain). (F) Focal endothelial proliferation (vvG stain). (G) Perivascular lymphocyte recruitment and extravasation with CD3 (white), CD31 endothelium (green), alpha-smooth muscle actin (aSMA, red), and DNA (blue). (H) Higher magnification showing margination of CD8+ T lymphocytes (magenta) along endothelium. (I) Microthrombus in alveolar septal capillary (H&E stain). (J) Vascular proliferation and occlusion (vvG stain). (K) Fibrin deposition (magenta) in alveolar septae (Carstairs stain). (L) Fibrin deposition along endothelium of vessels (Carstairs stain). (M) von Willebrand Factor (vWF). (N) Collagen 1 immunohistochemistry from uninfected and SARS-CoV-2-infected macaques, 2 (D2) and 4 (D4) days following challenge. Scale bars, 20 μm (B, C, E, and I–L), 50 μm (A and F), 100 μm (D, G, H, M, and N). H&E, hematoxylin and eosin; vvG stain. See also Figure S1.
Figure S1
Figure S1
Comparative Endothelial Changes in Macaques Infected with SARS-CoV-2, ZIKV, or SIV, Related to Figure 1 Verhoeff-Van Gieson staining of pulmonary endothelium from (A–C) SARS-CoV-2 infected rhesus macaques 2 days following infection compared to (D) uninfected and (E, F) chronically SIV-infected rhesus macaques. Carstairs staining of lung from SARS-CoV-2 infected macaques 2 days following challenge showing fibrin deposits (magenta) within a vessel (G), alveolar septae (H) (arrow; with high magnification inset), along the endothelium (I) (arrow; with high magnification inset), as compared to a normal vessel from a SARS-CoV-2 animal on day 2 (J), an ZIKV infected macaque (K), and an uninfected macaque (L).
Figure S2
Figure S2
SARS-CoV-2-Induced Transcriptional Changes in BAL and Peripheral Blood of Infected Macaques at Days 1–14 Post-Challenge, Related to Figure 2 (A) Barplots showing the number of differentially expressed genes (DEGs), in BAL (left panel) and peripheral blood (right panel) on days 1-14 following SARS-CoV-2 infection. Significant genes were assessed using a BH-adjusted p < 0.05. (B) Heatmap of the normalized read counts of SARS-CoV-2 viral genes and interferonα genes at baseline (pre-challenges) and on days 1, 2, 4, 7, 10 and 14 post-challenge, identified by bulk RNA-Seq in BAL fluid. Reads count normalization was performed using the rlog() function in the DESeq2 R package. Significant genes were assessed using a BH-adjusted p < 0.05.
Figure 2
Figure 2
Molecular Signatures of Thrombosis, Coagulation, and Fibrin Deposition in BAL, Peripheral Blood, and Serum of SARS-CoV-2-Infected Rhesus Macaques (A) GSEA was performed using curated thrombosis-related signatures, compiled from ingenuity pathway analysis (QIAGEN), Reactome, PathCards, and Biocarta databases. For each time point post SARS-CoV-2 challenge, genes (BAL and blood) and proteins (serum) were ranked using the log2 fold change expression compared to baseline, from high to low fold change. The ranked list was submitted to GSEA. For each time point, signatures significantly enriched in the top (increased) or in the bottom (decreased) of the ranked lists were selected using a nominal p value cutoff of <0.05 and a false discovery rate (FDR) q-value of <0.20. Heatmaps represent the GSEA NES of significant pathways on days 1, 2, 4, 7, 10, and 14 in BAL and peripheral blood and on days 1, 2, 4, 10, and 14 in serum. Color gradient corresponds to the GSEA NES of pathways that are decreased (in blue) or increased (in red) following SARS-CoV-2 infection in rhesus macaques. (B–D) Enrichment plots of the leading genes that contribute to the positive enrichment of thrombosis-related pathways shown in (A), in BAL (B), peripheral blood (C), and serum (D). The curves show the cumulative running enrichment score (ES), including the location of the maximum ES (peak of the curve) and the leading-edge genes represented by the small black bars on the x axis. The red plot corresponds to the ES for the pathway as the analysis walks down the ranked list. The small black bars on the x axis show where the members of the gene set appear in the ranked list of genes. The leading-edge subset of a gene set is the subset of members that contribute the most to the ES. All genes shown on the plots were increased by SARS-CoV-2 with a corrected p value (Benjamini-Hochberg method) <0.05. See also Figures S2 and S3.
Figure S3
Figure S3
SARS-CoV-2 Infection in Macaques Increased the Expression of Markers of Severe Inflammatory Disease Observed in Human and Markers of Severe to Critical COVID-19 Disease, Related to Figure 2 (A and B) Markers associated with thrombosis, HIF1α, coagulation factors (A) and thrombosis-associated markers increased in patients with severe to critical COVID-19 disease (B) increased in BAL, peripheral blood or serum of SARS-CoV-2 infected macaques. Heatmap gradient corresponds to the log2 transformed fold change on days 1-14 post challenge compared to baseline. (C–E) Genes increased by SARS-CoV-2 from panels A and B, were uploaded into IPA for upstream regulators analysis. Upstream regulators predicted by IPA were represented by dark orange nodes and include transcription factors (C), cytokines (D), and chemicals (E). Each upstream regulator is connected to its target genes with a colored arrow that depicts activation. Solid and dashed lines correspond to direct and indirect interactions predicted by IPA.
Figure 3
Figure 3
Interferon and Inflammatory Pathways Increased by SARS-CoV-2 in BAL and Peripheral Blood of Infected Macaques (A) Circles plot representation of the GSEA NES of interferon and inflammatory pathways (GSEA: FDR ≤ 5%) increased or decreased by SARS-CoV-2 in BAL (left panel) and in peripheral blood (right panel) on days 1, 2, 4, 7, 10, and 14 compared to control animals. An NES greater than 0 (in red) corresponds to a pathway for which member genes are increased by SARS-CoV-2, and an NES below 0 (in blue) corresponds to a pathway for which member genes are decreased by SARS-CoV-2. The size and color of each circle is proportional to the NES, where color gradient ranging from blue (significantly decreased), gray (not significant: FDR ≥ 5%), or red (significantly increased). (B and C) Heatmaps of the log2 transformed fold change of interferon and inflammatory markers in BAL (B) and in peripheral blood (C) that are increased or decreased by SARS-CoV-2 on days 1, 2, 4, 7, 10, and 14 compared to baseline. Differential expression significance was assessed with a corrected p < 0.05 using Benjamini-Hochberg (BH) method. (D) Heatmaps of log2 transformed fold change expression in serum (proteomics) of interferon genes, increased (in red gradient), decreased (in blue gradient), and white (not significant), on days 1, 2, 4, 10, and 14 compared to baseline. Differential expression significance was assessed with a corrected p < 0.05 using BH method. (E and F) IHC shows increase of MX1 and pSTAT3 on day 2 or day 4 following SARS-CoV-2 challenge. Serial sections of lung tissue showed increased expression of MX1 (type 1 interferon response gene) (E) and phosphorylated STAT3 (Phospho-STAT3 (F). Scale bars, 100 μm. See also Figure S4.
Figure S4
Figure S4
Markers of Interferon and Inflammatory Signaling Upregulated in Patients with Severe-to-Critical COVID-19 Disease Were Increased by SARS-CoV-2 in Macaques, Related to Figure 3 Markers of interferon and inflammatory signaling increased in BAL from patients with severe COVID-19 disease, and upregulated in BAL, peripheral blood and serum of rhesus macaques. Heatmaps represent the log2 fold change expression of these markers on days 1, 2, 4, 7, 10 and 14 in BAL, peripheral blood and serum.
Figure 4
Figure 4
Cytokines and Chemokines Up- or Downregulated by SARS-CoV-2 in BAL, Peripheral Blood, and Serum of Infected Macaques (A and B) (Left panels) Heatmaps of log2 transformed fold change expression of individual cytokines increased (in red gradient), decreased (in blue gradient), or white (not significant) in BAL (A) and peripheral blood (B) on days 1, 2, 4, 7, 10, and 14 compared to baseline. (Right panels) Heatmaps of the GSEA NES of cytokines’ signaling pathways increased (in red gradient), decreased (in blue gradient), or white (not significant) in BAL (A) and peripheral blood (B) on days 1, 2, 4, 7, 10, and 14 compared to baseline. All individual cytokines were significant with a p < 0.05 for at least one time point post-challenge compared to baseline and all cytokines’ signaling pathways were significant with a GSEA nominal p < 0.05 for at least one time point post-challenge compared to baseline. Star symbol indicates individual cytokines or chemokines and pathways that remain significant after correction for multiple comparisons (BH method) or using a FDR of <5%. (C and D) Enrichment plot showing differentially expressed genes (DEGs) that contribute to the positive enrichment of the IL6-JAK-STAT3 signaling pathway on day 2 in BAL (C) and peripheral blood (D) of infected macaques. Plot of the running sum for pathway score in the dataset, including the location of the maximum ES and the leading-edge subset. The red plot shows the ES for the gene set as the analysis walks down the ranked list. The score at the peak of the plot (the score furthest from 0.0) is the ES for the gene set. The small black bars on the x axis show where the members of the gene set appear in the ranked list of genes. The leading-edge subset of a gene set is the subset of members that contribute most to the ES. The leading genes were shown for each plot. (E and F) IHC shows increased expression of IL-6 (E) and IL-10 (F) on day 2 or day 4 following SARS-CoV-2 challenge. Scale bars, 100 μm. (G) Heatmaps of log2 transformed fold change expression in serum (proteomics) of cytokines and chemokines increased (red gradient), decreased (blue gradient), and white (not significant), on days 1, 2, 4, 10, and 14 following challenge. Differential expression significance was assessed using a BH-corrected p < 0.05. (H) Cytokine levels measured by the Luminex assay in BAL (top panel) and in serum (lower panel) increased by SARS-CoV-2 in rhesus macaques on days 1, 2, 4, 7, 10, 14, or 35. All the cytokines and chemokines that are significant (Wilcoxon-Mann-Whitney test, p < 0.05) for at least one time point were shown on the heatmaps. Color gradient ranging from white (not significant) to red (highly significant) corresponds to the log2 transformation of the fold change of cytokines’ median levels compared to baseline. See also Figures S5 and S6.
Figure S5
Figure S5
Signatures of Cytokines’ Signaling, Innate and Adaptive Immune Cell Populations, and Immune Exhaustion Were Increased in Serum, BAL, and Peripheral Blood of SARS-CoV-2-Infected Macaques, Related to Figure 4 (A) Functional analysis using ingenuity pathway (IPA) of proteins increased in serum on days 1-14. Genes increased in serum on infected macaques were uploaded into IPA for pathway enrichment analysis. Bar plots represent the IPA pathway enrichment Z-score, where color gradient corresponds to the –Log10 BH-adjusted p for each pathway (p < 0.05, Z-score > 2). (B and C) Circles plot representation of the GSEA normalized enrichment score (NES) of innate (left panel) and adaptive (right panel) immune cells signatures (GSEA: FDR £ 5%) increased or decreased by SARS-CoV-2 in BAL (B) and in peripheral blood (C) of rhesus macaques. An NES greater than 0 (in red) corresponds to a pathway for which member genes are increased by Sars-CoV-2. an NES below 0 (in blue) corresponds to a pathway for which member genes are decreased by Sars-CoV-2. The size and color of each circle is proportional to the NES, where color gradient ranging from blue (decreased), gray (not significant: FDR > = 5%) and red (increased). (D) Checkboard plot of immune exhaustion markers increased by SARS-Cov-2 in BAL and in peripheral blood on days 1, 2, 4, 7, 10 and 14 post-challenge. Color gradient corresponds to the log2 fold change expression on days 1, 2, 4, 7, 10 and 14 compared to baseline. All markers were selected using a BH-corrected p < 0.05.
Figure S6
Figure S6
Molecular Signatures of Cell Death and Apoptosis and Metabolism Increased in BAL and Peripheral Blood of SARS-CoV-2-Infected Macaques, Related to Figure 4 (A) Checkboard plot of cell death, apoptosis, and pyroptosis increased by SARS-Cov-2 in BAL (left panel) and in peripheral blood (right panel) on days 1, 2, 4, 7, 10 and 14. Color gradient corresponds to the log2 fold change expression on days 1, 2, 4, 7, 10 and 14 compared to baseline. All markers were selected using a BH-adjusted p < 0.05. (B) Circles plot representation of the GSEA normalized enrichment score (NES) of metabolism signatures (left panel: BAL; right panel: peripheral blood) increased by SARS-CoV-2. An NES greater than 0 (in red) corresponds to a pathway for which member genes are increased by SARS-CoV-2, an NES below 0 (in blue) corresponds to a pathway for which member genes are decreased by Sars-CoV-2. An NES > 0 (in red) corresponds to a pathway for which member genes are increased by Sars-CoV-2. The size and the color of each circle is proportional to the NES, where color gradient ranging from blue (decreased), gray (not significant: FDR > 5%) and red (increased). (C) Rhesus macaques were necropsied before (SARS-CoV-2 negative) or after high-dose SARS-CoV-2 challenge on day 2 (D2) and day 4 (D4) following challenge. Serial sections of lung tissue showed increased expression of phosphorylated mTOR (Phospho-mTOR). Scale bars = 100 μm.
Figure 5
Figure 5
Multiplexed CyCIF Immunofluorescence Images Showing Macrophages in the Lungs of SARS-CoV-2-Challenged Macaques as well as Macrophages Transcriptional Signatures in BAL, Peripheral Blood, and Serum of Infected Macaques Multiplexed CyCIF images showing macrophage populations in large airways (A, D, and G) and in bronchioles and alveoli (B, E, and H) in regions of lung consolidation as compared to uninvolved lung on day 2 following SARS CoV-2 infection. Tissue architecture is defined by E-Cadherin (grayscale), smooth muscle actin (aSMA, magenta), and DNA (blue). (A–C) CD68 (green) and CD163 (red) are used to stain macrophages in the context of the tissue markers smooth muscle actin (αSMA, magenta). (D–F) Alveolar (CD206, red) and reactive (CD16, green and CD68, magenta) macrophage markers. (G–I) Staining for activated macrophages (IBA1, green). Scale bars, 200 μM. (J) Heatmaps presenting the sample-level enrichment analysis (SLEA) Z score of macrophages’ signatures for each individual animal at baseline and on days 1, 2, 4, 7, 10, and 14 following SARS-CoV-2 infection in BAL (top panel) and in peripheral blood (lower panel). Columns are grouped by time point, where each column corresponds to an individual animal. Each row represents a signature of macrophages that is increased by SARS-CoV-2. An SLEA Z score greater than 0 corresponds to a pathway for which member genes are upregulated, whereas an SLEA Z score less than 0 corresponds to a pathway for which genes are downregulated in that sample. (K and L) Markers of macrophages CD163 and CD68 increased in BAL (K) and peripheral blood (L). Heatmaps show the row-scaled expression (using the Z score method) of CD163 and CD68 across all animals. Animals were grouped by time point. Columns correspond to individual animals, and rows correspond to genes. Differential expression significance was assessed with a BH-adjusted p < 0.05. (M and N) Enrichment plot showing DEGs that contribute to the positive enrichment of M1 macrophages’ signature on day 2 post-challenge in BAL (M) and in peripheral blood (N). The curve shows the cumulative ES of the M1 signature, including the location of the maximum ES (peak of the curve) and the leading-edge genes. The red plot shows the ES for the gene set as the analysis walks down the ranked list. The small black bars on the x axis show where the members of the gene set appear in the ranked list of genes. The leading-edge subset of a gene set is the subset of members that contribute the most to the ES. Selected leading-edge genes were shown for each plot. (O) Heatmap showing the row-scaled expression of markers of M1 macrophages’ signature in serum on days 1, 2, 4, 10, and 14 following SARS-CoV-2 infection. Columns represent individual animals grouped by time point and each row corresponds to an individual protein. Proteins’ expressions were scaled using the row Z score method and ranges from cyan (highly decreased) to red (highly increased). Differential expression significance was assessed with a BH-adjusted p < 0.05.
Figure 6
Figure 6
Complement Activation and Coagulation Cascade Pathways Increased by SARS-CoV-2 in BAL, Peripheral Blood, and Serum of Infected Macaques (A) Rhesus macaques were necropsied before (SARS-CoV-2 negative) or after high-dose SARS-CoV-2 challenge on day 2 (D2) and day 4 (D4) following challenge. Serial sections of lung tissue showed increased expression complement receptor 1 (CR1) and complement component 3 (C3). Scale bars, 100 μm. (B) Enrichment plot showing DEGs that contribute to the positive enrichment of the complement pathway on day 2 in BAL (left panel) and in peripheral blood (right panel) of infected macaques. The curve shows the cumulative running ES of the complement pathway, including the location of the maximum ES (peak of the curve) and the leading-edge genes. The red plot shows the running ES for the gene set as the analysis walks down the ranked list. The small black bars on the x axis show where the members of the gene set appear in the ranked list of genes. The leading-edge subset of a gene set is the subset of members that contribute the most to the ES. Selected leading-edge genes were shown for each plot. (C) Heatmap shows the row-scaled expression (Z score) for complement activation markers and complement cascade in serum on days 1, 2, 4, 10, and 14 following SARS-CoV-2 infection. Columns represent individual animals grouped by time point and each row corresponds to an individual protein. Proteins expression were averaged using the row Z score method and ranges from cyan (highly decreased) to red (highly increased). Differential expression significance was assessed with a BH-adjusted p < 0.05. See also Figure S7.
Figure S7
Figure S7
SARS-CoV-2 Infection Increased Expression of Signatures of Complement, Platelet Activation and Adhesion, and Megakaryocytes in BAL and Peripheral Blood of Infected Macaques, Related to Figure 6 (A) Enrichment plot of DEGs that contribute to the positive enrichment of signatures of complement activation cascade on days 1 and 4 in BAL (top panels) and in peripheral blood (lower panels). The curve shows the cumulative running pathway enrichment score ES, including the location of the maximum enrichment score (peak of the curve) and the leading-edge genes represented by the small black bars on the x axis. The red plot corresponds to the running ES for the gene set as the analysis walks down the ranked list. The small black bars on the x axis show where the members of the gene set appear in the ranked list of genes. The leading-edge subset of a gene set is the subset of members that contribute the most to the ES. False discovery rate (FDR) and the normalized enrichment score (NES) were shown for each plot. (B) GSEA was performed using signatures of platelet activation and aggregation compiled from the MSigDB C2 database. Heatmaps represent the GSEA normalized enrichment score on days 1-14 in BAL (top panel) and peripheral blood (lower panel). Color gradient corresponds to the GSEA normalized enrichment score of pathways decreased (in blue) or increased (in red) following SARS-CoV-2 infection in rhesus macaques. All pathways were significant for at least one time point with a false discovery rate (FDR) < 0.10 and a nominal p of < 0.05. (C and D) Enrichment plot of DEGs that contributed to the positive enrichment of signatures of platelet activation and aggregation on day 1 (left panel) and platelet adhesion to collagen on day 14 (right panel) in peripheral blood (C) and signature of megakaryocyte cells on day 2 in BAL (left panel) and on day 4 (right panel) in peripheral blood (D). The curve shows the cumulative running pathway enrichment score ES, including the location of the maximum enrichment score (peak of the curve) and the leading-edge genes represented by the small black bars on the x axis. The red plot corresponds to the running ES for the gene set as the analysis walks down the ranked list. The small black bars on the x axis show where the members of the gene set appear in the ranked list of genes. The leading-edge subset of a gene set is the subset of members that contribute the most to the ES. Geneset false discovery rate (FDR) or nominal p values were shown.
Figure 7
Figure 7
Proinflammatory Cytokines, ISGs, IFNα, and Complement Cascade Genes Correlated with SARS-CoV-2 Viral Loads in BAL of Infected Macaques (A) The expression of cytokines, ISGs, IFNα, and complement correlated with day 2 viral loads in BAL. The x axis corresponds to gene raw read counts and the y axis corresponds to log10 SARS-CoV-2 RNA copies/mL in BAL. A Spearman correlation was used for statistical analysis. (B) The expression of additional cytokines, chemokines, and ISGs correlated positively with viral loads in BAL on days 1, 2, 4, 7, and 10 post SARS-CoV-2 challenge. Colored lines connecting genes with time points represent the Spearman correlation between the expression of each gene with viral loads across all animals for the same time point. For clarity, each time point was shown in a different color.

References

    1. Ackermann M., Verleden S.E., Kuehnel M., Haverich A., Welte T., Laenger F., Vanstapel A., Werlein C., Stark H., Tzankov A., et al. Pulmonary Vascular Endothelialitis, Thrombosis, and Angiogenesis in Covid-19. N Engl J Med. 2020;383:120–128. - PMC - PubMed
    1. Arunachalam P.S., Wimmers F., Mok C.K.P., Perera R.A.P.M., Scott M., Hagan T., Sigal N., Feng Y., Bristow L., Tak-Yin Tsang O., et al. Systems biological assessment of immunity to mild versus severe COVID-19 infection in humans. Science. 2020;369:1210–1220. - PMC - PubMed
    1. Bikdeli B., Madhavan M.V., Jimenez D., Chuich T., Dreyfus I., Driggin E., Nigoghossian C., Ageno W., Madjid M., Guo Y., et al. Global COVID-19 Thrombosis Collaborative Group, Endorsed by the ISTH, NATF, ESVM, and the IUA, Supported by the ESC Working Group on Pulmonary Circulation and Right Ventricular Function COVID-19 and Thrombotic or Thromboembolic Disease: Implications for Prevention, Antithrombotic Therapy, and Follow-Up: JACC State-of-the-Art Review. J Am Coll Cardiol. 2020;75:2950–2973. - PMC - PubMed
    1. Blanco-Melo D., Nilsson-Payant B.E., Liu W.C., Uhl S., Hoagland D., Moller R., Jordan T.X., Oishi K., Panis M., Sachs D., et al. Imbalanced Host Response to SARS-CoV-2 Drives Development of COVID-19. Cell. 2020;181:1036–1045.e9. - PMC - PubMed
    1. Carsana L., Sonzogni A., Nasr A., Rossi R.S., Pellegrinelli A., Zerbi P., Rech R., Colombo R., Antinori S., Corbellino M., et al. Pulmonary post-mortem findings in a series of COVID-19 cases from northern Italy: a two-centre descriptive study. Lancet Infect Dis. 2020;20:1135–1140. - PMC - PubMed

Publication types

MeSH terms