. 2020 Nov 10;15(5):1080-1094.
doi: 10.1016/j.stemcr.2020.09.007. Epub 2020 Oct 15.

Live Imaging Reveals Cerebellar Neural Stem Cell Dynamics and the Role of VNUT in Lineage Progression

Affiliations

Live Imaging Reveals Cerebellar Neural Stem Cell Dynamics and the Role of VNUT in Lineage Progression

Lucía Paniagua-Herranz et al. Stem Cell Reports. .

Abstract

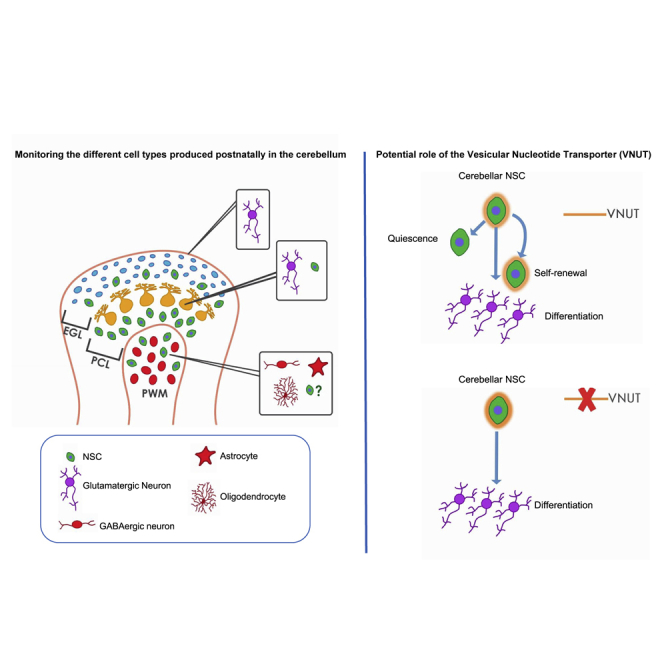
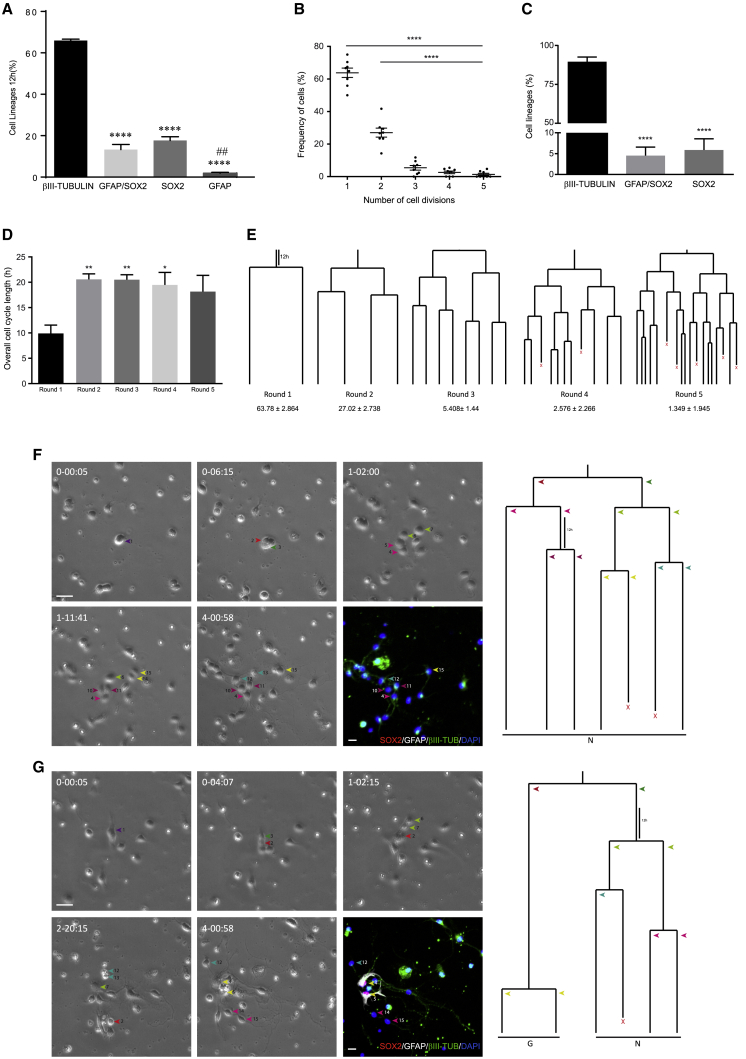
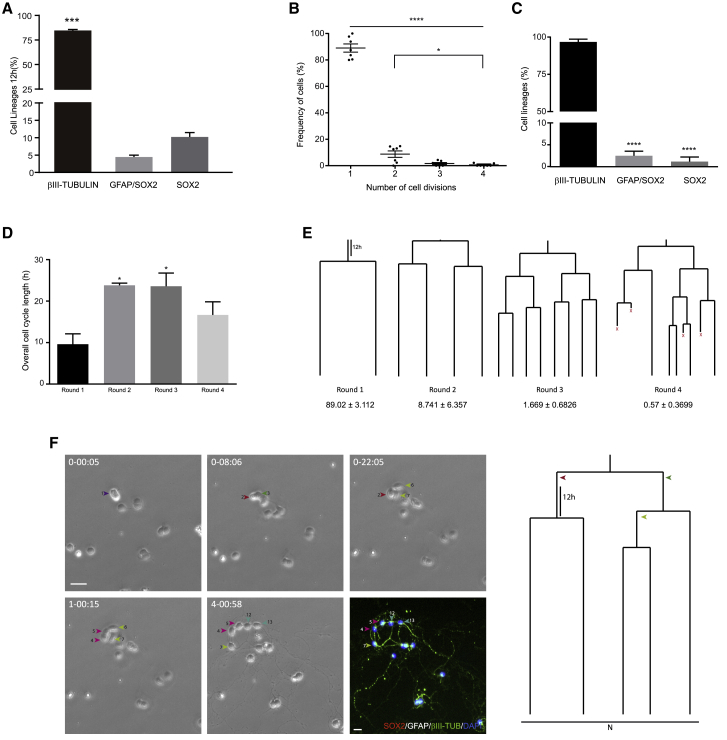
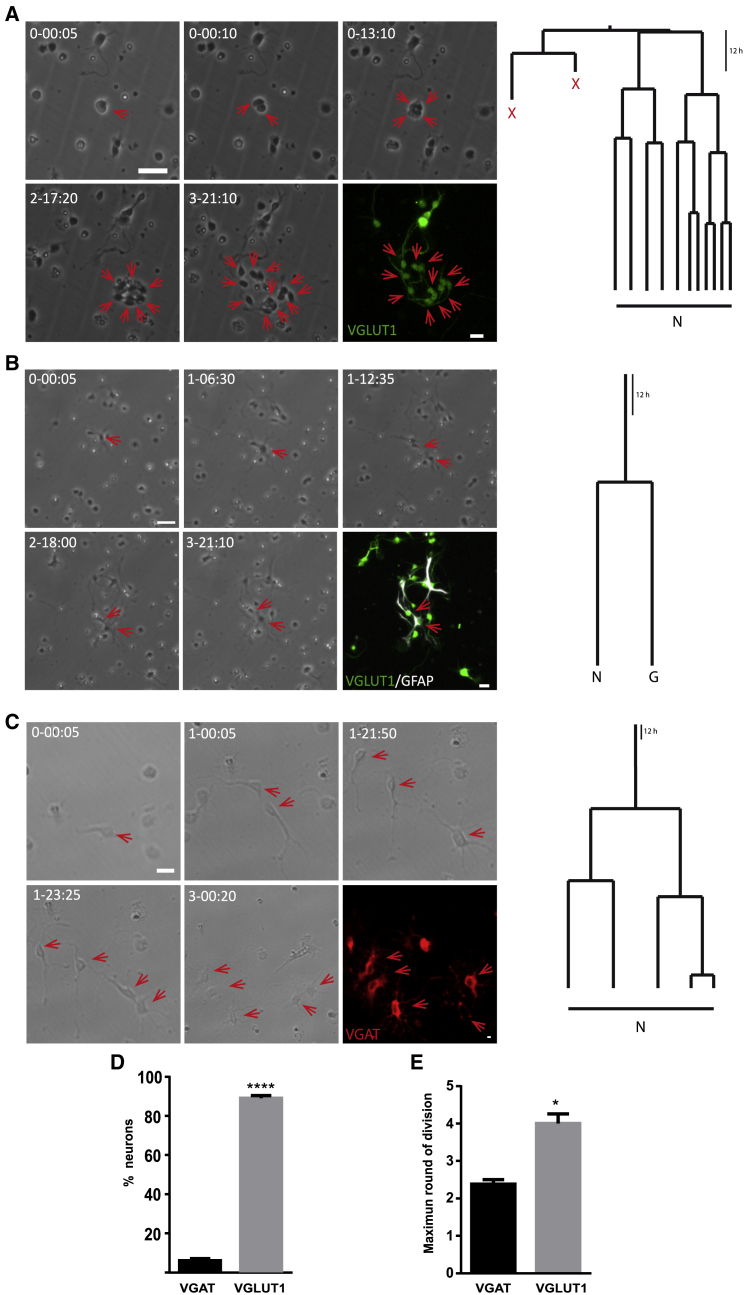
Little is known about the intrinsic specification of postnatal cerebellar neural stem cells (NSCs) and to what extent they depend on information from their local niche. Here, we have used an adapted cell preparation of isolated postnatal NSCs and live imaging to demonstrate that cerebellar progenitors maintain their neurogenic nature by displaying hallmarks of NSCs. Furthermore, by using this preparation, all the cell types produced postnatally in the cerebellum, in similar relative proportions to those observed in vivo, can be monitored. The fact that neurogenesis occurs in such organized manner in the absence of signals from the local environment, suggests that cerebellar lineage progression is to an important extent governed by cell-intrinsic or pre-programmed events. Finally, we took advantage of the absence of the niche to assay the influence of the vesicular nucleotide transporter inhibition, which dramatically reduced the number of NSCs in vitro by promoting their progression toward neurogenesis.

Keywords: VNUT; cerebellum; live imaging; neural stem cell; postnatal neurogenesis; purinergic signaling; time-lapse video microscopy.


Figures

None
Graphical abstract
Figure 1
Figure 1
Cell Dynamics of Cerebellar Neural Progenitors Isolated on Postnatal Day 0 (A) Quantification of the cell populations isolated 12 h after culture, identifying the neuronal cells by βIII-tubulin labeling, NSC intermediate progenitors by GFAP/SOX2 or SOX2 labeling, and parenchymal astrocytes by GFAP labeling. (B) Relative proportions of the number of rounds of cell division undergone by the cells during live imaging experiments. (C and D) (C) Relative contribution of cell lineage at the end of live imaging experiments. βIII-tubulin refers to lines containing only neurons, GFAP/SOX2 refers to those containing neurons and NSCs or only NSCs, and SOX2 refers to the lines containing both SOX2 and neurons or only SOX2 cells. (D) Average cell-cycle length according to the round of division. (E) Neurogenic lineages tracked. Values below round numbers indicate the relative proportions. (F) Symmetric lineage trees generating neuronal progeny (N, neuron; X, cell death). Phase contrast images depicting lineage progression obtained by time-lapse video microscopy at different time points (day-h:min), the last image corresponds to ICC for SOX2 (red), GFAP (white), and βIII-tubulin (green). Arrowheads point to the different cells comprised within the lineage tree. Scale bar, 30 μm. (G) Asymmetric lineage generating neuronal and NSC progeny (N, neuron; G, GFAP/SOX2+ astroglia; X, cell death) described as in (F). The values represent the mean ± SEM (n = 5 independent experiments); p < 0.05, ∗∗p < 0.01, ∗∗∗p < 0.001, ANOVA with Tukey's multiple comparison test.
Figure 2
Figure 2
Cell Dynamics of Cerebellar Neural Progenitors Isolated on Postnatal Day 5 (A) Quantification of the proportions of the cell populations isolated after 12 h in culture. Neuronal cells were identified by βIII-tubulin labeling, NSC intermediate progenitors by GFAP/SOX2 or SOX2 labeling. (B) Relative proportions of the rounds of cell division undergone by cells monitored by live imaging. (C) Relative contribution of cell lineages at the end of live imaging experiments. The βIII-tubulin lines contain only neurons, the GFAP/SOX2 lines only NSCs, and the SOX2 lines only SOX2-labeled cells as asymmetric cell divisions were not observed at P5. (D) Average cell-cycle length for each round of division. (E) Example of neurogenic lines traced during the experiment with their relative contribution. (F) Symmetric lineage tree generating neuronal progeny (N, neuron). Phase contrast images showing lineage progression obtained by time-lapse video microscopy at different time points (day-h:min). The last image corresponds to post-imaging ICC for SOX2 (red), GFAP (white), and βIII-tubulin (green). Arrowheads point to the different cells comprised within the lineage tree. Scale bar, 30 μm. The values represent the mean ± SEM (n = 5 independent experiments); p < 0.05, ∗∗p < 0.01, ∗∗∗p < 0.001, ANOVA with Tukey's multiple comparison test.
Figure 3
Figure 3
P0 Cell Preparation Generates both Glutamatergic and GABAergic Neurons (A) Symmetric lineage generating glutamatergic neuronal progeny (N, neuron; X, cell death). (B) Asymmetric lineage generating both glutamatergic neuronal and astroglial progeny (N, neuron; G, GFAP astroglia). (C) Symmetric lineage generating GABAergic neuronal progeny (N, neuron). All the lineage trees are described as follows: phase contrast images obtained by time-lapse video microscopy at different time points (day-h:min), the last image corresponds to ICC for VGlut1 (green), GFAP (white), or VGAT (red). (D) Relative proportions of glutamatergic (VGlut1) and GABAergic (VGAT) neurons obtained after live imaging experiments. (E) Maximum number of rounds of amplifying divisions of either the glutamatergic or GABAergic lineages. The values represent the mean ± SEM (n = 8 independent experiments); p < 0.05, ∗∗∗∗p < 0.0001, t test. Scale bar, 30 μm.
Figure 4
Figure 4
Electrophysiological Characterization of 7-Day-Old P0 Cerebellar Cultures (A) Left panel: bright-field image of a bipolar cell. A patch-clamp recording pipette placed onto the cell soma is shown. The two other glass pipettes are used for drug (GABA and glutamate) application. Scale bar, 20 μm. Middle panel: voltage- and current-clamp recordings from the imaged cell. Traces to the left represent inward and outward currents activated by a 100-ms voltage pulse to +10 mV from a Vh of −80 mV; traces to the right represent action potential-like voltage changes evoked by a 75-pA current injection from a Vcomm of −60 mV. Recordings are representative of those obtained in five cells from two cultures. Right panel: traces to the left depict current responses to GABA (100 μM) and glutamate (1 mM). Traces to the right represent current (above) and voltage (below) responses to serotonin (5-HT, 100 μM) application in the same cell. Black lines above current traces show time of drug application. Results are representative of those obtained in 15, 9, and 10 cells for glutamate, GABA, and 5-HT, respectively. (B) Upper panel: bright-field image of a multipolar cell. Other elements are like those shown in (A). Scale bar 20 μm. Lower panel: current responses to GABA, glutamat, and 5-HT in the imaged cell. The horizontal bar shows the application of the drugs at the indicated concentration. Notice that 5-HT was not able to activate any current. Results are representative of those obtained in 11 and 8 cells for glutamate and GABA, respectively. (C) Left panel: bright-field image of a bipolar and a multipolar cell. The location of a patch pipette and of two (5-HT and MK-801) drug application pipettes is indicated. Scale bar, 20 μm. Right panel: application of 5-HT (100 μM; see arrows) onto the bipolar unclamped cell evoked synaptic-like currents in the neighboring patch-clamped multipolar cell. Current activity was sensitive to superfusion of MK-801 (1 μM), an NMDA antagonist (n = 4).
Figure 5
Figure 5
VNUT Expression during Postnatal Cerebellar Development and Co-localization with Vesicular/Lysosomal Markers and NESTIN (A) VNUT protein expression during cerebellar development normalized to the constitutive GAPDH expression. (B) Immunofluorescence showing the expression of VNUT at different stages of cerebellar development. VNUT is expressed in all the neurogenic areas in the developing cerebellum but seems to be especially prominent in the EGL and PCL. Scale bar, 50 μm. (C) Co-localization of VNUT (red) with SYNAPTOPHYSIN and SYNAPTOBREVIN or LAMP-1 (green) in P0 cerebellum. Scale bar, 50 μm. (D) Immunofluorescence of the initial stages (P0, P3, and P7) of PC development showing a high degree of co-localization between VNUT (red) and the stem cell marker, NESTIN (green). Scale bar, 100 μm. The right-hand panels show higher magnifications focusing on the EGL and PCL. Scale bar, 15 μm. Arrowheads highlight the co-localization between VNUT and NESTIN+ cells. Values represent the mean ± SEM (n = 5 independent experiments); p < 0.05, ANOVA with Tukey's multiple comparison test.
Figure 6
Figure 6
VNUT Expressed by SOX2+ Cells in the Developing and Adult Cerebellum (A) Immunofluorescence images of the co-localization of VNUT (red) with SOX2 (green) in cells of the developing (P0 and P7) and adult cerebellum. Scale bar, 50 μm. The panels on the right are higher magnification images of the SOX2+/VNUT+ cells, indicated by arrowheads. Scale bar, 15 μm. (B). Immunofluorescence analysis of the VNUT expression in cell culture. The upper left panel represents a general view of the cerebellar cell culture. VNUT co-localizes with neurons (βIII-tubulin+), astrocytes (GFAP+), NSCs (NESTIN+, GFAP+/SOX2+, NESTIN+/SOX2+), and oligodendrocytes (O4+). Scale bar, 50 μm.
Figure 7
Figure 7
Effect of VNUT Inhibition on the Cerebellar NSC Population (A) Number of clones giving rise to symmetric neurogenic trees in the absence (Control) or the presence of clodronate (100 nM). Values represent the mean ± SEM (n = 5 independent experiments); p < 0.05, unpaired t test. (B) Percentage of neurogenic lineages undergoing one to five rounds of amplifying divisions in the presence or absence of clodronate. (C) Proportion of cell types in the lineages when the preparations were maintained in the presence or absence of clodronate. Values represent the mean ± SEM (n = 5 independent experiments); p < 0.05, ANOVA with Tukey's multiple comparison test. (D) Histograms depicting the level of expression of genes associated with the specification of the glutamatergic lineage (Atoh1, Neurod1, and Cntn2) and GABAergic lineage (Ptfa1 and Neurog1) after 20 h in the presence or absence of clodronate. Values represent the mean ± SEM (n = 3 independent experiments); p < 0.05, ∗∗∗p < 0.001, ANOVA with Tukey's multiple comparison test. (E) Cells undergoing neurogenic progression in the presence or absence of clodronate from a representative field of a live imaging experiment. Phase contrast images of time-lapse video microscopy showing the lineages obtained at different time points (day-h:min). Arrowheads indicate cells within the clone. Scale bar, 30 μm. (F) The lineage trees traced in Control conditions in (E). (G) The lineage trees traced in the presence of clodronate in (E). (H) Cells surviving at the end of the experiment. (I) Cells surviving within the lineage trees. (J) Overall cell-cycle length of tracked cells. (K) Cell-cycle length as a function of the round. (L) Migratory behavior of the cells (H–L) for all conditions in the presence or absence of clodronate, respectively. Values represent the mean ± SEM (n = 5 independent experiments), t test for (H, I, J, and L) and ANOVA followed by Tukeys post-test for (K).

References

    1. Ahlfeld J., Filser S., Schmidt F., Wefers A.K., Merk D.J., Glass R., Herms J., Schuller U. Neurogenesis from Sox2 expressing cells in the adult cerebellar cortex. Sci. Rep. 2017;7:6137. - PMC - PubMed
    1. Alcock J., Scotting P., Sottile V. Bergmann glia as putative stem cells of the mature cerebellum. Med. Hypotheses. 2007;69:341–345. - PubMed
    1. Alcock J., Sottile V. Dynamic distribution and stem cell characteristics of Sox1-expressing cells in the cerebellar cortex. Cell Res. 2009;19:1324–1333. - PubMed
    1. Alvarez Otero R., Sotelo C., Alvarado-Mallart R.M. Chick/quail chimeras with partial cerebellar grafts: an analysis of the origin and migration of cerebellar cells. J. Comp. Neurol. 1993;333:597–615. - PubMed
    1. Berg D.A., Belnoue L., Song H., Simon A. Neurotransmitter-mediated control of neurogenesis in the adult vertebrate brain. Development. 2013;140:2548–2561. - PMC - PubMed

Publication types

Substances

LinkOut - more resources