. 2020 Oct 13;21(20):7528.
doi: 10.3390/ijms21207528.

Activation of the VEGF-A/ERK/PLA2 Axis Mediates Early Retinal Endothelial Cell Damage Induced by High Glucose: New Insight from an In Vitro Model of Diabetic Retinopathy

Affiliations

Activation of the VEGF-A/ERK/PLA2 Axis Mediates Early Retinal Endothelial Cell Damage Induced by High Glucose: New Insight from an In Vitro Model of Diabetic Retinopathy

Giovanni Giurdanella et al. Int J Mol Sci. .

Abstract

Early blood retinal barrier (BRB) dysfunction induced by hyperglycemia was related to increased pro-inflammatory activity of phospholipase A2 (PLA2) and the upregulation of vascular endothelial growth factor A (VEGF-A). Here, we tested the role of VEGF-A in high glucose (HG)-induced damage of human retinal endothelial cells (HRECs) mediated by Ca++-dependent (cPLA2) and Ca++-independent (iPLA2) PLA2s. HRECs were treated with normal glucose (5 mM, NG) or high glucose (25 mM, HG) for 48 h with or without the VEGF-trap Aflibercept (Afl, 40 µg/mL), the cPLA2 inhibitor arachidonoyl trifluoromethyl ketone (AACOCF3; 15 µM), the iPLA2 inhibitor bromoenol lactone (BEL; 5 µM), or VEGF-A (80 ng/mL). Both Afl and AACOCF3 prevented HG-induced damage (MTT and LDH release), impairment of angiogenic potential (tube-formation), and expression of VEGF-A mRNA. Furthermore, Afl counteracted HG-induced increase of phospho-ERK and phospho-cPLA2 (immunoblot). VEGF-A in HG-medium increased glucose toxicity, through upregulation of phospho-ERK, phospho-cPLA2, and iPLA2 (about 55%, 45%, and 50%, respectively); immunocytochemistry confirmed the activation of these proteins. cPLA2 knockdown by siRNA entirely prevented cell damage induced by HG or by HG plus VEGF-A, while iPLA2 knockdown produced a milder protective effect. These data indicate that VEGF-A mediates the early glucose-induced damage in retinal endothelium through the involvement of ERK1/2/PLA2 axis activation.

Keywords: Aflibercept; VEGF-A; high glucose; phospholipase A2; retinal endothelium.


Conflict of interest statement

The authors declare no conflict of interest.

Figures

Figure 1
Figure 1
Aflibercept and the cPLA2 inhibitor AACOCF3 reduced cell damage in human retinal endothelial cells (HRECs) treated with high glucose (HG). HRECs were treated for 48 h with normal glucose (NG, 5 mM), high mannitol (HM, 25 mM) or high glucose (HG, 25 mM), alone or supplemented with increasing amounts of Aflibercept (Afl, 1, 5, and 40 µg/mL), the cPLA2 inhibitor AACOCF3 (Aac, 0.5, 3, and 15 µM) or the iPLA2 inhibitor (Bel, 0.5, 1, and 5 µM). After the treatments, cells were assessed for viability (MTT assay, panels AC). Cells treated with maximal drug concentrations were also assessed in a cytotoxicity test (LDH release, panel D). Values are expressed as a mean ± SEM of three independent experiments, each run in triplicate. * p < 0.05 vs. CTRL; † p < 0.05 vs. HG alone. One-way ANOVA, followed by Tukey’s test.
Figure 2
Figure 2
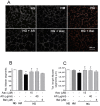
Aflibercept and cPLA2 inhibitor AACOCF3 increased the tube-like structures assessed by tube formation assays in human retinal endothelial cells (HRECs) treated with high glucose (HG). HRECs were seeded into the 96-well plate coated with Matrigel at a density of 1.5 × 10⁴/well in presence of normal glucose (NG, 5 mM), or high mannitol (HM, 25 mM) or high glucose (HG, 25 mM) alone or supplemented with Aflibercept (Afl, 40 µg/mL), of cPLA2 inhibitor (Aac, 15 µM) or iPLA2 inhibitor (Bel, 5 µM). After 4 h, tube-like structures were photographed and the images were analyzed with Image J software. Panel (A) shows representative photographs of tube-like structures. Quantitative analysis of total number and length of tube-like structures are shown in panels (B) and (C), respectively. Values are expressed as a mean ± SEM of three independent experiments, each run in triplicate. * p < 0.05 vs. CTRL; † p < 0.05 vs. HG alone. One-way ANOVA, followed by Tukey’s test.
Figure 3
Figure 3
Aflibercept reduced phospho-cPLA2, phospho-ERK 1/2 and VEGF-A levels in human retinal endothelial cells (HRECs) treated with high glucose (HG). Cells were treated for 48 h with normal glucose (NG, 5 mM), high glucose (HG, 25 mM) alone or supplemented with Aflibercept (Afl, 40 µg/mL) or the cPLA2 inhibitor (Aac 15 µM). Panel (A) immunoblot analysis of whole-cell lysates from treated HRECs using antibodies against phospho ERK 1/2, total ERK1/2, phospho-cPLA2, total cPLA2 and iPLA2. The blot was probed with anti β-actin antibody for verify equal loading of 30 µg protein per lane. Panel (B) Densitometry analysis of immunoblot indicating protein quantification of each band (in arbitrary densitometry unit, a.d.u.), carried out with the Image J program. Bar graphs represent the means ± SEM from three independent experiments. Panel (C) RT-qPCR analysis of VEGF-A mRNA extracted from treated HRECs. Each bar represents the means ± SEM from three independent experiments. * p < 0.05 vs. Control (NG); † p < 0.05 vs. HG. One-way ANOVA, followed by Tukey’s test.
Figure 4
Figure 4
Exogenous VEGF-A increase damage in human retinal endothelial cells (HRECs) treated with high glucose (HG). Cells were treated for 48 h with normal glucose (NG, 5 mM), with or without VEGF-A (40 or 80 ng/mL) or with high glucose (HG, 25 mM) with or without VEGF-A (40 or 80 ng/mL). After the treatments, cells were subjected to cell viability tests (MTT assays, panel A) and to cytotoxicity tests (LDH release, panel B). HRECs were seeded into the 96-well plate coated with Matrigel at a density of 1.5 × 10⁴/well in presence of treatment media. After 16 h, tube-like structures were photographed and the images were analyzed with Image J software. Panel (C) shows representative photographs of tube-like structures. Quantitative analysis of total number and length of tube-like structures are shown in panels (D) and (E), respectively. Bar graphs represent the means ± SEM from three independent experiments. * p < 0.05 vs. Control (NG); † p <0.05 vs. HG. One-way ANOVA, followed by Tukey’s test.
Figure 5
Figure 5
Exogenous VEGF-A exacerbated high glucose (HG)-induced activation of ERK/PLA2 axis in human retinal endothelial cells (HRECs). Panel (A): immunoblot analysis of HREC whole-cell lysates, using antibodies against phospho-ERK1/2 (p-ERK1/2), total ERK1/2, phospho-cPLA2 (p-cPLA2), total cPLA2 and iPLA2. The blot was probed with anti β-actin antibody to verify equal loading of 30 µg proteins per lane. Panel (B): densitometric analysis of immunoblot indicating protein quantification of each band (in arbitrary densitometry unit, a.d.u.), carried out with the Image J program. Panel (C): immunocytochemical staining for p-ERK 1/2 (green fluorescence) and ERK 1/2 (red fluorescence) in HRECs grown in normal glucose (NG, 5 mM; a, b, c, d), in normal glucose plus 80 ng/mL of VEGF-A (a’, b’, c’, d’), in high glucose (HG, 25 mM; a’’, b’’, c’’, d’’) or in high glucose supplemented with 80 ng/mL of VEGF-A (HG + VEGF-A; a’’’, b’’’, c’’’, d’’’). Blue fluorescence indicates DAPI staining of cell nuclei. Merged pictures are shown in the fourth column (d, d’, d’’, and d’’’). In control HRECs, green fluorescence was almost undetectable, either in the cytoplasm or in the nucleus. HG-culture conditions induced an increase in green fluorescence (indicating p-ERK1/2 activation), particularly in the nuclear region (b’’’ vs. b’ and b’’ vs. b, respectively). Panel (D): immunocytochemical staining for p-cPLA2 (green fluorescence) and cPLA2 (red fluorescence) in HRECs grown in normal glucose (NG, 5 mM; a, b, c, d), in normal glucose plus 80 ng/mL of VEGF-A (a’, b’, c’, d’), in high glucose (HG, 25 mM; a’’, b’’, c’’, d’’) or in HG supplemented with 80 ng/mL of VEGF-A (HG + VEGF-A; a’’’, b’’’, c’’’, d’’’). Blue fluorescence indicates DAPI staining of cell nuclei. Merged pictures are shown in the fourth column (d, d’, d’’, and d’’’). In control HRECs, green fluorescence is detectable only at nuclear level; an increase (indicating cPLA2 activation) can be observed in both cytoplasm and nuclei in HG-culture conditions, (b’’’ vs. b’ and b’’ vs. b, respectively). Panel (E): immunocytochemical staining for iPLA2 (green fluorescence) and β-actin (red fluorescence) in HRECs grown in normal glucose (NG, 5 mM; a, b, c, d), in normal glucose plus 80 ng/mL of VEGF-A (a’, b’, c’, d’), in high glucose (HG, 25 mM; a’’, b’’, c’’, d’’) or in high glucose supplemented with 80 ng/mL of VEGF-A (HG + VEGF-A; a’’’, b’’’, c’’’, d’’’). Blue fluorescence indicates DAPI staining of cell nuclei. Merged pictures are shown in the fourth column (d, d’, d’’, and d’’’). Immunostaining for iPLA2 is increased in HRECs cultured in high glucose supplemented with 80 ng/mL of VEGF-A (b’’’ vs. b’’, b’, and b). Magnification: ×40; scale bars: 100 µm.
Figure 6
Figure 6
Effect of PLA2 silencing on detrimental effects of high glucose (HG) in human retinal endothelial cells (HRECs). Cell lysates of HRECs transfected with siRNA against cPLA2 (cPLA2 K.d.), iPLA2 (iPLA2 K.d.), and scrambled siRNA (Scramb) were analyzed by Western blot 48 h after transfection using antibodies against total cPLA2 and iPLA2 to evaluate efficiency of knockdown. Western blot analysis of lysates from two randomly selected independent transfections are shown in panel (A). Immunoblotting of β-actin was used to assess equal loading (30 µg of protein per lane). Transfected HRECs were incubated with normal glucose (5 mM, NG), high glucose (25 mM HG), or HG plus VEGF-A (80 ng/mL) for 48 h and analyzed in MTT assay (panel B) or LDH release assay (panel C). Transfected cells were also seeded into 96-well plate coated with matrigel at a density of 1.5 × 10⁴ and incubated as described above. After 16 h, tube like-structures were photographed (panel D) and images were analyzed for total number (panel E) and length (panel F) of tube-like structures with Image J software. Values are expressed as a mean ± SEM of three independent experiments, each run in triplicate. * p < 0.05 vs. scrambled NG; † p < 0.05 vs. scramb HG or scramb HG plus VEGF-A. One-way ANOVA, followed by Tukey’s test.

Similar articles

Cited by

References

    1. Ma¨kimattila S., Virkama¨ki A., Groop P.-H., Cockcroft J., Utriainen T., Fagerudd J., Yki-Ja¨rvinen H. Chronic Hyperglycemia Impairs Endothelial Function and Insulin Sensitivity Via Different Mechanisms in Insulin-Dependent Diabetes Mellitus. Circulation. 1996;94:1276–1282. doi: 10.1161/01.CIR.94.6.1276. - DOI - PubMed
    1. Chou J., Rollins S., Fawzi A.A. Single Molecule and Single Cell Sequencing. Volume 801. Springer Science and Business Media LLC; Berlin/Heidelberg, Germany: 2014. Role of endothelial cell and pericyte dysfunction in diabetic retinopathy: Review of techniques in rodent models; pp. 669–675. - PMC - PubMed
    1. Wang W., Lo A.C.Y. Diabetic Retinopathy: Pathophysiology and Treatments. Int. J. Mol. Sci. 2018;19:1816. doi: 10.3390/ijms19061816. - DOI - PMC - PubMed
    1. Brownlee M. The Pathobiology of Diabetic Complications: A Unifying Mechanism. Diabetes. 2005;54:1615–1625. doi: 10.2337/diabetes.54.6.1615. - DOI - PubMed
    1. Kowluru R.A., Chan P.-S. Oxidative Stress and Diabetic Retinopathy. Exp. Diabetes Res. 2007;2007:1–12. doi: 10.1155/2007/43603. - DOI - PMC - PubMed

MeSH terms