. 2020 Oct 14;21(20):7578.
doi: 10.3390/ijms21207578.

Profiling of Tryptophan Metabolic Pathways in the Rat Fetoplacental Unit During Gestation

Affiliations

Profiling of Tryptophan Metabolic Pathways in the Rat Fetoplacental Unit During Gestation

Cilia Abad et al. Int J Mol Sci. .

Abstract

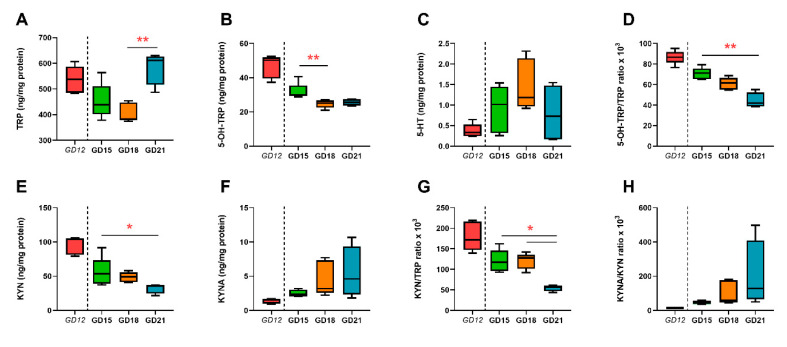
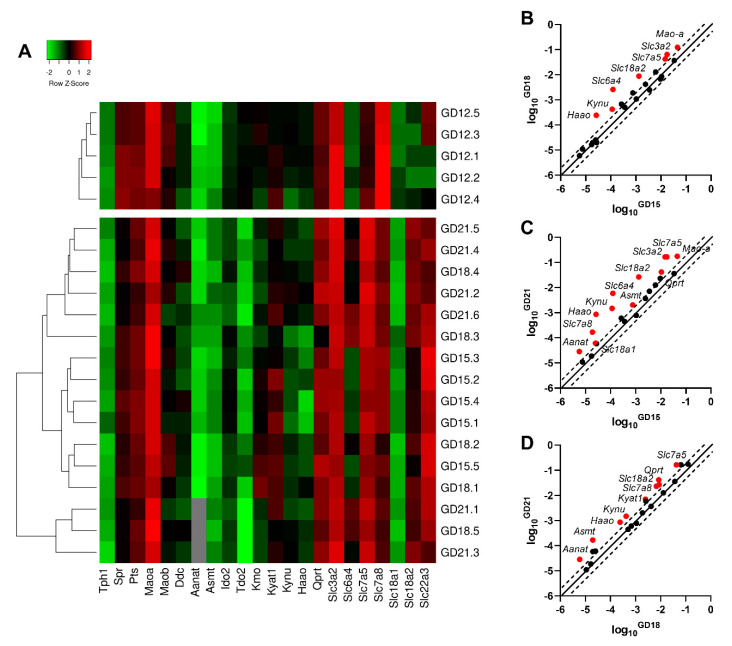
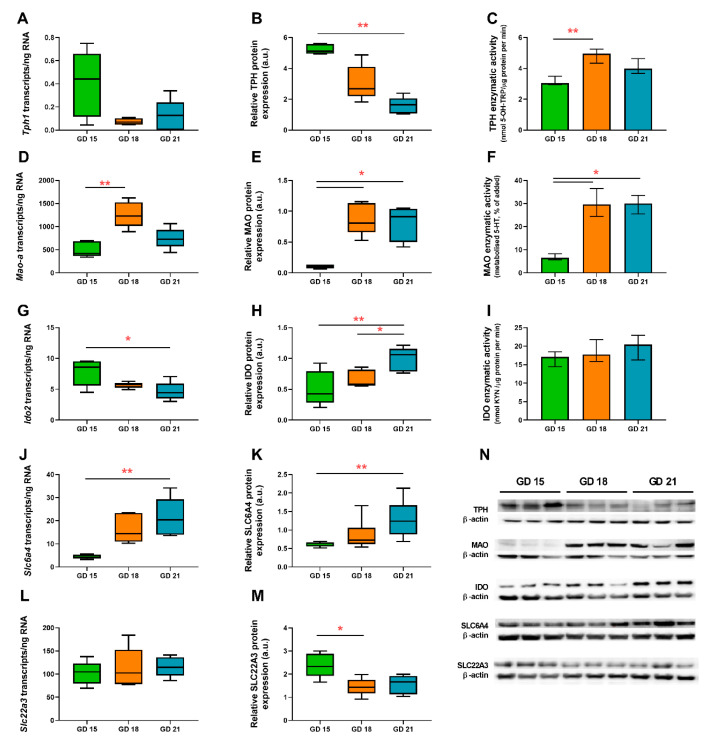
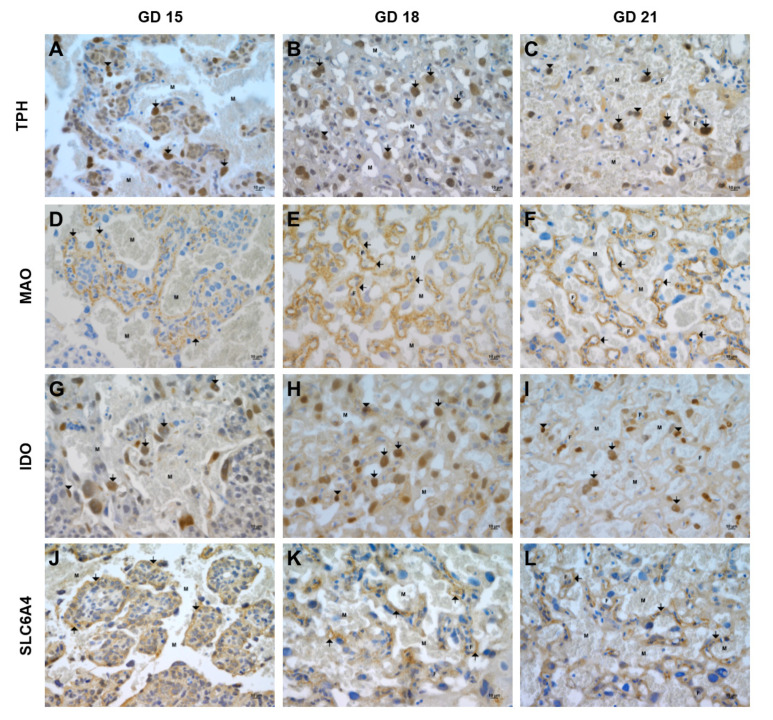
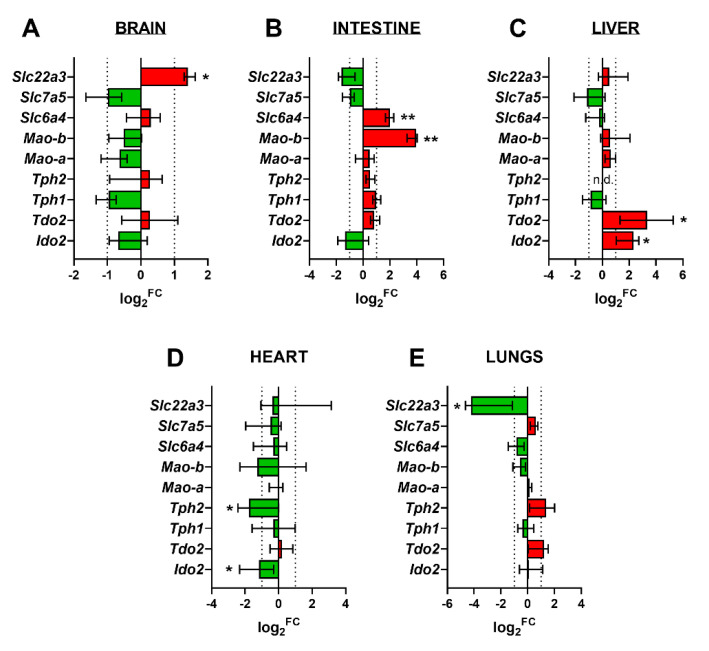
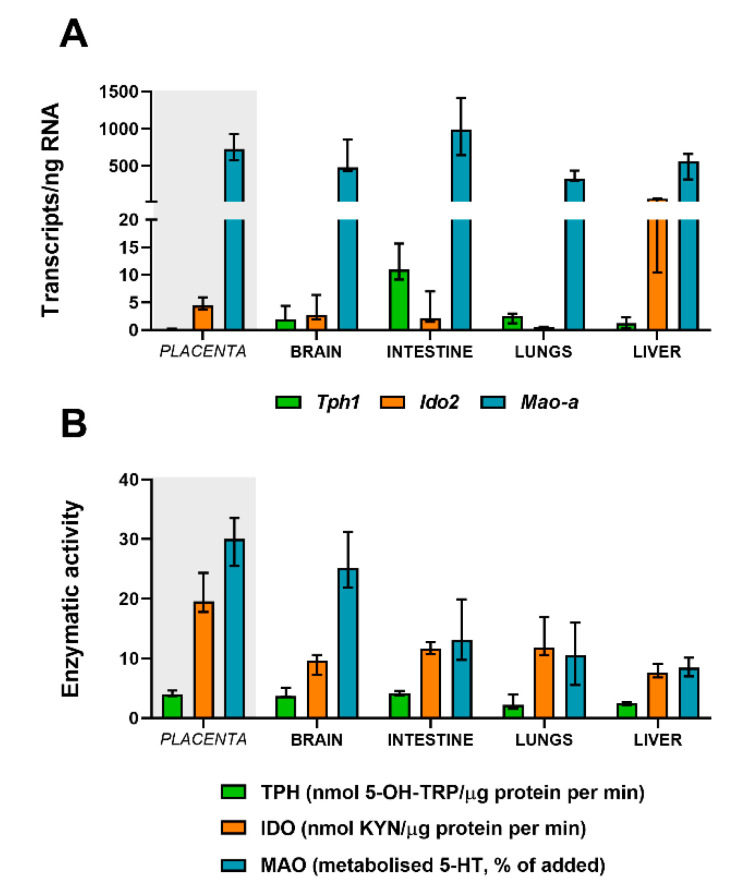
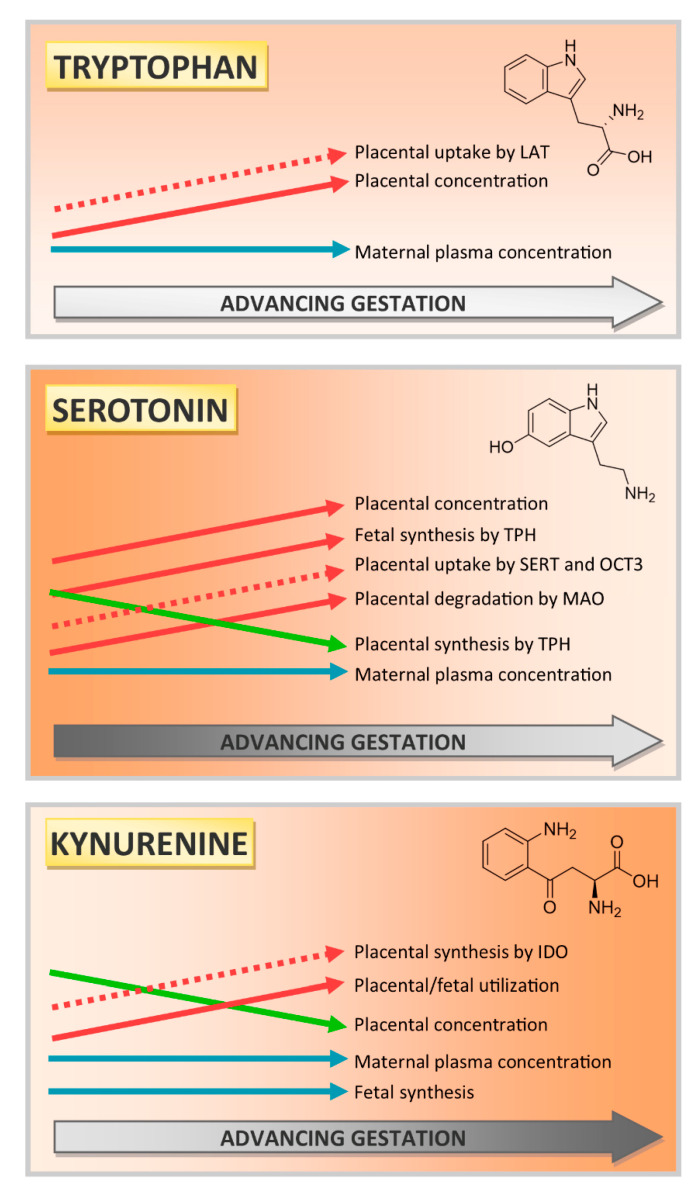
Placental homeostasis of tryptophan is essential for fetal development and programming. The two main metabolic pathways (serotonin and kynurenine) produce bioactive metabolites with immunosuppressive, neurotoxic, or neuroprotective properties and their concentrations in the fetoplacental unit must be tightly regulated throughout gestation. Here, we investigated the expression/function of key enzymes/transporters involved in tryptophan pathways during mid-to-late gestation in rat placenta and fetal organs. Quantitative PCR and heatmap analysis revealed the differential expression of several genes involved in serotonin and kynurenine pathways. To identify the flux of substrates through these pathways, Droplet Digital PCR, western blot, and functional analyses were carried out for the rate-limiting enzymes and transporters. Our findings show that placental tryptophan metabolism to serotonin is crucial in mid-gestation, with a subsequent switch to fetal serotonin synthesis. Concurrently, at term, the close interplay between transporters and metabolizing enzymes of both placenta and fetal organs orchestrates serotonin homeostasis and prevents hyper/hypo-serotonemia. On the other hand, the placental production of kynurenine increases during pregnancy, with a low contribution of fetal organs throughout gestation. Any external insult to this tightly regulated harmony of transporters and enzymes within the fetoplacental unit may affect optimal in utero conditions and have a negative impact on fetal programming.

Keywords: fetal organs; fetal programming; placenta–brain axis; pregnancy; rat model; tryptophan metabolism.


Conflict of interest statement

The authors declare no conflict of interest. The funders had no role in the design of the study; in the collection, analyses, or interpretation of data; in the writing of the manuscript; or in the decision to publish the results.

Figures

Figure 1
Figure 1
Basal tryptophan (TRP) metabolite levels in the rat placenta during gestation. Concentration of TRP (A) and its main metabolites—5-hydroxy-l-tryptophan (5-OH-TRP) (B), serotonin (5-HT) (C), kynurenine (KYN) (E), and kynurenic acid (KYNA) (F)—was evaluated on various gestation days (GD); ratios of metabolite to precursor are also shown (D,G,H). It is important to note that at GD 12, the rat placenta is technically indistinguishable from the embryo. Therefore, we present GD 12 results separately as concepti and no statistical comparison with placentas of later GDs was performed. The results are reported as Tukey boxplots (1.5-times IQR) of metabolite concentrations normalized to the placental protein content; n = 5 for each gestational day. Statistical significance was evaluated using the non-parametric Kruskal–Wallis test, followed by Dunn’s multiple comparisons test; * (p ≤ 0.05) and ** (p ≤ 0.01).
Figure 2
Figure 2
Gene expression of the main enzymes and transporters involved in TRP metabolic pathways in the rat placenta at different stages of gestation. (A) Heatmap representing qPCR gene expression analysis in rat concepti (GD 12) and the rat placenta (GD 15, 18, and 21). Average linkage clustering with Euclidean distance measurement reveals changes in gene expression that reflect the different stages of placental development. The color intensity indicates expression levels: red = upregulation; green = downregulation; and gray = not detected. (BD) Identification of enzymes/transporters with significant changes in placental gene expression during gestation. Whilst the pattern of the increase in gene expression is similar for different stages of gestation, the highest difference is observed between GD 15 and 21. Data are presented as scatter plots with log10 gene expression at GD 18 compared to GD 15 (B), GD 21 compared to GD 15 (C), and GD 21 compared to GD 18 (D). The central diagonal line shows unchanged gene expression, and the dotted lines depict the threshold fold regulation (=2). Data were further evaluated using the non-parametric Mann–Whitney test on ΔCt values, and those which exceeded the threshold fold change (FC) and were statistically significant are highlighted in red and labeled.
Figure 3
Figure 3
Expression and functional analysis of the rate-limiting enzymes: Tph1/tryptophan hydroxylase (TPH) (AC), Mao-a/monoamine oxidase (MAO) (DF), Ido2/indoleamine 2,3-dioxygenase (IDO) (GI), and key transporters—Slc6a4/SLC6A4 (J,K) and Slc22a3/SLC22A3 (L,M)—of the TRP metabolic pathway in the rat placenta during gestation. Absolute quantification of the number of transcripts was evaluated by digital droplet PCR (A,D,G,J,L), whereas protein expression was evaluated by western blot analysis (B,E,H,K,M). Protein expression was normalized to β-actin as a loading control; representative immunoblots for target proteins and β-actin are shown (N). Enzymatic activity of TPH (C), MAO (F), and IDO (I) was evaluated as described in the Section 4. Data are presented as Tukey boxplots (1.5-times IQR) or the median with IQR; n = 5 for each gestational age. Statistical significance was evaluated using the non-parametric Kruskal–Wallis test, followed by Dunn’s multiple comparisons test; * (p ≤ 0.05) and ** (p ≤ 0.01).
Figure 4
Figure 4
Immunohistochemical staining of TPH, MAO, IDO, and SLC6A4 in the rat placenta during gestation. TPH expression was detected in the labyrinth zone in cytotrophoblast cells (arrows) and fetal capillaries (arrowheads) at GD 15 (A), 18 (B), and 21 (C). MAO expression was only detected in the area of the labyrinth zone in cytotrophoblast/syncytiotrophoblast cells (arrows) at GD 15 (D) and 18 (E) and predominantly in the inner layers of the syncytiotrophoblast (layer II and III) at GD 21 (F). The most significant reactivity for IDO was visible in the labyrinth zone in cytotrophoblast cells (arrows) and fetal endothelial cells (arrowheads) at GD 15 (G), 18 (H), and 21 (I). Weak SLC6A4 expression was detected in cytotrophoblast/syncytiotrophoblast cells (arrows) in the placental labyrinth at GD 15 (J) and 18 (K), whereas at GD 21 (L), positivity was visible in the inner layers of the syncytiotrophoblast (layer II and III). M, maternal compartment, and F, fetal compartment. Bar: 10 μm.
Figure 5
Figure 5
Gene expression of the main enzymes/transporters of the 5-HT and KYN pathways in rat fetal organs. Log2 fold change (FC) of gene expression at GD 21 compared to GD 18 is shown for the fetal brain (A), intestine (B), liver (C), heart (D), and lungs (E). Red color indicates upregulation, whereas green color indicates downregulation. Data are presented as the median with IQR; n = 5 for each gestational age. Statistical analysis of gestational age changes in the mRNA expression of target genes was evaluated using the non-parametric Mann–Whitney test; * (p ≤ 0.05) and ** (p ≤ 0.01). N.D., not detected.
Figure 6
Figure 6
Gene expression and activity of Tph1/TPH, Ido2/IDO, and Mao-a/MAO in fetal organs. (A) Gene expression evaluated by digital droplet PCR analysis of the rate-limiting enzymes for the 5-HT pathway (Tph1 and Mao-a) and KYN pathway (Ido2) at GD 21. (B) Functional analysis of TPH, IDO, and MAO enzymatic activity in fetal organs at term. Data are presented as the median with IQR; n = 5 for each gestational age.
Figure 7
Figure 7
Schematic depiction of the TRP metabolic pathways in the rat fetoplacental unit during gestation. Although basal levels of TRP, 5-HT, and KYN in maternal plasma remain stable during gestation, their concentrations change significantly in the placenta and fetal organs. Based on our results and literature research [19,32,33,34,35,36,37] we show that the placental metabolism of TRP to 5-HT is important up to mid-gestation, with a subsequent decline (as the fetus becomes independent of placental sources of 5-HT). On the other hand, the placental production and utilization of KYN increase during pregnancy. Full arrows show metabolic activity or concentration levels, and dotted arrows show the gene or protein expression.

References

    1. Sedlmayr P., Blaschitz A., Stocker R. The Role of Placental Tryptophan Catabolism. Front. Immunol. 2014;5:230. doi: 10.3389/fimmu.2014.00230. - DOI - PMC - PubMed
    1. Yudilevich D.L., Sweiry J.H. Transport of amino acids in the placenta. Biochim. Biophys. Acta (BBA)—Rev. Biomembr. 1985;822:169–201. doi: 10.1016/0304-4157(85)90007-3. - DOI - PubMed
    1. Badawy A.A.-B. Tryptophan metabolism, disposition and utilization in pregnancy. Biosci. Rep. 2015;35:e00261. doi: 10.1042/BSR20150197. - DOI - PMC - PubMed
    1. Teshigawara T., Mouri A., Kubo H., Nakamura Y., Shiino T., Okada T., Morikawa M., Nabeshima T., Ozaki N., Yamamoto Y., et al. Changes in tryptophan metabolism during pregnancy and postpartum periods: Potential involvement in postpartum depressive symptoms. J. Affect. Disord. 2019;255:168–176. doi: 10.1016/j.jad.2019.05.028. - DOI - PubMed
    1. Zardoya-Laguardia P., Blaschitz A., Hirschmugl B., Lang I., A Herzog S., Nikitina L., Gauster M., Hausler M., Cervar-Zivkovic M., Karpf E., et al. Endothelial indoleamine 2,3-dioxygenase-1 regulates the placental vascular tone and is deficient in intrauterine growth restriction and pre-eclampsia. Sci. Rep. 2018;8:5488. doi: 10.1038/s41598-018-23896-0. - DOI - PMC - PubMed

LinkOut - more resources