. 2020 Oct 16;6(42):eabc5586.
doi: 10.1126/sciadv.abc5586. Print 2020 Oct.

The healthy exocrine pancreas contains preproinsulin-specific CD8 T cells that attack islets in type 1 diabetes

Affiliations

The healthy exocrine pancreas contains preproinsulin-specific CD8 T cells that attack islets in type 1 diabetes

Christine Bender et al. Sci Adv. .

Abstract

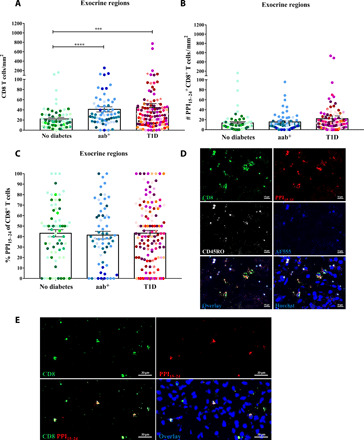
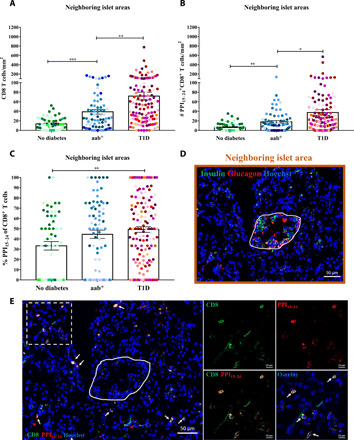
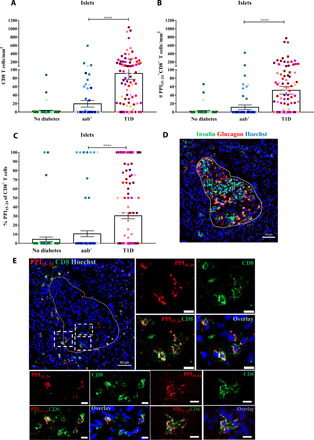
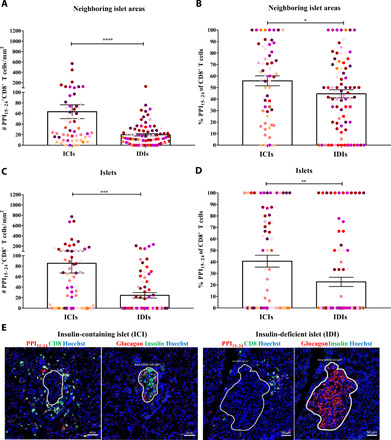
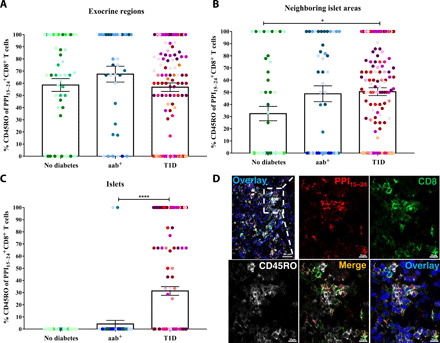
Preproinsulin (PPI) is presumably a crucial islet autoantigen found in patients with type 1 diabetes (T1D) but is also recognized by CD8+ T cells from healthy individuals. We quantified PPI-specific CD8+ T cells within different areas of the human pancreas from nondiabetic controls, autoantibody-positive donors, and donors with T1D to investigate their role in diabetes development. This spatial cellular quantitation revealed unusually high frequencies of autoreactive CD8+ T cells supporting the hypothesis that PPI is indeed a key autoantigen. To our surprise, PPI-specific CD8+ T cells were already abundantly present in the nondiabetic pancreas, thus questioning the dogma that T1D is caused by defective thymic deletion or systemic immune dysregulation. During T1D development, these cells accumulated in and around islets, indicating that an islet-specific trigger such as up-regulation of major histocompatibility complex class I might be essential to unmask beta cells to the immune system.


Figures

Fig. 1
Fig. 1. Many PPI15–24-specific CD8+ T cells reside in the human exocrine pancreas.
Exocrine regions (no diabetes, n = 69; aab+, n = 63; and T1D, n = 129) were randomly selected from pancreas tissue sections of all 22 donors. (A) A higher density of CD8+ T cells was found in donors with aab+ (P < 0.0001) and T1D (P = 0.0006) compared with donors without diabetes. (B) A strong tendency to higher numbers of PPI15–24+CD8+ T cells in donors with T1D compared to donors without diabetes was observed (P = 0.0564). (C) Frequencies of PPI15–24+CD8+ T cells among detected CD8 T cells are similar between all donor groups. Every dot represents an exocrine region. Bars represent the mean ± SEM values in different groups. Every color represents a donor. For statistical analysis, nonparametric Kruskal-Wallis test followed by Dunn multiple comparison test was used to determine significance: ***P < 0.001 and ****P < 0.0001. (D and E) PPI15–24-specific CD8+ T cells are present in the pancreas of healthy, aab donors. Representative immunofluorescence images of exocrine regions from nondiabetic donors stained with PPI15-24APC (allophycocyanin) tetramer, CD8-AF (Alexa Fluor) 488, and CD45RO-AF594 (pseudo-color white). PPI15–24-specific CD8+ T cells were counted manually, and the density was calculated per square millimeter. Images were taken with the AxioScan.Z1 slide scanner (Zeiss, ×20 magnification). (D) Donor #6271. To differentiate between staining and background signal or autofluorescence, an additional channel (AF555, pseudo-color blue) was added during image acquisition. (E) Donor #6232.
Fig. 2
Fig. 2. PPI15–24-specific CD8+ T cells are attracted to the proximity of and into the islets.
Neighboring islet areas (n = 267) were randomly selected from pancreas tissue sections of all 22 donors (no diabetes, n = 57; aab+, n = 73; and T1D, n = 137). (A) A higher density of CD8+ T cells close to the islets in aab donors compared with donors without diabetes (P = 0.0004). (B) The number of PPI15–24+CD8+ T cells is increased in donors with abb+ (P = 0.089) and T1D (P < 0.0001) compared with donors without diabetes. (C) Higher frequency of PPI15–24-specific CD8+ T cells in neighboring islet areas in donors with T1D compared with donors without diabetes (P = 0.0061). Every dot represents a neighboring islet area. Bars represent the mean ± SEM values in different groups. Every color represents a donor. PPI15–24-specific CD8+ T cells were counted manually, and the density was calculated per square millimeter. For statistical analysis, nonparametric Kruskal-Wallis test followed by Dunn multiple comparison test was used to determine significance: *P = 0.05, **P < 0.05, and ***P < 0.001. (D) Restaining of a pancreas tissue section from a donor with aab+ (#6154) for insulin and glucagon (see Supplementary Methods for more details). The image shows an insulin-containing islet. The neighboring islet area is demonstrated in brown. (E) PPI15–24-specific CD8+ T cells were found close to islets already in donors with aab+. White arrows indicate PPI15–24-specific CD8+ T cells.
Fig. 3
Fig. 3. PPI15–24-specific CD8+ T cells are found within the islets of donors with T1D.
Islets were randomly selected from pancreas sections of donors without diabetes (n = 63), aab+ (n = 83), and T1D (n = 156). (A) A higher density of CD8+ T cells in donors with T1D (P < 0.0001) compared with donors with aab+. (B) High numbers of PPI15–24-specific CD8+ T cells in donors with T1D (P < 0.0001). (C) The percentage of PPI15–24-specific CD8+ T cells in the islets is higher in donors with T1D. Every dot represents an islet (n = 302). Bars represent the mean ± SEM values. For statistical analysis, nonparametric Kruskal-Wallis test followed by Dunn multiple comparison test was used to determine significance: ****P < 0.0001. (D and E) Representative immunofluorescence images of a pancreas section from a donor with T1D (#6052, 1 year of disease duration). (D) Restaining for insulin and glucagon (see Supplementary Methods for more details). The image shows an insulin-containing islet. (E) In situ PPI15–24 staining (red) combined with CD8 (green) and nuclear marker (blue, Hoechst). PPI15–24-specific CD8+ T cells are shown in yellow. Magnification ×20. Scale bars, 10 μm for cropped images.
Fig. 4
Fig. 4. PPI15–24-specific CD8+ T cells infiltration or retention in the islets depends on the presence of insulin.
Insulin-containing islets (ICIs; n = 69) and insulin-deficient islets (IDIs; n = 87) from donors with T1D (n = 11) were analyzed for the presence of PPI15–24-specific CD8+ T cells. (A) A higher density (P < 0.0001) and (B) frequency (P = 0.045) of PPI15–24+CD8+ T cells was detected in close proximity to ICIs (n = 56) compared to IDIs (n = 81). The number (P = 0.0002) and percentage (P = 0.003) of PPI15–24+CD8+ T cells are increased in ICIs compared to IDIs. (A and B) Every dot represents a neighboring islet area (n = 267) or (C and D) an islet (n = 302). Bars represent the mean ± SEM numbers (A and C) and frequencies (B and D) of PPI15–24+CD8+ T cells per square millimeter. Every color represents a donor. For statistical analysis, the Mann-Whitney test was used to determine significance: *P = 0.05, **P < 0.05, ***P < 0.001, and ****P < 0.0001. (E) Representative immunofluorescence images of an ICI and IDI from a donor (#6052) with T1D (1 year of disease duration). PPI15–24-specific CD8+ T cells are shown in yellow.
Fig. 5
Fig. 5. Most PPI15–24-specific CD8+ T cells are memory cells.
The percentages of CD45RO+ cells of PPI15–24-specific CD8+ T cells are shown for (A) exocrine regions (no diabetes, n = 59; aab+, n = 36; T1D, n = 123), (B) neighboring islet areas (no diabetes, n = 48; aab+, n = 44; T1D, n = 126), and (C) islets (no diabetes, n = 53; aab+, n = 48; T1D, n = 143). Bars represent the mean ± SEM percentages of PPI15–24-specific CD8+ CD45RO+ T cells per square millimeter for each group. Every dot represents a region or an islet. Every color represents a donor. For statistical analysis, nonparametric Kruskal-Wallis test followed by Dunn multiple comparison test was used to determine significance: *P = 0.05 and ****P < 0.0001. (D) Immunofluorescence images of PPI15–24-specific CD8+ T cells, including the CD45RO memory marker of a pancreas section from a donor with T1D (#6052, 1 year of disease duration). The image demonstrates an islet (complementary to Fig. 4E). Scale bar, 10 μm for images with higher magnification.

References

    1. Atkinson M. A., Eisenbarth G. S., Michels A. W., Type 1 diabetes. Lancet 383, 69–82 (2014). - PMC - PubMed
    1. Katsarou A., Gudbjörnsdottir S., Rawshani A., Dabelea D., Bonifacio E., Anderson B. J., Jacobsen L. M., Schatz D. A., Lernmark Å., Type 1 diabetes mellitus. Nat. Rev. Dis. Primers. 3, 17016 (2017). - PubMed
    1. Pugliese A., Autoreactive T cells in type 1 diabetes. J. Clin. Invest. 127, 2881–2891 (2017). - PMC - PubMed
    1. In't Veld P., Insulitis in human type 1 diabetes: A comparison between patients and animal models. Semin. Immunopathol. 36, 569–579 (2014). - PMC - PubMed
    1. Babon J. A. B., De Nicola M. E., Blodgett D. M., Crèvecoeur I., Buttrick T. S., Maehr R., Bottino R., Naji A., Kaddis J., Elyaman W., James E. A., Haliyur R., Brissova M., Overbergh L., Mathieu C., Delong T., Haskins K., Pugliese A., Campbell-Thompson M., Mathews C., Atkinson M. A., Powers A. C., Harlan D. M., Kent S. C., Analysis of self-antigen specificity of islet-infiltrating T cells from human donors with type 1 diabetes. Nat. Med. 22, 1482–1487 (2016). - PMC - PubMed

Publication types