. 2021 Jan 15;81(2):315-331.
doi: 10.1158/0008-5472.CAN-20-1871. Epub 2020 Oct 16.

RNA-Binding RING E3-Ligase DZIP3/hRUL138 Stabilizes Cyclin D1 to Drive Cell-Cycle and Cancer Progression

Affiliations

RNA-Binding RING E3-Ligase DZIP3/hRUL138 Stabilizes Cyclin D1 to Drive Cell-Cycle and Cancer Progression

Srinivasa P Kolapalli et al. Cancer Res. .

Abstract

DZIP3/hRUL138 is a poorly characterized RNA-binding RING E3-ubiquitin ligase with functions in embryonic development. Here we demonstrate that DZIP3 is a crucial driver of cancer cell growth, migration, and invasion. In mice and zebrafish cancer models, DZIP3 promoted tumor growth and metastasis. In line with these results, DZIP3 was frequently overexpressed in several cancer types. Depletion of DZIP3 from cells resulted in reduced expression of Cyclin D1 and a subsequent G1 arrest and defect in cell growth. Mechanistically, DZIP3 utilized its two different domains to interact and stabilize Cyclin D1 both at mRNA and protein levels. Using an RNA-binding lysine-rich region, DZIP3 interacted with the AU-rich region in 3' untranslated region of Cyclin D1 mRNA and stabilized it. Using a RING E3-ligase domain, DZIP3 interacted and increased K63-linked ubiquitination of Cyclin D1 protein to stabilize it. Remarkably, DZIP3 interacted with, ubiquitinated, and stabilized Cyclin D1 predominantly in the G1 phase of the cell cycle, where it is needed for cell-cycle progression. In agreement with this, a strong positive correlation of mRNA expression between DZIP3 and Cyclin D1 in different cancer types was observed. Additionally, DZIP3 regulated several cell cycle proteins by modulating the Cyclin D1-E2F axes. Taken together, this study demonstrates for the first time that DZIP3 uses a unique two-pronged mechanism in its stabilization of Cyclin D1 to drive cell-cycle and cancer progression. SIGNIFICANCE: These findings show that DZIP3 is a novel driver of cell-cycle and cancer progression via its control of Cyclin D1 mRNA and protein stability in a cell-cycle phase-dependent manner. GRAPHICAL ABSTRACT: http://cancerres.aacrjournals.org/content/canres/81/2/315/F1.large.jpg.


Conflict of interest statement

The authors declare that they have no conflict of interests.

Figures
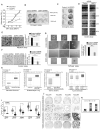
Figure 1
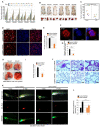
Figure 1. DZIP3 drives growth, migration, and invasion of cancer cells.
(A) MTT assays were performed in MCF7 breast cancer cells transfected with control and DZIP3 siRNA. Data is presented as mean ± SD, n=3, *p<0.05, ***p<0.0005. (B) Clonogenic assay was performed with MCF7 control and DZIP3 stable knockdown cells with an initial plating density of 5000 and 10000 cells. (C) Clonogenic assay was performed in HEK293 cells transiently transfected with control and HA-DZIP3. (D) Wound healing or scratch assay was performed to examine migration capacity in control and DZIP3 stable knockdown MCF7 cells. (E and F) Transwell migration and matrigel invasion assay were performed in UM-UC3 control and DZIP3 stable knockdown cells. Data in bar graph is presented as mean ± SD, n=3, **p<0.005, ***p<0.0005. (G) Soft agar colony formation assay was performed to check tumorigenicity of UM-UC3 control and DZIP3 stable knockdown cells. Data in bar graph presented as mean ± SD, n=3, ***p<0.0005. (H) Oncomine analysis of DZIP3 mRNA expression levels in different cancer types (liposarcoma, lung carcinoma, gastric adenocarcinoma, and breast carcinoma) as compared with normal tissues. Fold change and p-values are indicated in the graph. (I) DZIP3 mRNA expression in tumors and normal control patient samples were evaluated in the TCGA dataset using the GEPIA2 platform. TPM (Transcripts Per Million), Log2FC| Cutoff= 1; p-value Cutoff=0.01 (J and K) (J) Representative images of tissue microarray analysis of DZIP3 protein expression in normal breast tissue (n = 22) and invasive human breast cancer tissue (n = 164) samples. (K) The intensity of staining was scored using a four-tier scale and defined as follows: 0, 0%–20%; 1, weak staining (20%–50%); 2, moderate staining (50%–75%); and 3, strong staining (75%–100%). Based on these scores, the number of tissue samples in each group of tissue array (Normal, Invasive, and Metastatic) having these scores were plotted.
Figure 2
Figure 2. DZIP3 promotes tumor growth and metastasis in animal models.
(A) The graph depicts tumor volumes (mm) of UM-UC3 control and DZIP3 stable knockdown cells. (B) Images of tumors formed in the nude mice and pictures of the dissected tumors. (C) The graph represents the final tumor volume. n=7, mean±SE, ***p<0.0005. (D and E) (D) Immunohistochemical analysis was performed with the Ki-67 cell proliferation marker in control and DZIP3 stable knockdown tumor sections. (E) The graph represents % of cells with Ki-67 positive staining. >400 cells were analyzed from different sections from different animals, mean ±SD, **p < 0.005. The white arrowhead indicates the Ki-67 positive mitotic cells. (F and G) (F) Representative images of Ki-67 positive mitotic cells. (G) The graph represents % of Ki-67 positive mitotic cells in control and DZIP3 stable knockdown tumors in IHC's microscopic fields. >10 microscopic fields were analyzed from different sections from 3 different animals, mean ±SD, **p < 0.005 (H-J) (H) Representative images of lungs of mice injected (tail-vein) with MDA-MB-231 control and DZIP3 stable knockdown cell line. (I) The average number of nodules were counted manually. n=3 mean ±SD, **p < 0.005. (J) Representative lung sections showing metastatic foci in control groups. (K and L) (K) Lateral view of fluorescent transgenic [Tg(fli1:nEGFP)] zebrafish embryos at Day 0 and Day 5 injected with Dil-Red stained MDA-MB-231 control and DZIP3 stable knockdown cells. (L) The tumor growth was assessed by an increase in fluorescence intensity on the 5th day compared to the day of injection. n=10, mean ±SD, **p < 0.005 The quantitation of fluorescence intensity was performed using ImageJ software and represented as % mean fluorescence intensity where day 0 reading was taken as baseline.
Figure 3
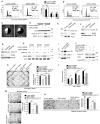
Figure 3. DZIP3 controls cell cycle progression and cell growth by regulating the expression of Cyclin D1.
(A) Cell cycle analysis of MCF7 control and DZIP3 stable knockdown cell line. The graph represents the percentage of cells in different cell cycle phases. mean ± SD, n=3, **p<0.005. (B-C) (B) Cell cycle analysis of UM-UC3 control and DZIP3 stable knockdown cells. (C) Pie charts represent the percentage of cells in different cell cycle phases. (D-E) Western blot analysis of (D) MCF7 control and DZIP3 shRNA cell lysates probed with indicated antibodies. (E) Control and DZIP3 siRNA transfected MCF7 cell lysates probed with indicated antibodies. (F-G) Western blot analysis of (F) HEK293T (G) MCF7, control, and DZIP3 CRISPR knockout clones cell lysates probed with indicated antibodies. (H) Western blot analysis of UM-UC3 control and DZIP3 shRNA tumor lysates probed with indicated antibodies. (I) Western blot analysis of control and HA-DZIP3 plasmids transfected HEK293 cell lysates probed with indicated antibodies. (J) Western blot analysis of cell lysates of indicated plasmids transfected MCF7 control and DZIP3 shRNA cells probed with indicated antibodies. (K) Clonogenic assay was performed with control, DZIP3 stable knockdown cells, and knockdown cells complemented with HA-Cyclin D1 or Flag-DZIP3. The graph depicts the average number of colonies in these conditions. mean ± SE, n=3, **p<0.005, ***p<0.0005. (L) Cell proliferation was evaluated by performing MTT assay in MCF7 control, DZIP3 stable knockdown, and Cyclin D1 complemented DZIP3 knockdown cells. Data is presented as mean ± SD, n=2, *p<0.05, **p<0.005. (M) Migration assay was performed with MCF7 control, DZIP3 stable knockdown, and Cyclin D1 complemented DZIP3 knockdown cells. Data are presented as mean ± SE, n=3, ***p<0.0005. (N) Matrigel invasion assay was performed with UM-UC3 control, DZIP3 stable knockdown, and Cyclin D1 complemented DZIP3 knockdown cells. Data are presented as mean ± SE, n=3, ***p<0.0005.
Figure 4
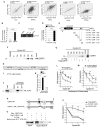
Figure 4. DZIP3 interacts with Cyclin D1 mRNA and stabilizes it.
(A) The graphs depict the correlation of mRNA expression of DZIP3 and Cyclin D1 in different cancer types. r, Spearman's rank correlation coefficient. TPM (Transcripts Per Million). THY, Thymoma; BRCA, Breast invasive carcinoma; KIRC, Kidney renal clear cell carcinoma; KICH, Kidney Chromophobe; PRAD, Prostate adenocarcinoma (B and C) (B) qRT-PCR analysis of enrichment of Cyclin D1 mRNA in RNA Immunoprecipitation assay using IgG and DZIP3 antibody. The fold enrichment was calculated by taking IgG values as a baseline. Data is presented as mean ± SD, n=3, **p<0.005. (C) Agarose gel analysis of Cyclin D1 RT-PCR product from the same experiment. (D) qRT-PCR analysis of enrichment of Cyclin D1 mRNA in RNA Immunoprecipitation assay using Flag antibody. The fold enrichment was calculated by taking control values as a baseline. Data is presented as mean ± SD, n=3, ***p<0.0005 (E) Schematic representation of different RNA fragments of Cyclin D1 mRNA 3'-UTRs and 5'-UTR used in RNA pull-down assays. The black bars in 3'UTR represent the AU-rich elements. (F) The biotinylated 5'UTR region and 3'UTR's of Cyclin D1 transcripts were incubated with lysates of HEK293T cells followed by pull-down with streptavidin-tagged beads. The pulldown complexes were subjected to western blotting with Flag antibody. Bead control does not contain RNA. (G) The biotinylated 3'UTR's of Cyclin D1 transcripts were incubated with lysates of 3X Flag vector or Flag-DZIP3 expressing HEK293T cells followed by pull-down with streptavidin-tagged beads. The pull-down complexes were subjected to western blotting with Flag antibody. (H-K) (H) The nucleotide sequence of the 3D region of 3'UTR of Cyclin D1 mRNA containing four ATTTA sites. (I) The mutation of ATTTA to AGGGA were introduced in all the four sites in indicated 3D region. (J) The biotinylated 3'-UTR of Cyclin D1 -D fragment (3D) wild type and its mutant were incubated with Flag-DZIP3 expressing HEK293T cell lysates followed by pull-down with streptavidin-tagged beads. The pull-down complexes were subjected to western blotting with Flag antibody. (K) Graph depicts the ratio of binding affinity of 3D and 3D-mut regions for Flag-DZIP3 as measured by image J analysis of western blots of biotin-pull down assays (panel J). Data is presented as mean ± SD, n=3, ***p<0.0005 (L and M) (L) Control HA-vector and HA-DZIP3 transiently transfected HEK293T cells and (M) control and DZIP3 shRNA stable knockdown MCF7 cells were serum-starved for 16 h and released into a full medium for 3 h and treated with actinomycin D (5 µg/ml) for indicated time points. The total RNA was isolated and subjected to qRT-PCR with Cyclin D1 specific primers. Data are normalized with GAPDH (transcript levels of GAPDH was not affected by actinomycin D). Data are presented as mean ± SD, n=3, *p<0.05, **p<0.005. (N) Schematic representation of wild type (WT) and lysine-rich (KR) deletion mutant of DZIP3. (O) Biotinylated 5' and 3'D UTR's of Cyclin D1 were used for RNA Pull-down experiments with lysates of HEK293T cells transiently transfected with vector control, wild type Flag-DZIP3 and Flag- DZIP3-ΔKR and subjected to western blot analysis with Flag antibody. (P) Actinomycin D chase assay and qRT PCR assays were performed with HEK293T cells transiently transfected with control, Flag-DZIP3, and Flag DZIP3-ΔKR. Data are presented as mean ± SD, n=3, **p<0.005.
Figure 5
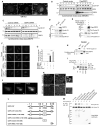
Figure 5. DZIP3 interacts, co-localizes, and stabilizes Cyclin D1.
(A) Representative confocal images of DZIP3 localization in UM-UC3. (B and C) Western blot analysis of cycloheximide chase experiment performed with (B) HEK293T transiently transfected with indicated plasmids (C) shControl and shDZIP3 MCF7 cells. (D and E) Immunoprecipitation analysis of the interaction between (D) endogenous DZIP3 and endogenous Cyclin D1 (E) Flag-DZIP3 and HA-Cyclin D1. (F-G) (F) Representative images of proximity ligation assay performed with unsynchronized and serum synchronized HeLa cells that were transfected with indicated plasmids. (G) The graph represents the number of puncta's present per 100 cells. Data, mean ± SD, n=3, *p<0.05 ***p<0.0005. (H) GST pull-down assay using purified GST or GST-tagged DZIP3 (CCD-RING domain) and in-vitro-translated and S- labelled HA-Cyclin D1. (I) The western blot analysis of co-IP assays performed with HEK293 cells transiently co-transfected with Flag-DZIP3, HA-Cyclin D1, and synchronized in G1 (serum starvation), G1/S (single thymidine block) or G2/M (nocodazole block) phases. (J) Representative confocal images of DZIP3 and Cyclin D1 protein localization in serum synchronized MCF7 cells. (K) Representative confocal images of immunofluorescence analysis of Cyclin D1 expression in tumor xenograft sections. (L) The domain organization map of DZIP3 and its truncated mutants cloned as Flag-tagged proteins. (M) Co-immunoprecipitation analysis to map the domain interaction between Flag-DZIP3 constructs and HA-Cyclin D1.
Figure 6
Figure 6. DZIP3 increases the K63-linked ubiquitination of Cyclin D1 to stabilize it.
(A-B) Western blot analysis of co-IP experiments performed with lysates of HEK293T cells transiently transfected with Flag-DZIP3, Cyclin D1, HA-K48-Ubiquitin and HA-K63-Ubiquitin plasmids (variants of ubiquitin which can only be ubiquitinated at either lysine 48 (K48) or lysine 63 (K63)) (C) Western blot analysis of Cyclin D1 ubiquitination in the absence and presence of DZIP3 by Ni-NTA pull-down assays using transiently transfected plasmid constructs as indicated. His-tagged ubiquitin (His-K63 was mutated at all lysines except at 63 position) was used in these assays. (SE, short exposure; LE, long exposure) (D) Western blot analysis of endogenous Cyclin D1 ubiquitination in MCF7 Control and DZIP3 knockdown cells. (IP was run in a ratio of adjusted equalized inputs to reduce the artifact of DZIP3 mediated stability). (E) Western blot analysis of co-IP experiments performed with HEK293T cells transiently transfected with Flag-DZIP3, Cyclin D1, HA-K48-Ubiquitin, and HA-K63-Ubiquitin plasmids, and synchronized in G1 (serum starvation), G1/S (single thymidine block) or G2/M (Nocodazole block) phases. (IP was run in a ratio of adjusted equalized inputs to reduce the artifact of DZIP3 mediated stability). (F) Western blot analysis of co-IP experiments performed with HEK293T cells transiently transfected with Flag-DZIP3, FLAG ARING DZIP3, Cyclin D1, and HA-K63-Ubiquitin plasmids. (IP was run in a ratio of adjusted equalized inputs to reduce the artifact of DZIP3 mediated stability). (G) Western blot analysis of Cyclin D1 in HEK293T cells overexpressing Flag-DZIP3 and FLAG ARING DZIP3. (H) Western blot analysis of Cyclin D1 in HEK293T cells overexpressing Flag-DZIP3 and FLAG-DZIP3-RING. (I) Western blot analysis of MG132 untreated or treated, shcontrol, and shDZIP3 MCF7 cells lysates probed with indicated antibodies. The imageJ quantification of western band intensity was performed and fold change was depicted, where MG132 untreated samples were used as baseline.
Figure 7
Figure 7. DZIP3 controls Cyclin D1-E2F axes.
(A) Schematic representation of DZIP3 controlling E2F downstream genes via Cyclin D1. (B-C) A qRT-PCR analysis to evaluate the expressions of indicated genes from the total RNA of MCF7 control and DZIP3 stable knockdown cells. Data is presented as mean ± SE, n=3, *p<0.05, **p<0.005, ***p<0.0005. (D) Western blot analysis of UM-UC3 control and DZIP3 stable knockdown tumor xenograft lysates probed with indicated antibodies (E) Western blot analysis of MCF7 control and DZIP3 stable knockdown cell lysates probed with indicated antibodies (F) Western blot analysis of HEK293 control and HA-DZIP3 transiently transfected cell lysates with indicated antibodies. (G) Western blot analysis of MCF7 control and DZIP3 stable knockdown cells transfected with indicated plasmids and probed with indicated antibodies. (H) Schematic presentation of work presented in this study.

Similar articles

Cited by

References

    1. Berndsen CE, Wolberger C. New insights into ubiquitin E3 ligase mechanism. Nat Struct Mol Biol. 2014;21:301–7. - PubMed
    1. Lukong KE, Chang KW, Khandjian EW, Richard S. RNA-binding proteins in human genetic disease. Trends Genet. 2008;24:416–25. - PubMed
    1. Hildebrandt A, Alanis-Lobato G, Voigt A, Zarnack K, Andrade-Navarro MA, Beli P, et al. Interaction profiling of RNA-binding ubiquitin ligases reveals a link between posttranscriptional regulation and the ubiquitin system. Sci Rep. 2017;7 16582. - PMC - PubMed
    1. Garzia A, Jafarnejad SM, Meyer C, Chapat C, Gogakos T, Morozov P, et al. The E3 ubiquitin ligase and RNA-binding protein ZNF598 orchestrates ribosome quality control of premature polyadenylated mRNAs. Nat Commun. 2017;8 16056. - PMC - PubMed
    1. Zhang Q, Fan L, Hou F, Dong A, Wang YX, Tong Y. New Insights into the RNA-Binding and E3 Ubiquitin Ligase Activities of Roquins. Sci Rep. 2015;5 15660. - PMC - PubMed

Publication types

MeSH terms