

Detecting Selection from Linked Sites Using an F-Model
- PMID: 33067324
- PMCID: PMC7768260
- DOI: 10.1534/genetics.120.303780
Detecting Selection from Linked Sites Using an F-Model
Abstract
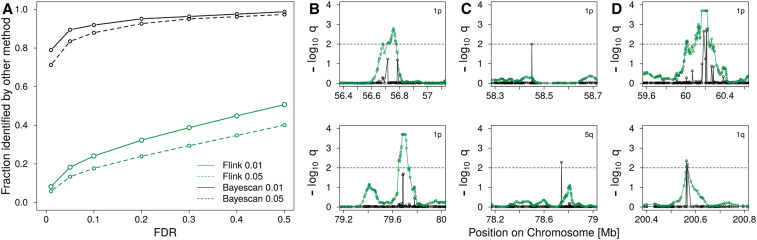
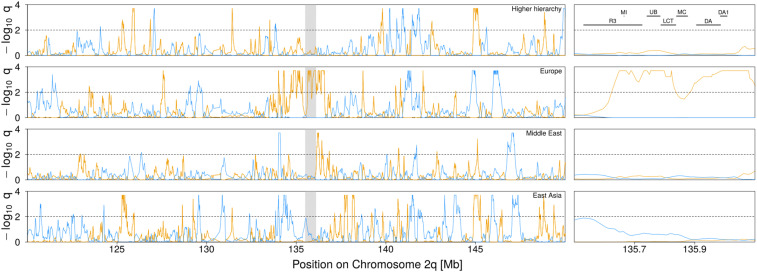
Allele frequencies vary across populations and loci, even in the presence of migration. While most differences may be due to genetic drift, divergent selection will further increase differentiation at some loci. Identifying those is key in studying local adaptation, but remains statistically challenging. A particularly elegant way to describe allele frequency differences among populations connected by migration is the F-model, which measures differences in allele frequencies by population specific FST coefficients. This model readily accounts for multiple evolutionary forces by partitioning FST coefficients into locus- and population-specific components reflecting selection and drift, respectively. Here we present an extension of this model to linked loci by means of a hidden Markov model (HMM), which characterizes the effect of selection on linked markers through correlations in the locus specific component along the genome. Using extensive simulations, we show that the statistical power of our method is up to twofold higher than that of previous implementations that assume sites to be independent. We finally evidence selection in the human genome by applying our method to data from the Human Genome Diversity Project (HGDP).
Keywords: Bayesian statistics; F-statistics; balancing selection; divergent selection; hidden Markov model.
Copyright © 2020 by the Genetics Society of America.
Figures
Similar articles
-
Inference of Locus-Specific Population Mixtures from Linked Genome-Wide Allele Frequencies.Mol Biol Evol. 2024 Jul 3;41(7):msae137. doi: 10.1093/molbev/msae137. Mol Biol Evol. 2024. PMID: 38958167 Free PMC article.
-
Identifying outlier loci in admixed and in continuous populations using ancestral population differentiation statistics.Mol Ecol. 2016 Oct;25(20):5029-5042. doi: 10.1111/mec.13822. Epub 2016 Sep 14. Mol Ecol. 2016. PMID: 27565448
-
Human demographic history has amplified the effects of background selection across the genome.PLoS Genet. 2018 Jun 18;14(6):e1007387. doi: 10.1371/journal.pgen.1007387. eCollection 2018 Jun. PLoS Genet. 2018. PMID: 29912945 Free PMC article.
-
Prediction and estimation of effective population size.Heredity (Edinb). 2016 Oct;117(4):193-206. doi: 10.1038/hdy.2016.43. Epub 2016 Jun 29. Heredity (Edinb). 2016. PMID: 27353047 Free PMC article. Review.
-
Genetic variation in the acorn barnacle from allozymes to population genomics.Integr Comp Biol. 2012 Sep;52(3):418-29. doi: 10.1093/icb/ics099. Epub 2012 Jul 4. Integr Comp Biol. 2012. PMID: 22767487 Free PMC article. Review.
Cited by
-
Inference of Locus-Specific Population Mixtures from Linked Genome-Wide Allele Frequencies.Mol Biol Evol. 2024 Jul 3;41(7):msae137. doi: 10.1093/molbev/msae137. Mol Biol Evol. 2024. PMID: 38958167 Free PMC article.
-
Selection on ancestral genetic variation fuels repeated ecotype formation in bottlenose dolphins.Sci Adv. 2021 Oct 29;7(44):eabg1245. doi: 10.1126/sciadv.abg1245. Epub 2021 Oct 27. Sci Adv. 2021. PMID: 34705499 Free PMC article.
-
Disparate genetic divergence patterns in three corals across a pan-Pacific environmental gradient highlight species-specific adaptation.NPJ Biodivers. 2023 Jul 7;2(1):15. doi: 10.1038/s44185-023-00020-8. NPJ Biodivers. 2023. PMID: 39242808 Free PMC article.
-
Identifying loci under selection via explicit demographic models.Mol Ecol Resour. 2021 Nov;21(8):2719-2737. doi: 10.1111/1755-0998.13415. Epub 2021 Jun 3. Mol Ecol Resour. 2021. PMID: 33964107 Free PMC article.
-
Population size rescaling significantly biases outcomes of forward-in-time population genetic simulations.bioRxiv [Preprint]. 2024 Sep 3:2024.04.07.588318. doi: 10.1101/2024.04.07.588318. bioRxiv. 2024. Update in: Genetics. 2025 Jan 8;229(1):1-57. doi: 10.1093/genetics/iyae180. PMID: 38645049 Free PMC article. Updated. Preprint.
References
-
- Beaumont M., and Nichols R. A., 1996. Evaluating loci for use in the genetic analysis of population structure. Proc. Biol. Sci. 263: 1619–1626. 10.1098/rspb.1996.0237 - DOI
Publication types
MeSH terms
Grants and funding
LinkOut - more resources
Full Text Sources
Miscellaneous
