. 2020 Nov 18;40(47):8994-9011.
doi: 10.1523/JNEUROSCI.1486-20.2020. Epub 2020 Oct 16.

Astrocytes in the Ventrolateral Preoptic Area Promote Sleep

Affiliations

Astrocytes in the Ventrolateral Preoptic Area Promote Sleep

Jae-Hong Kim et al. J Neurosci. .

Abstract

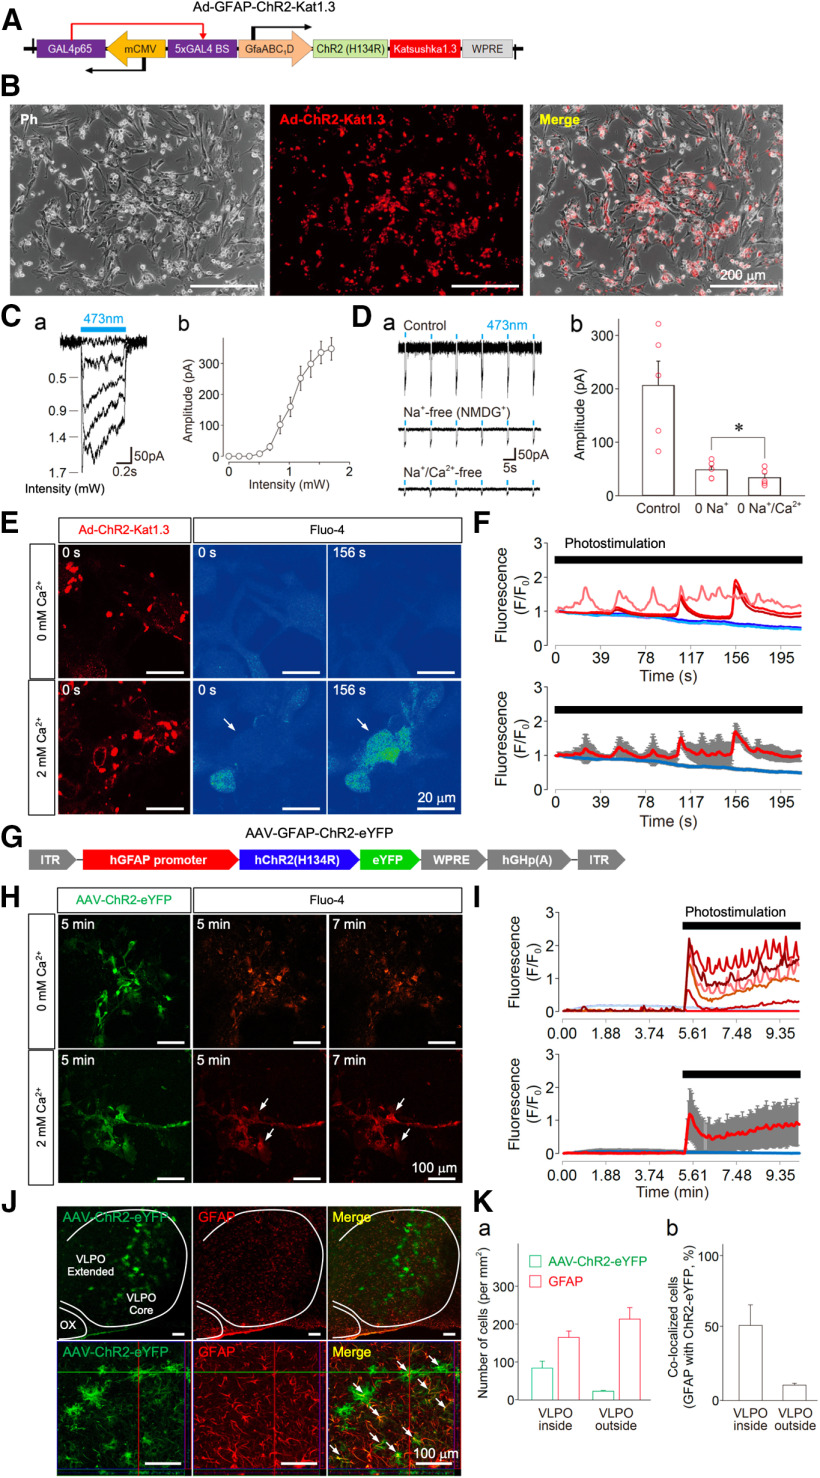
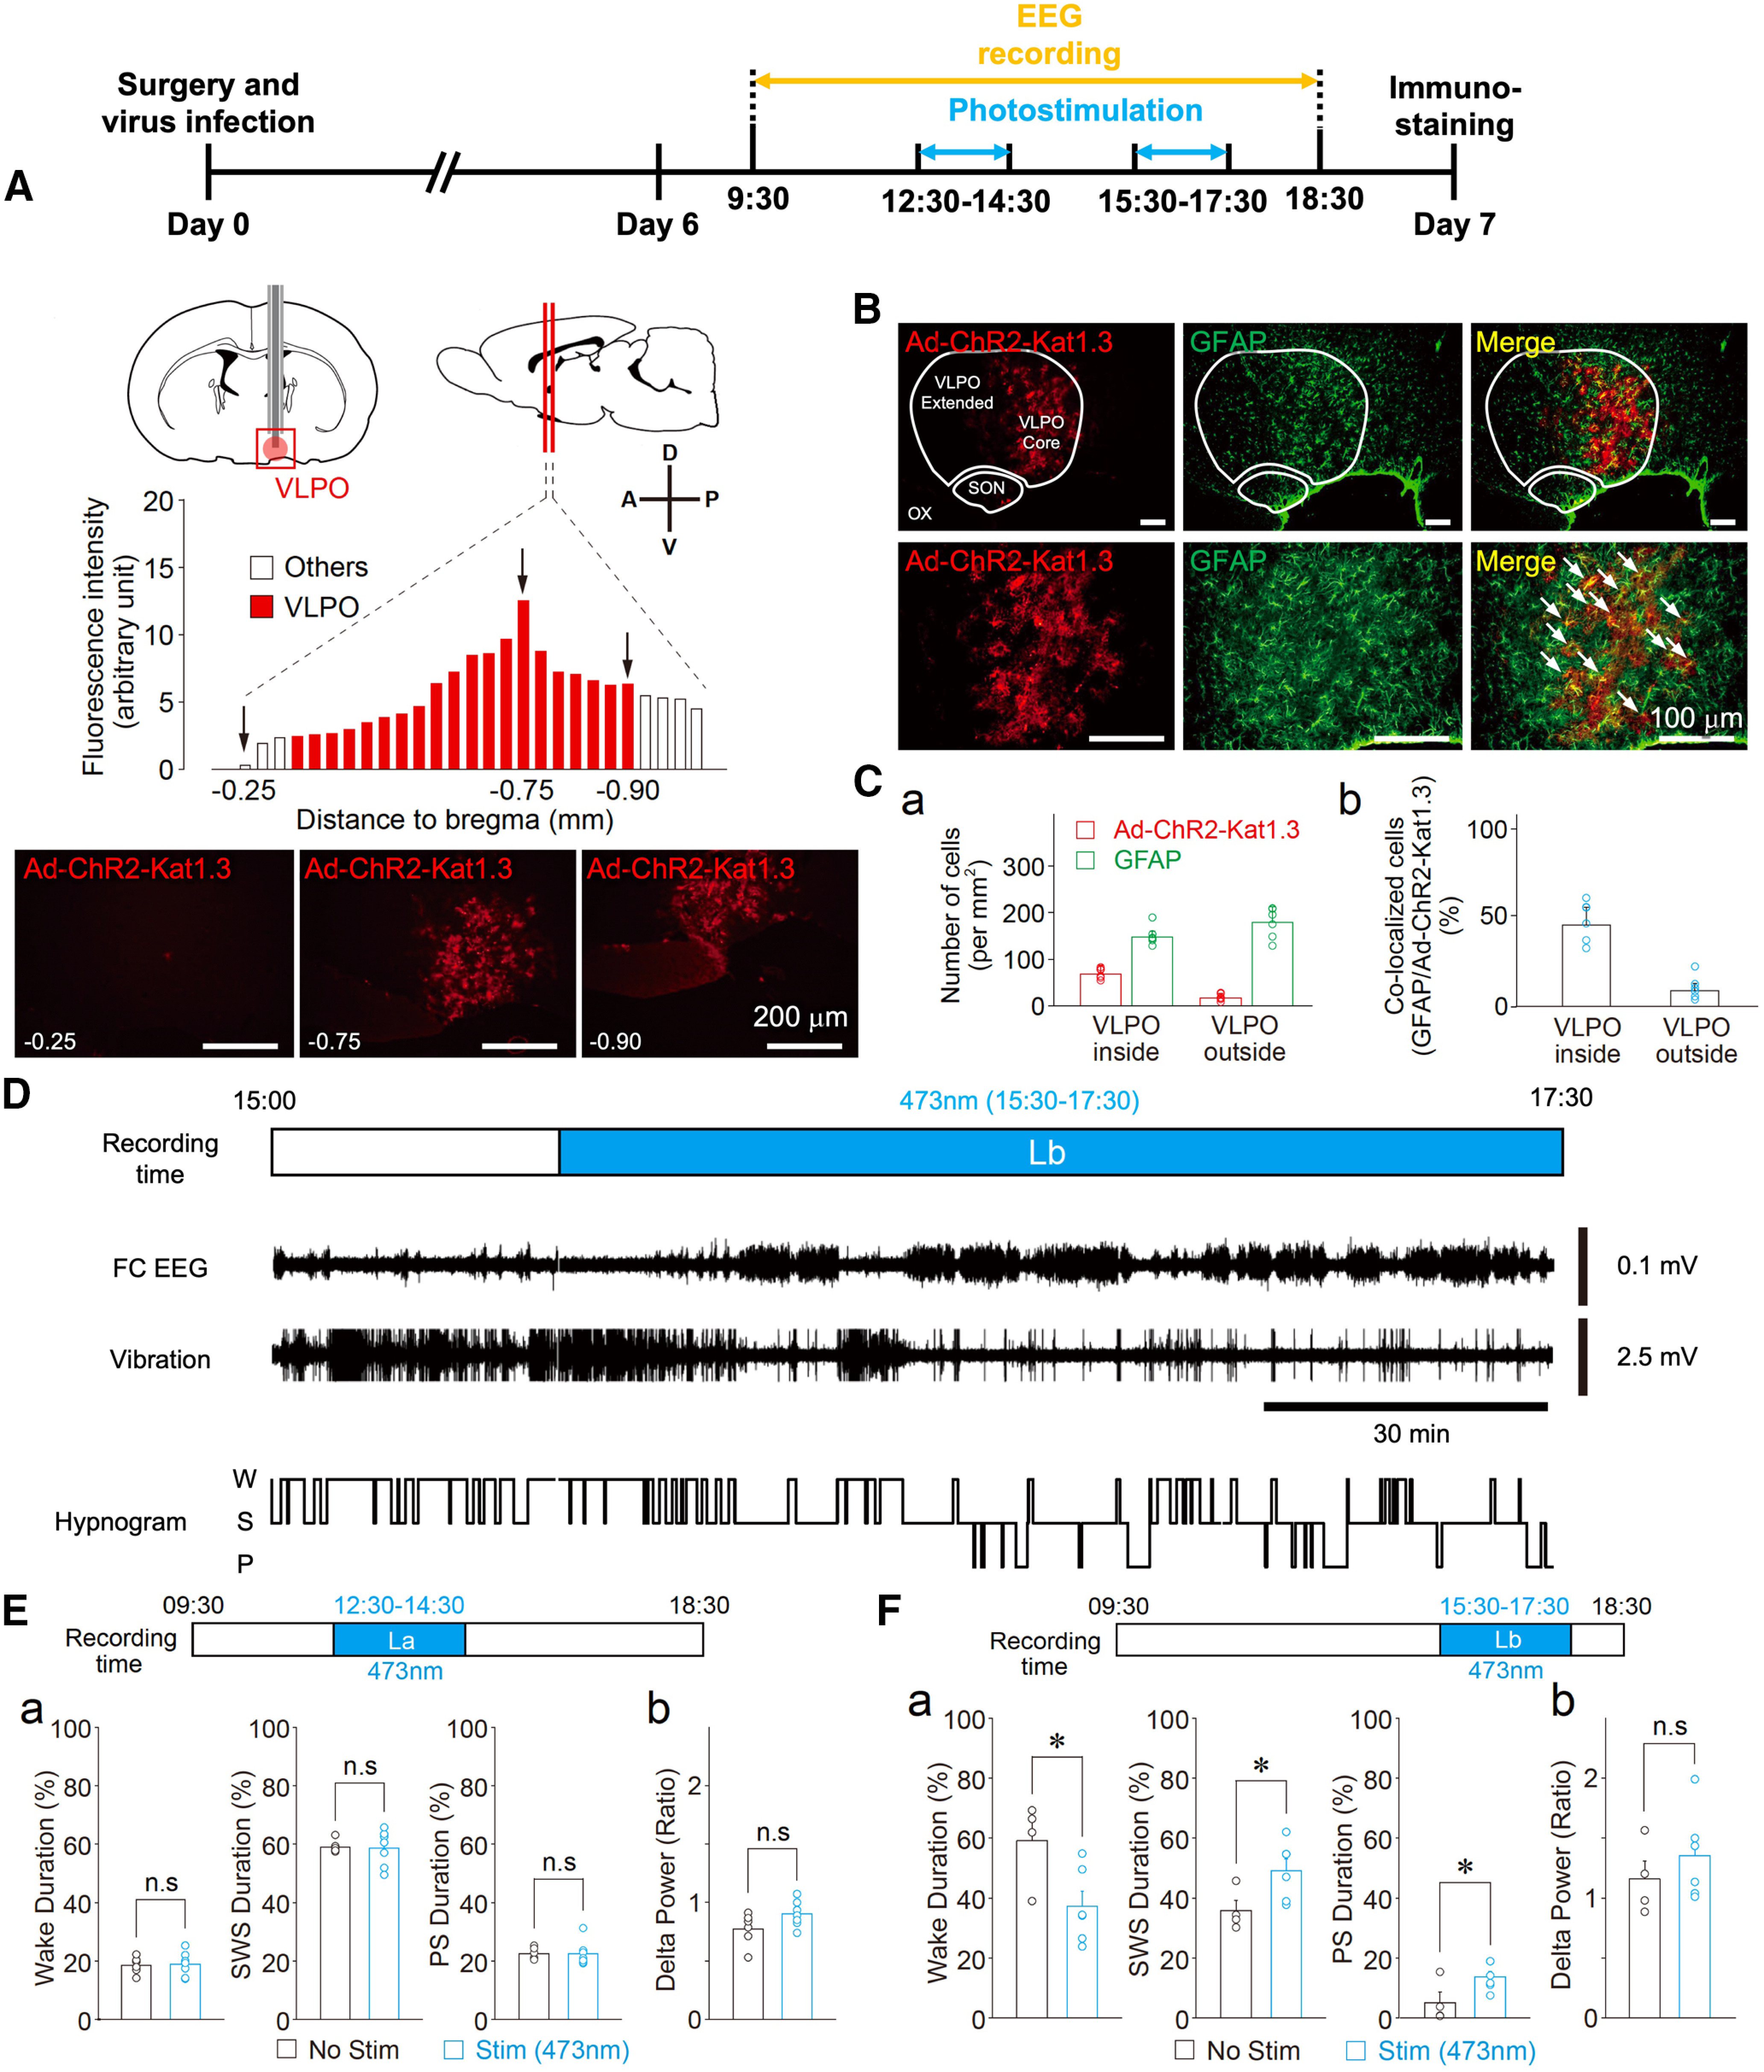
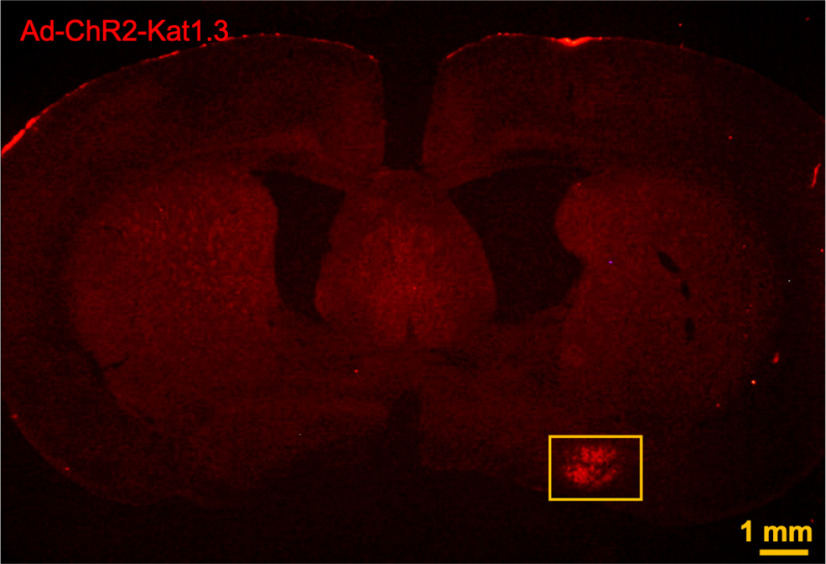
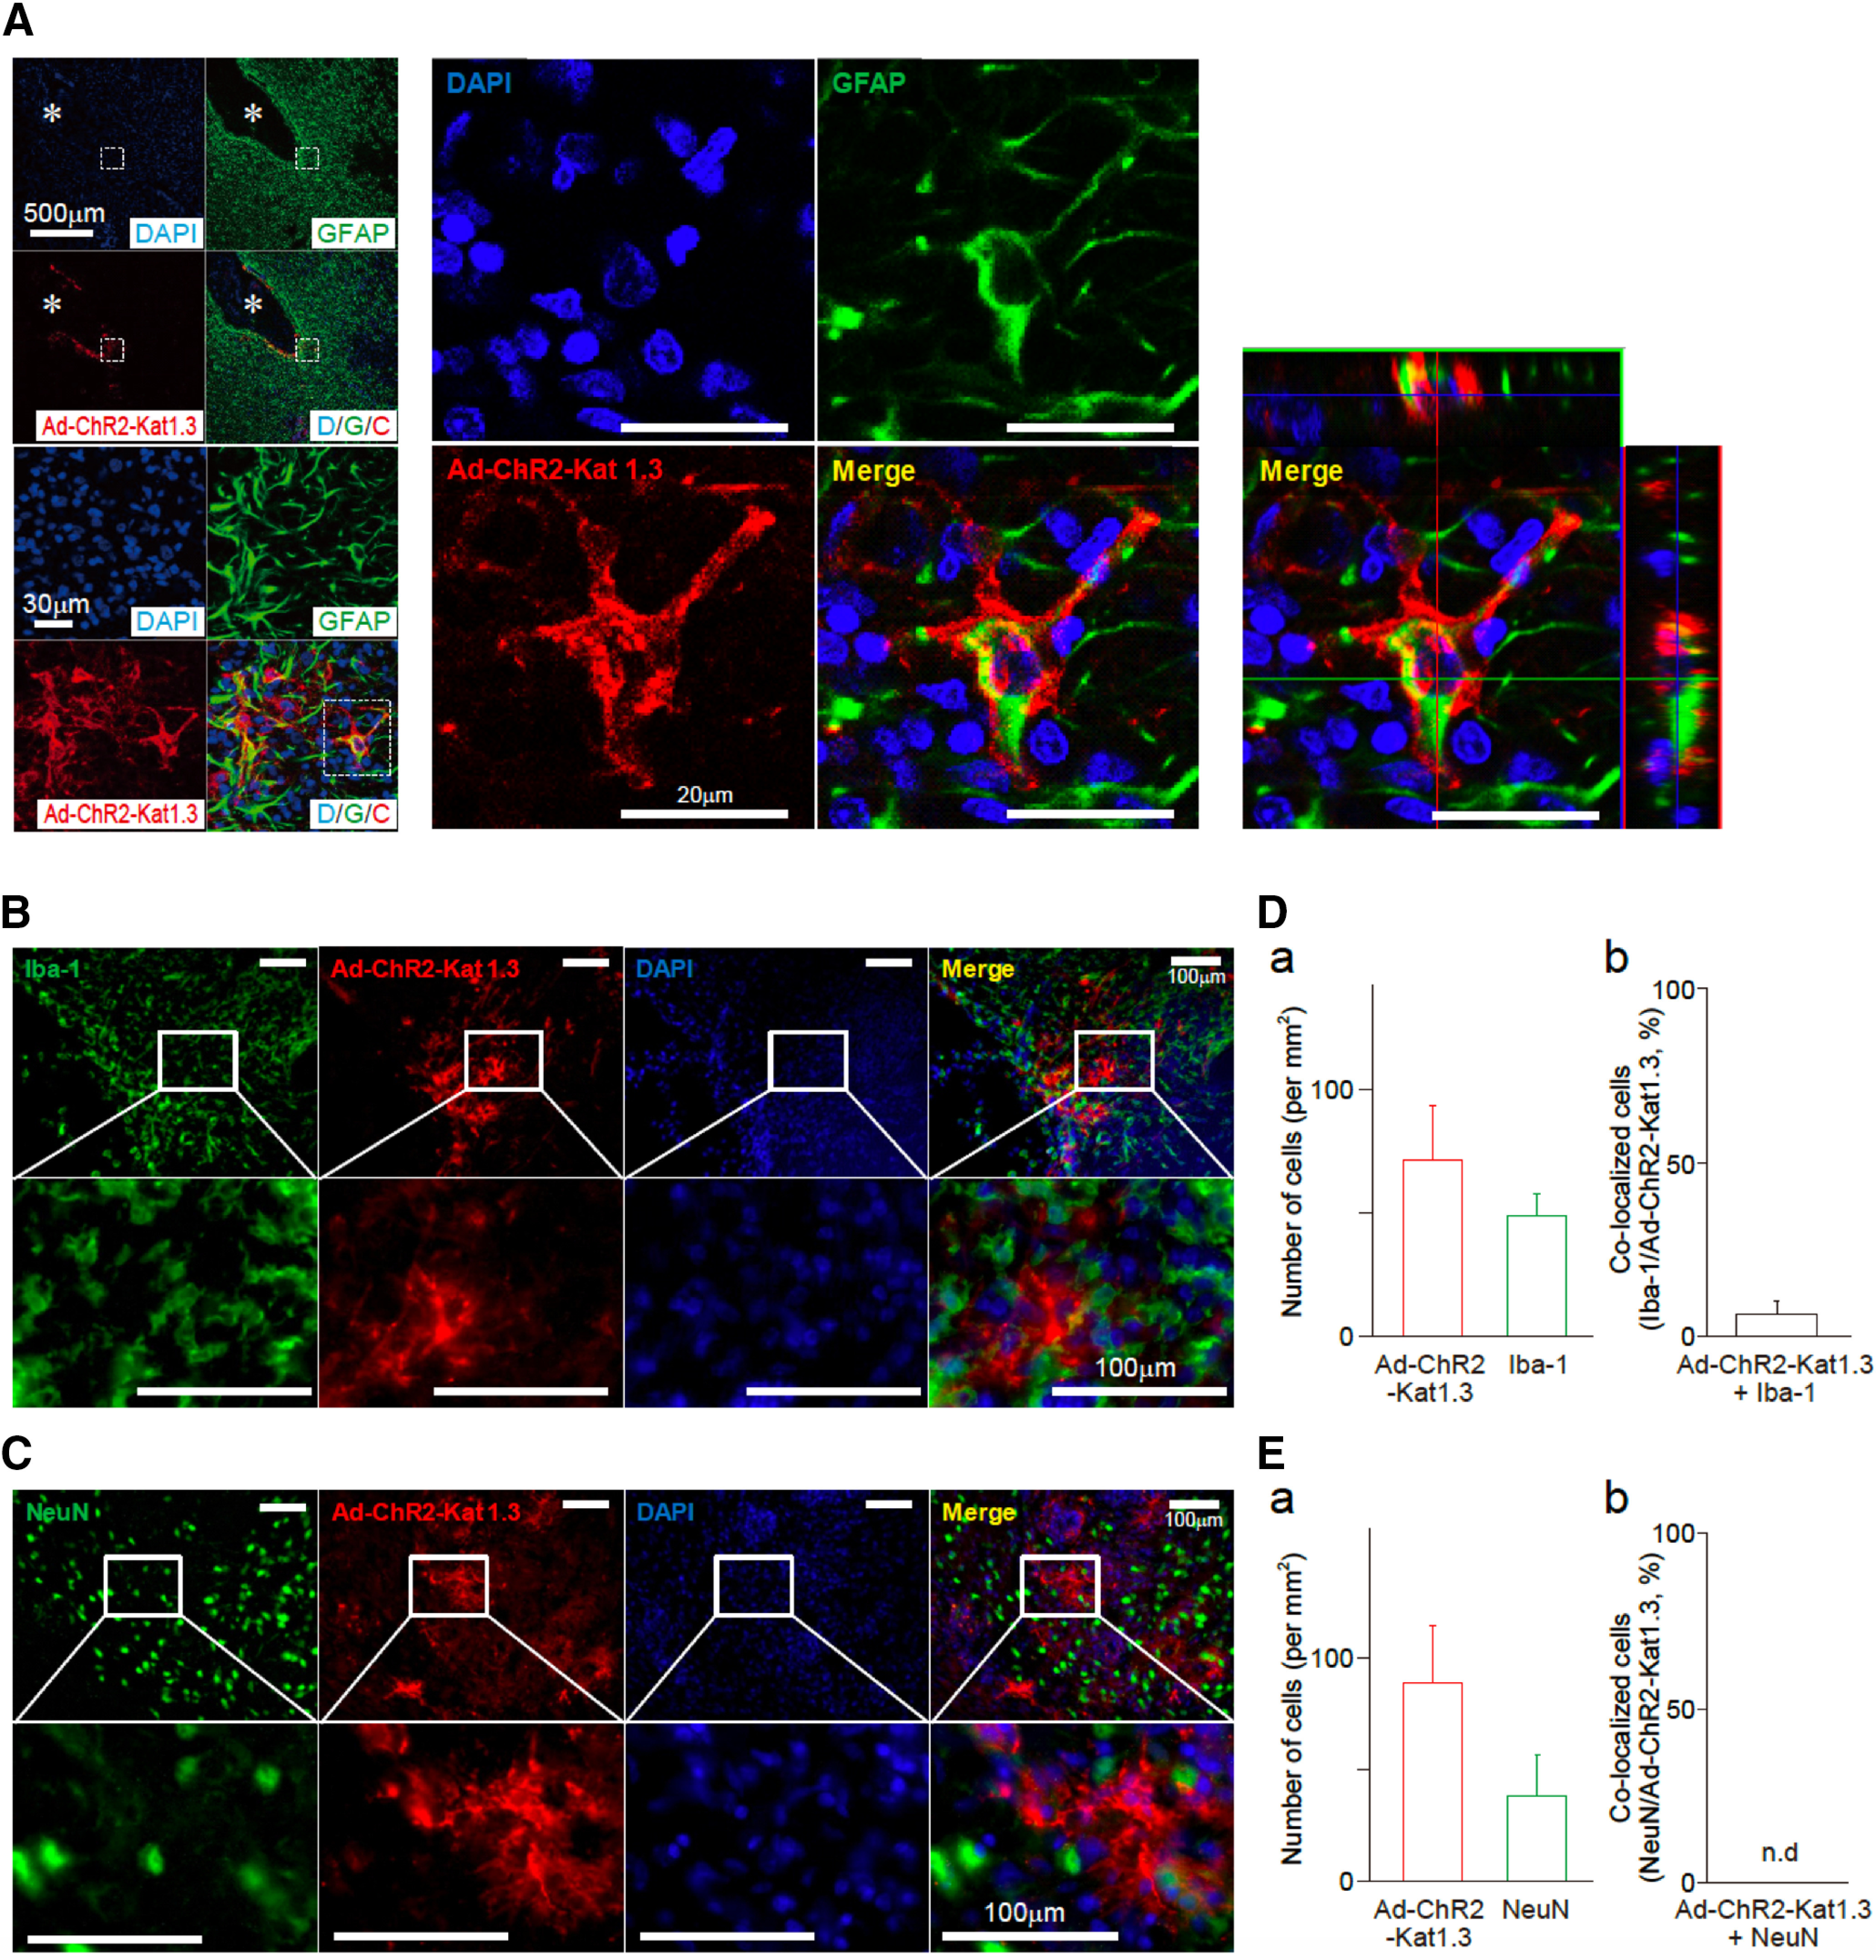
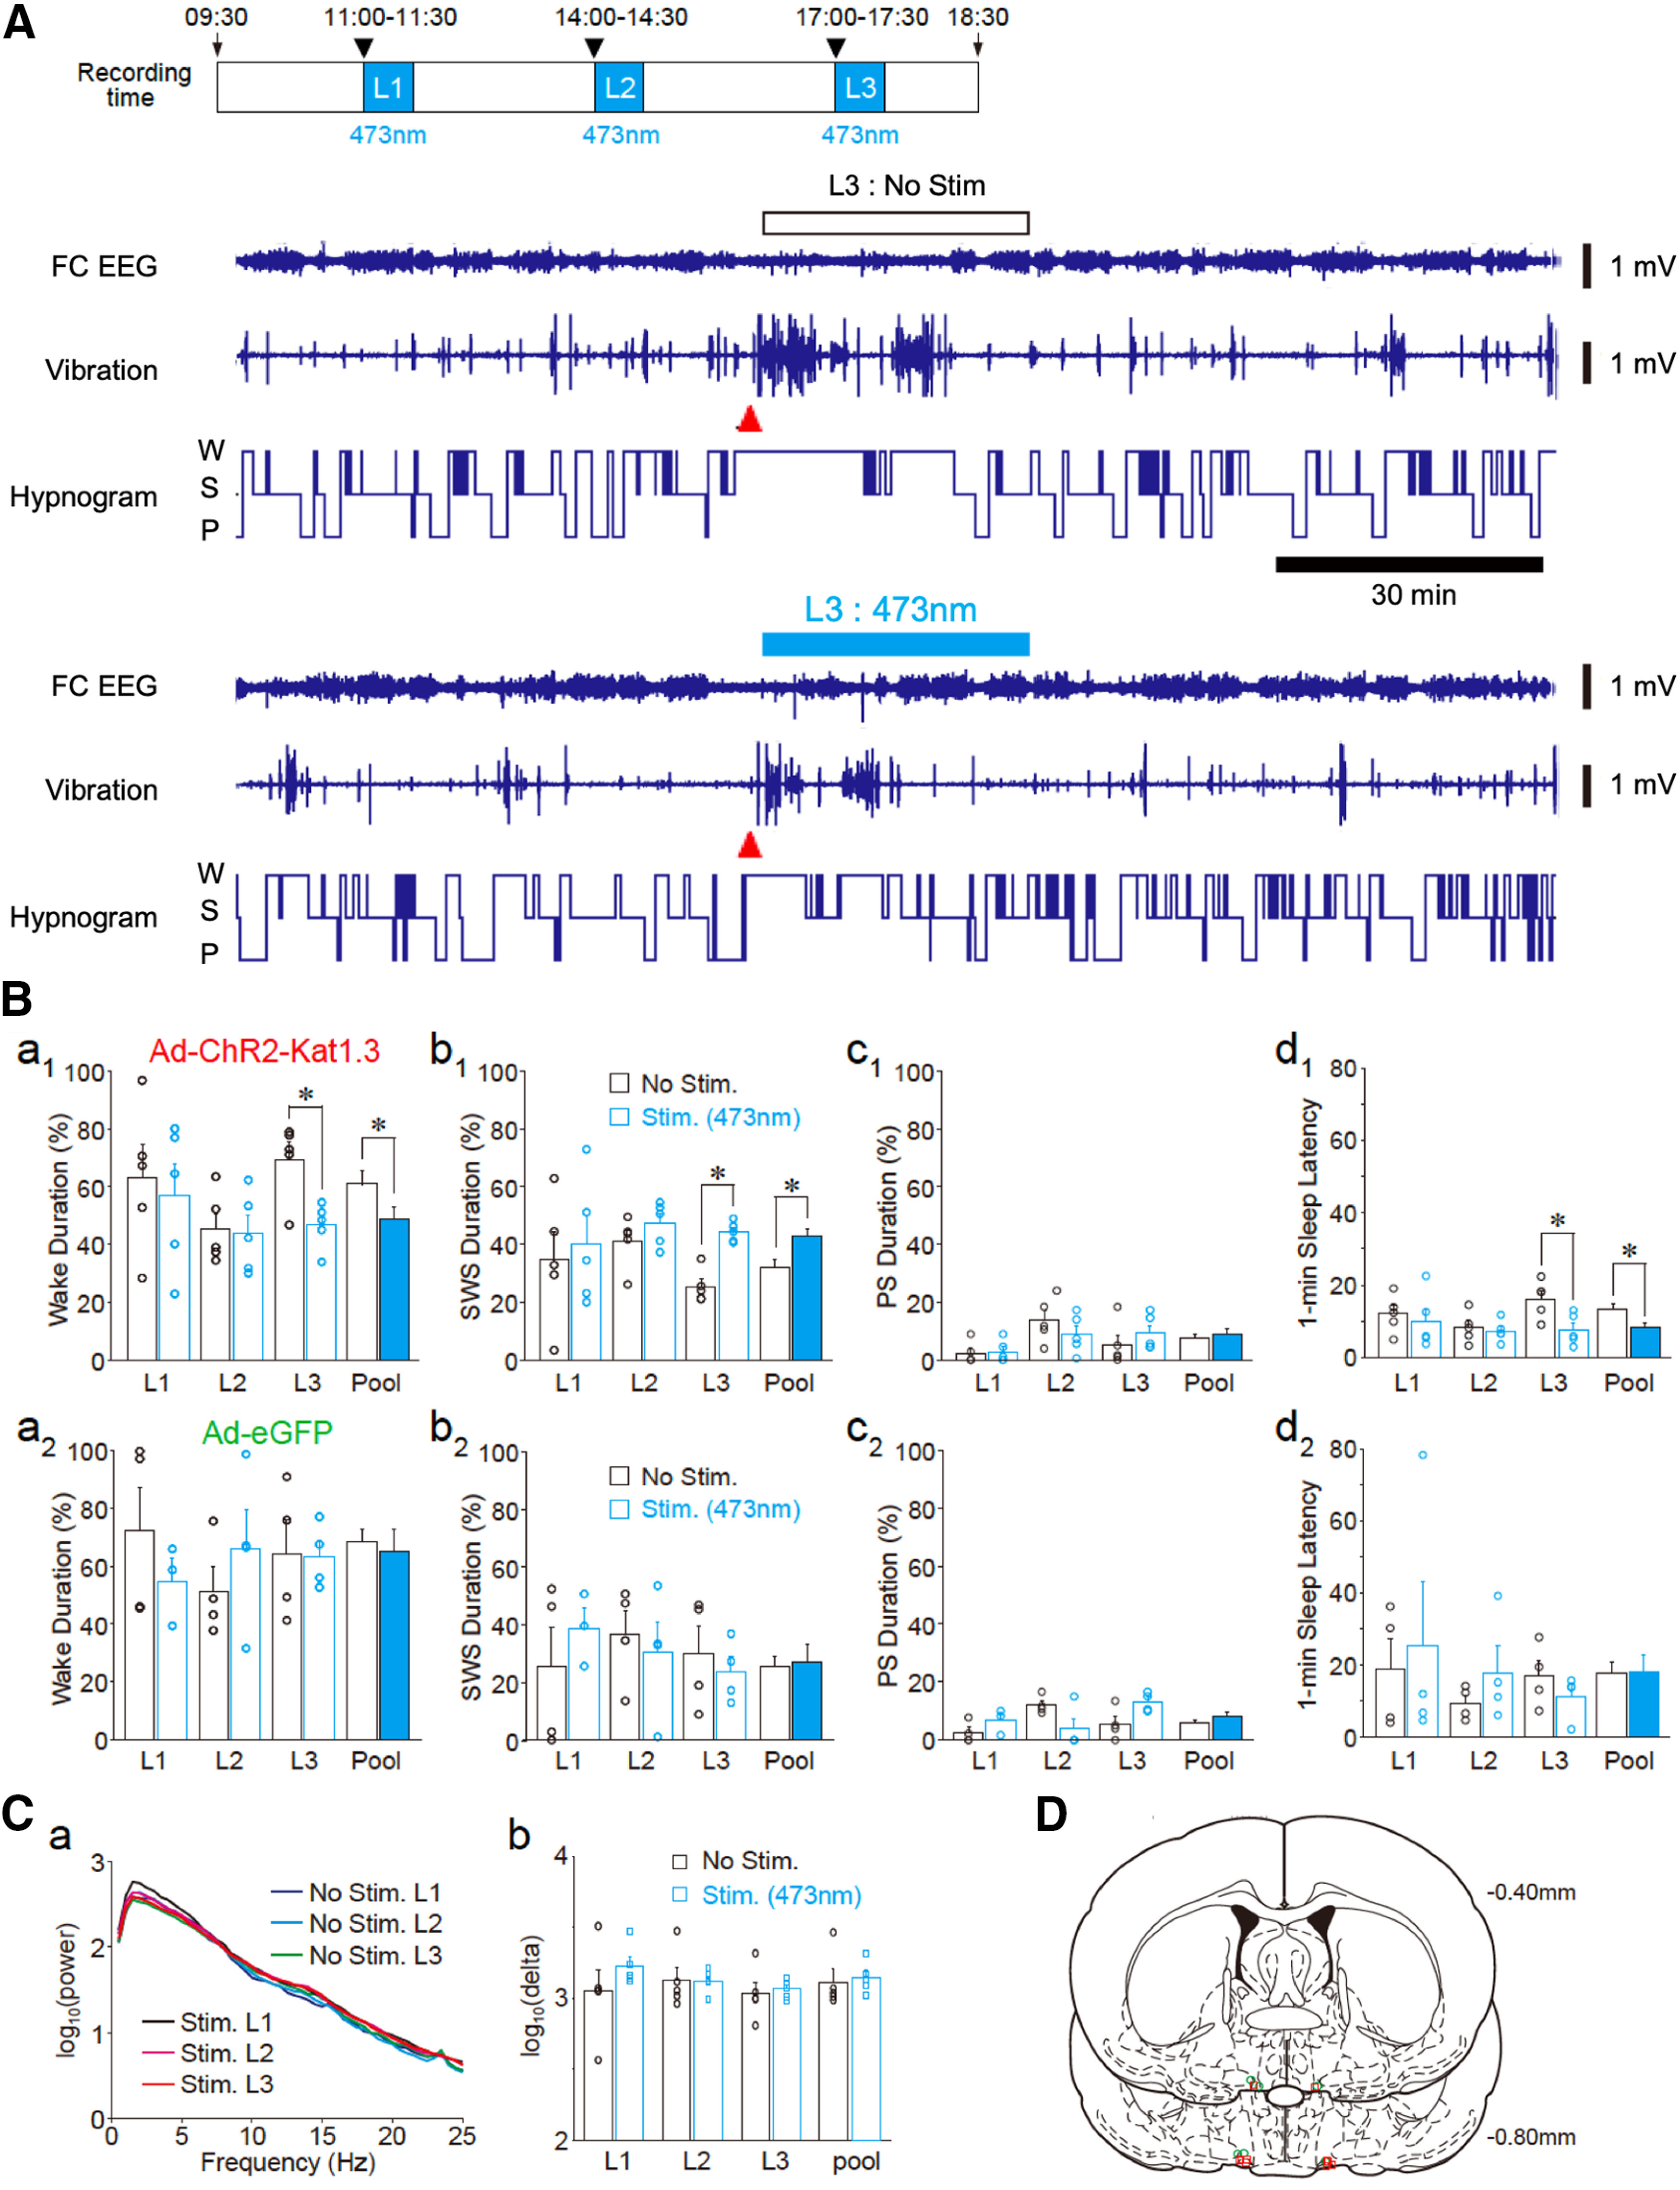
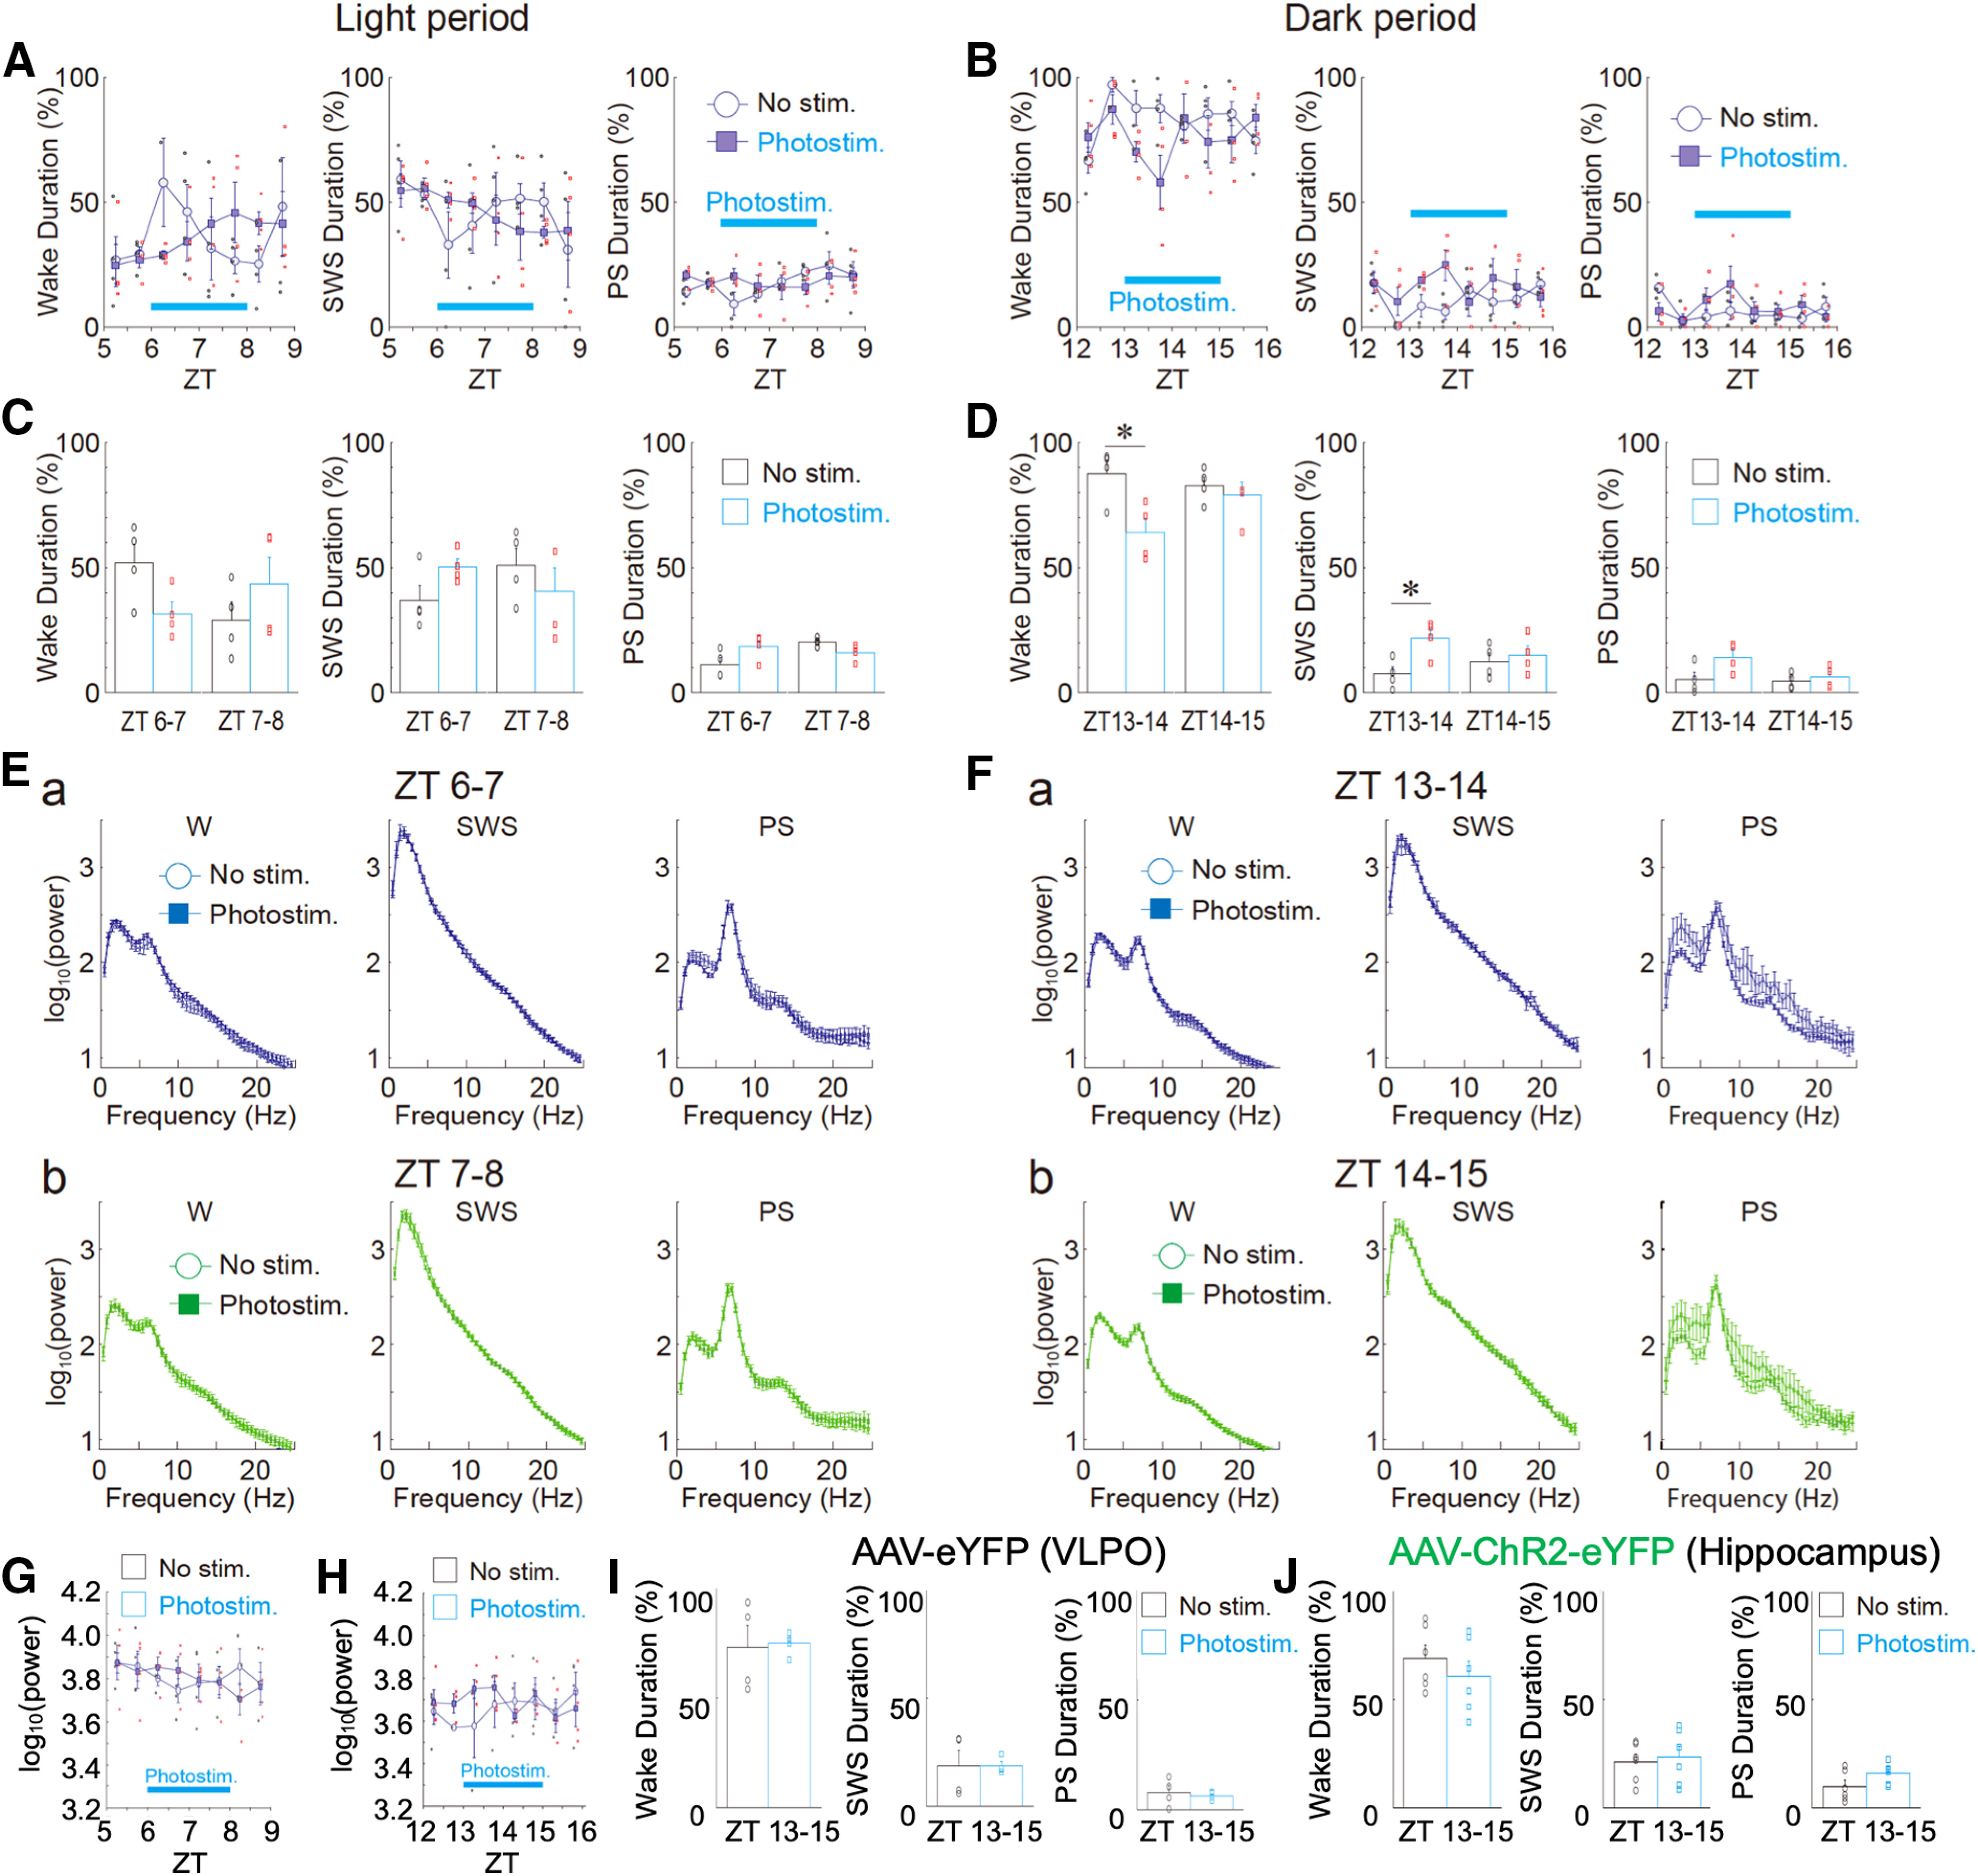
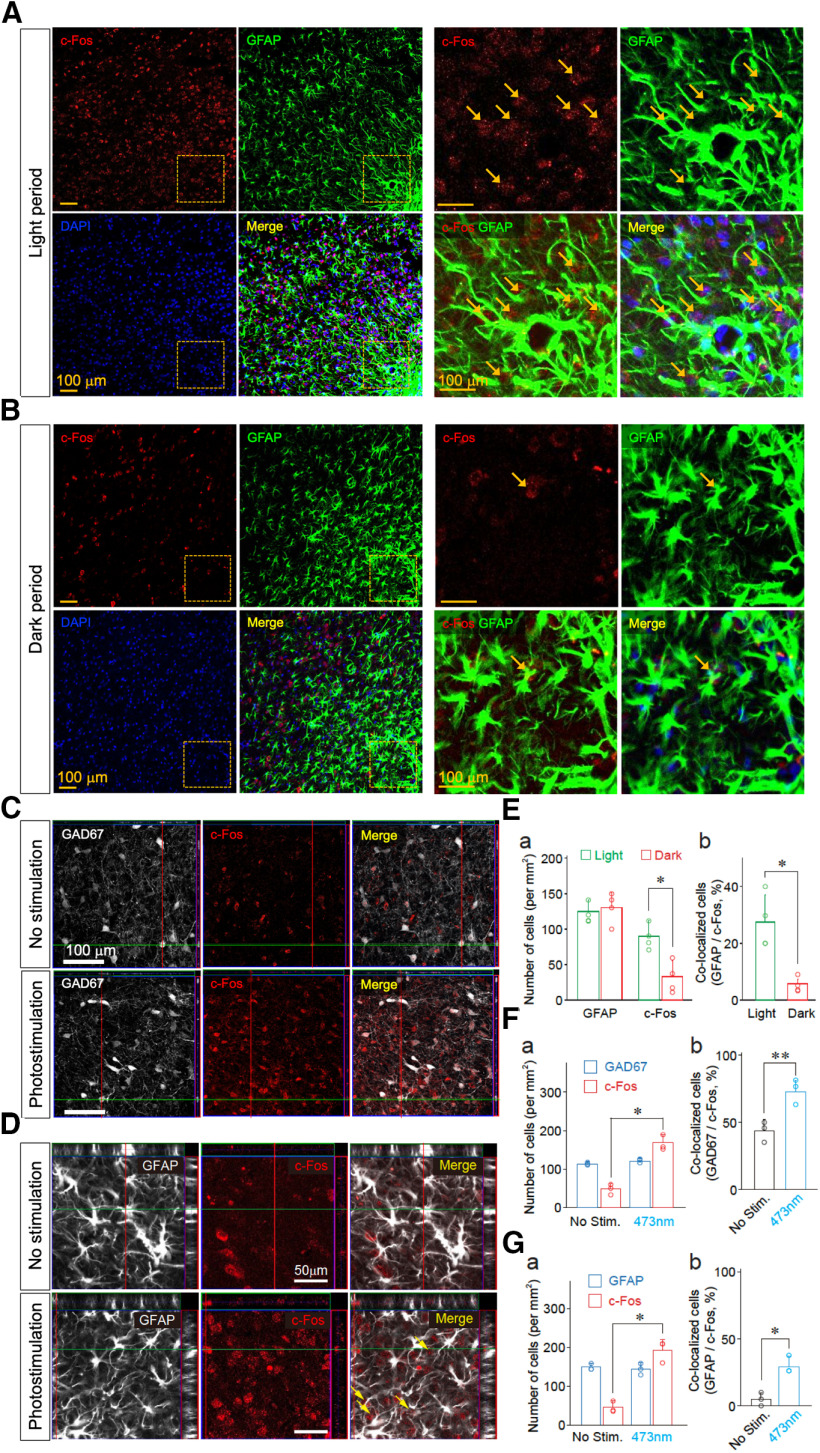
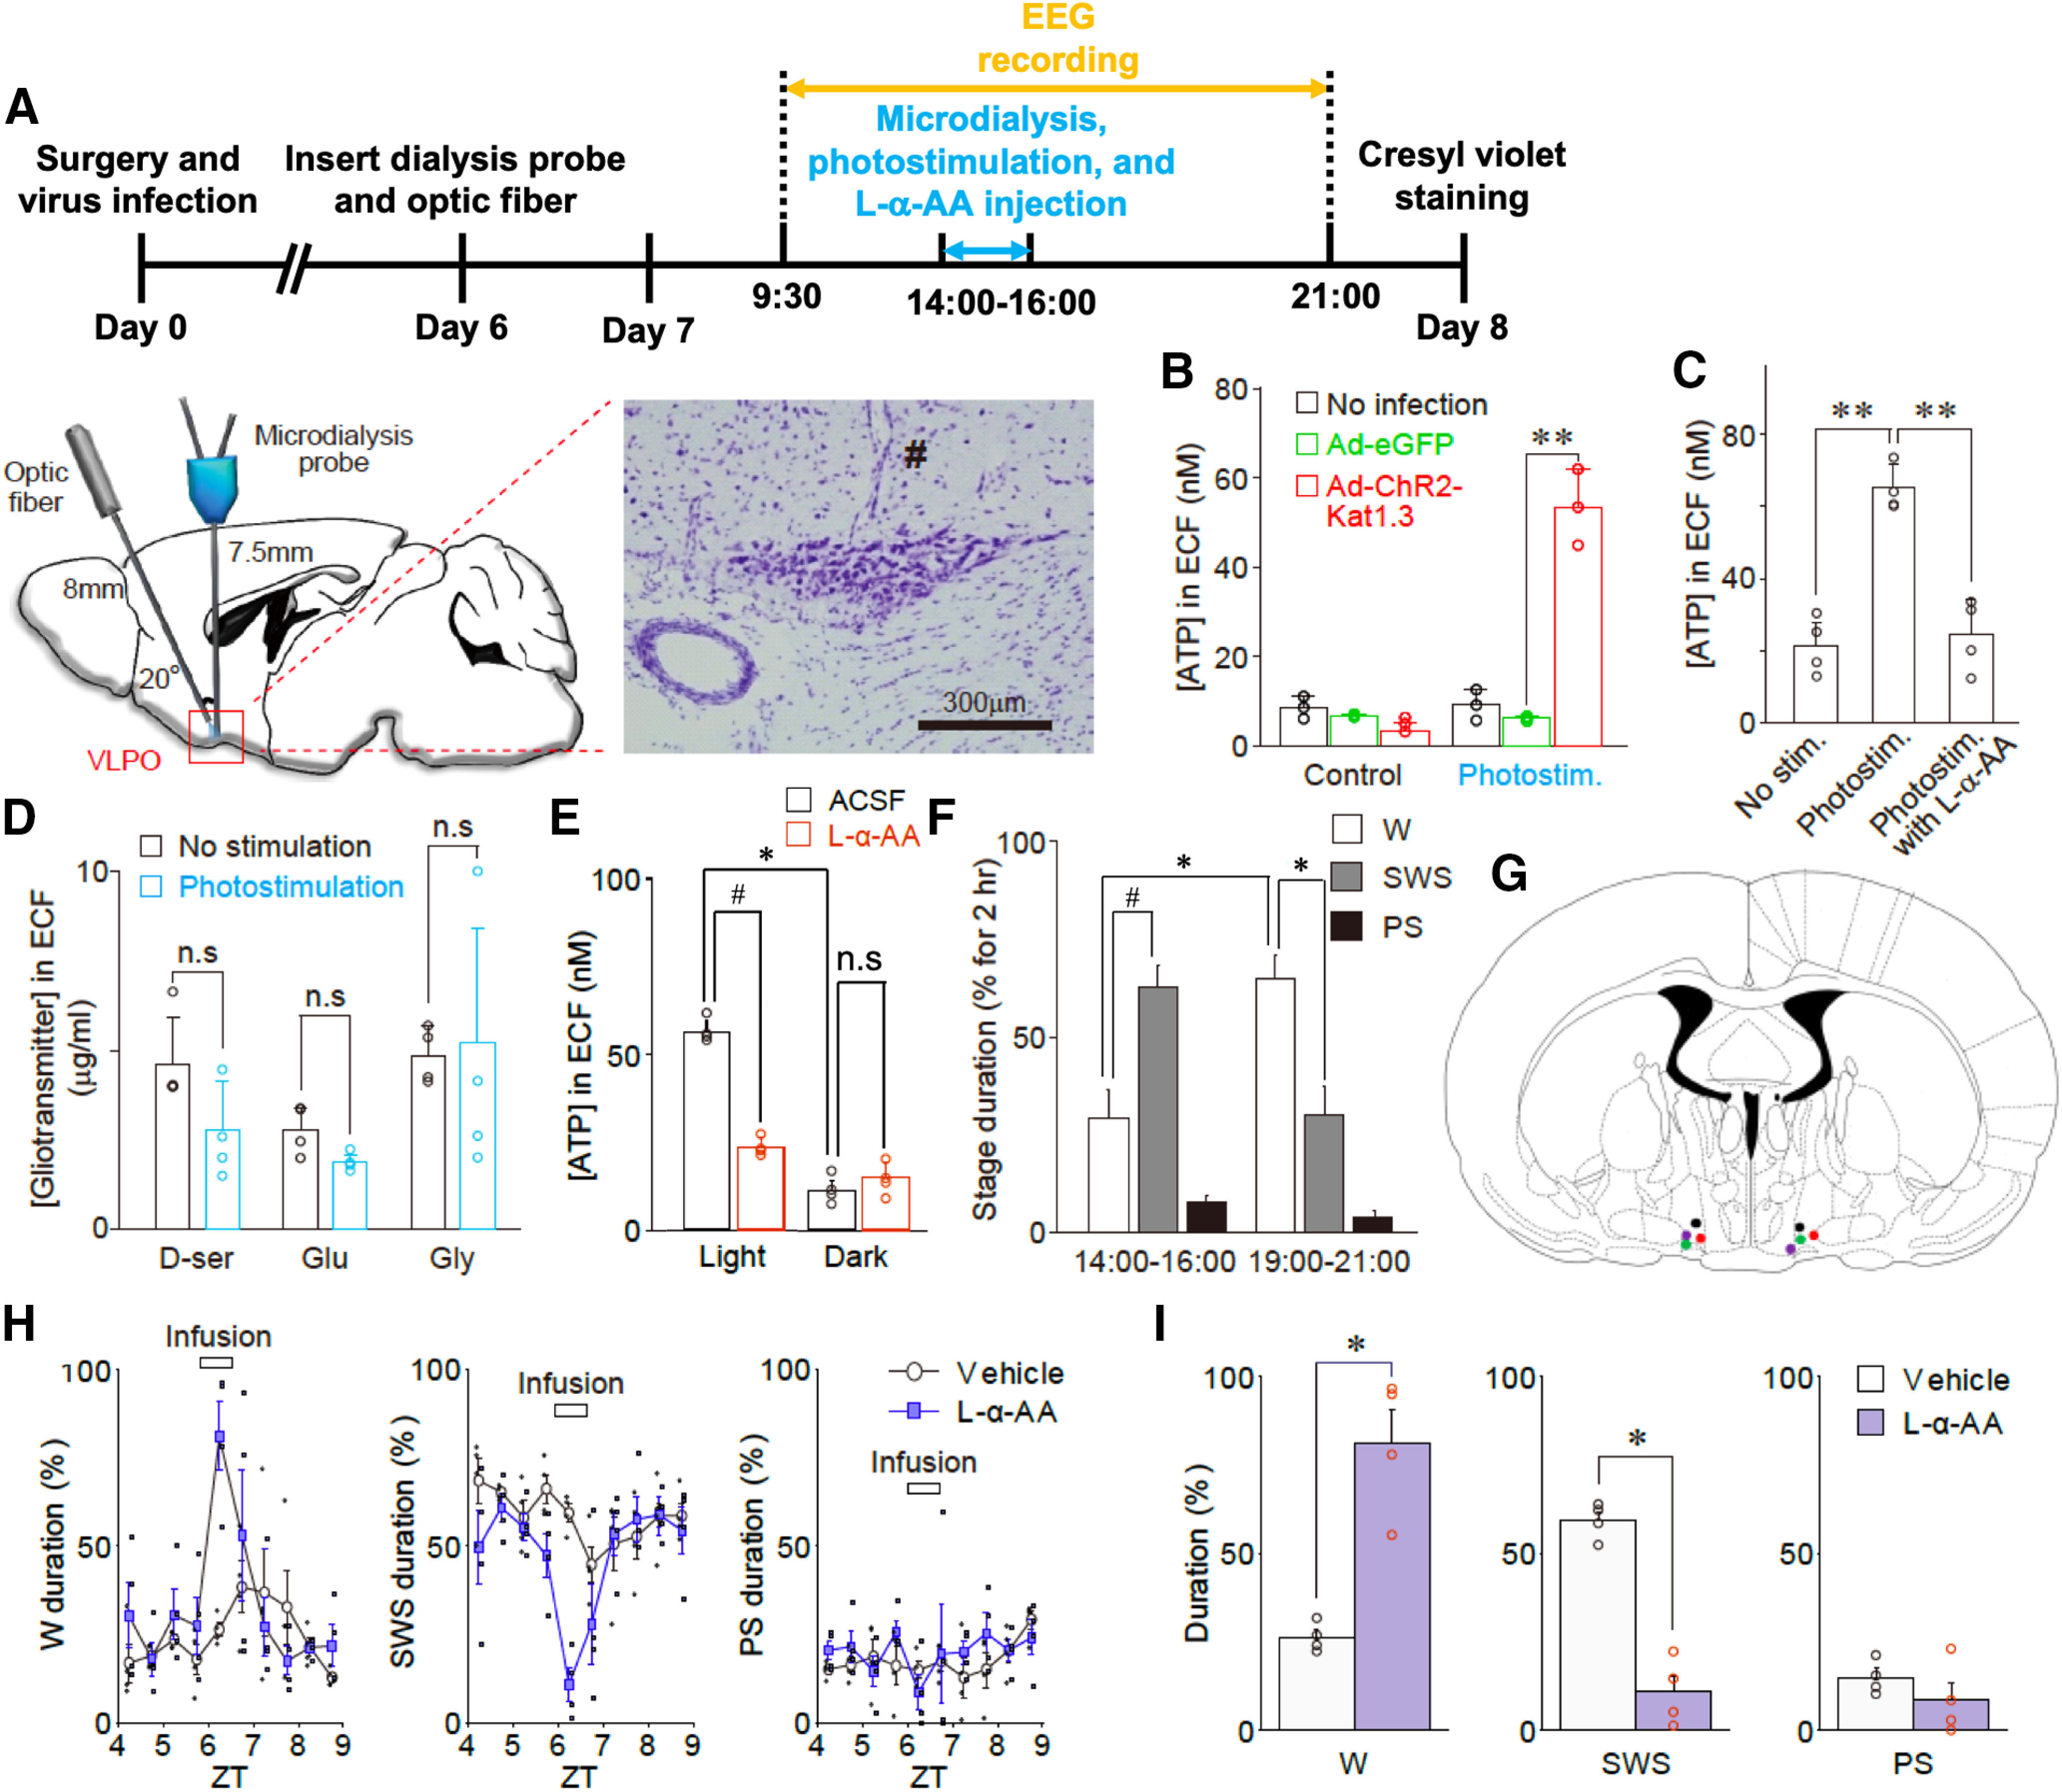
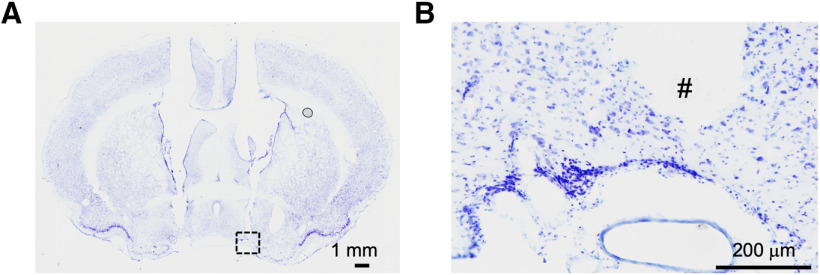
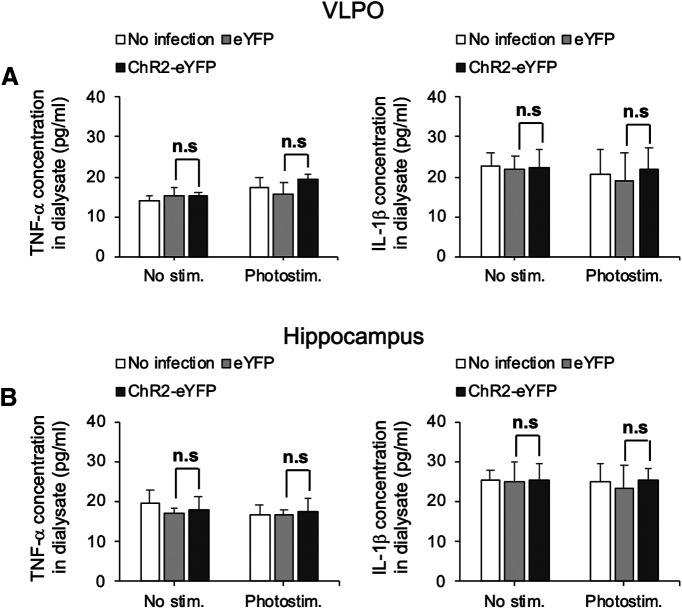
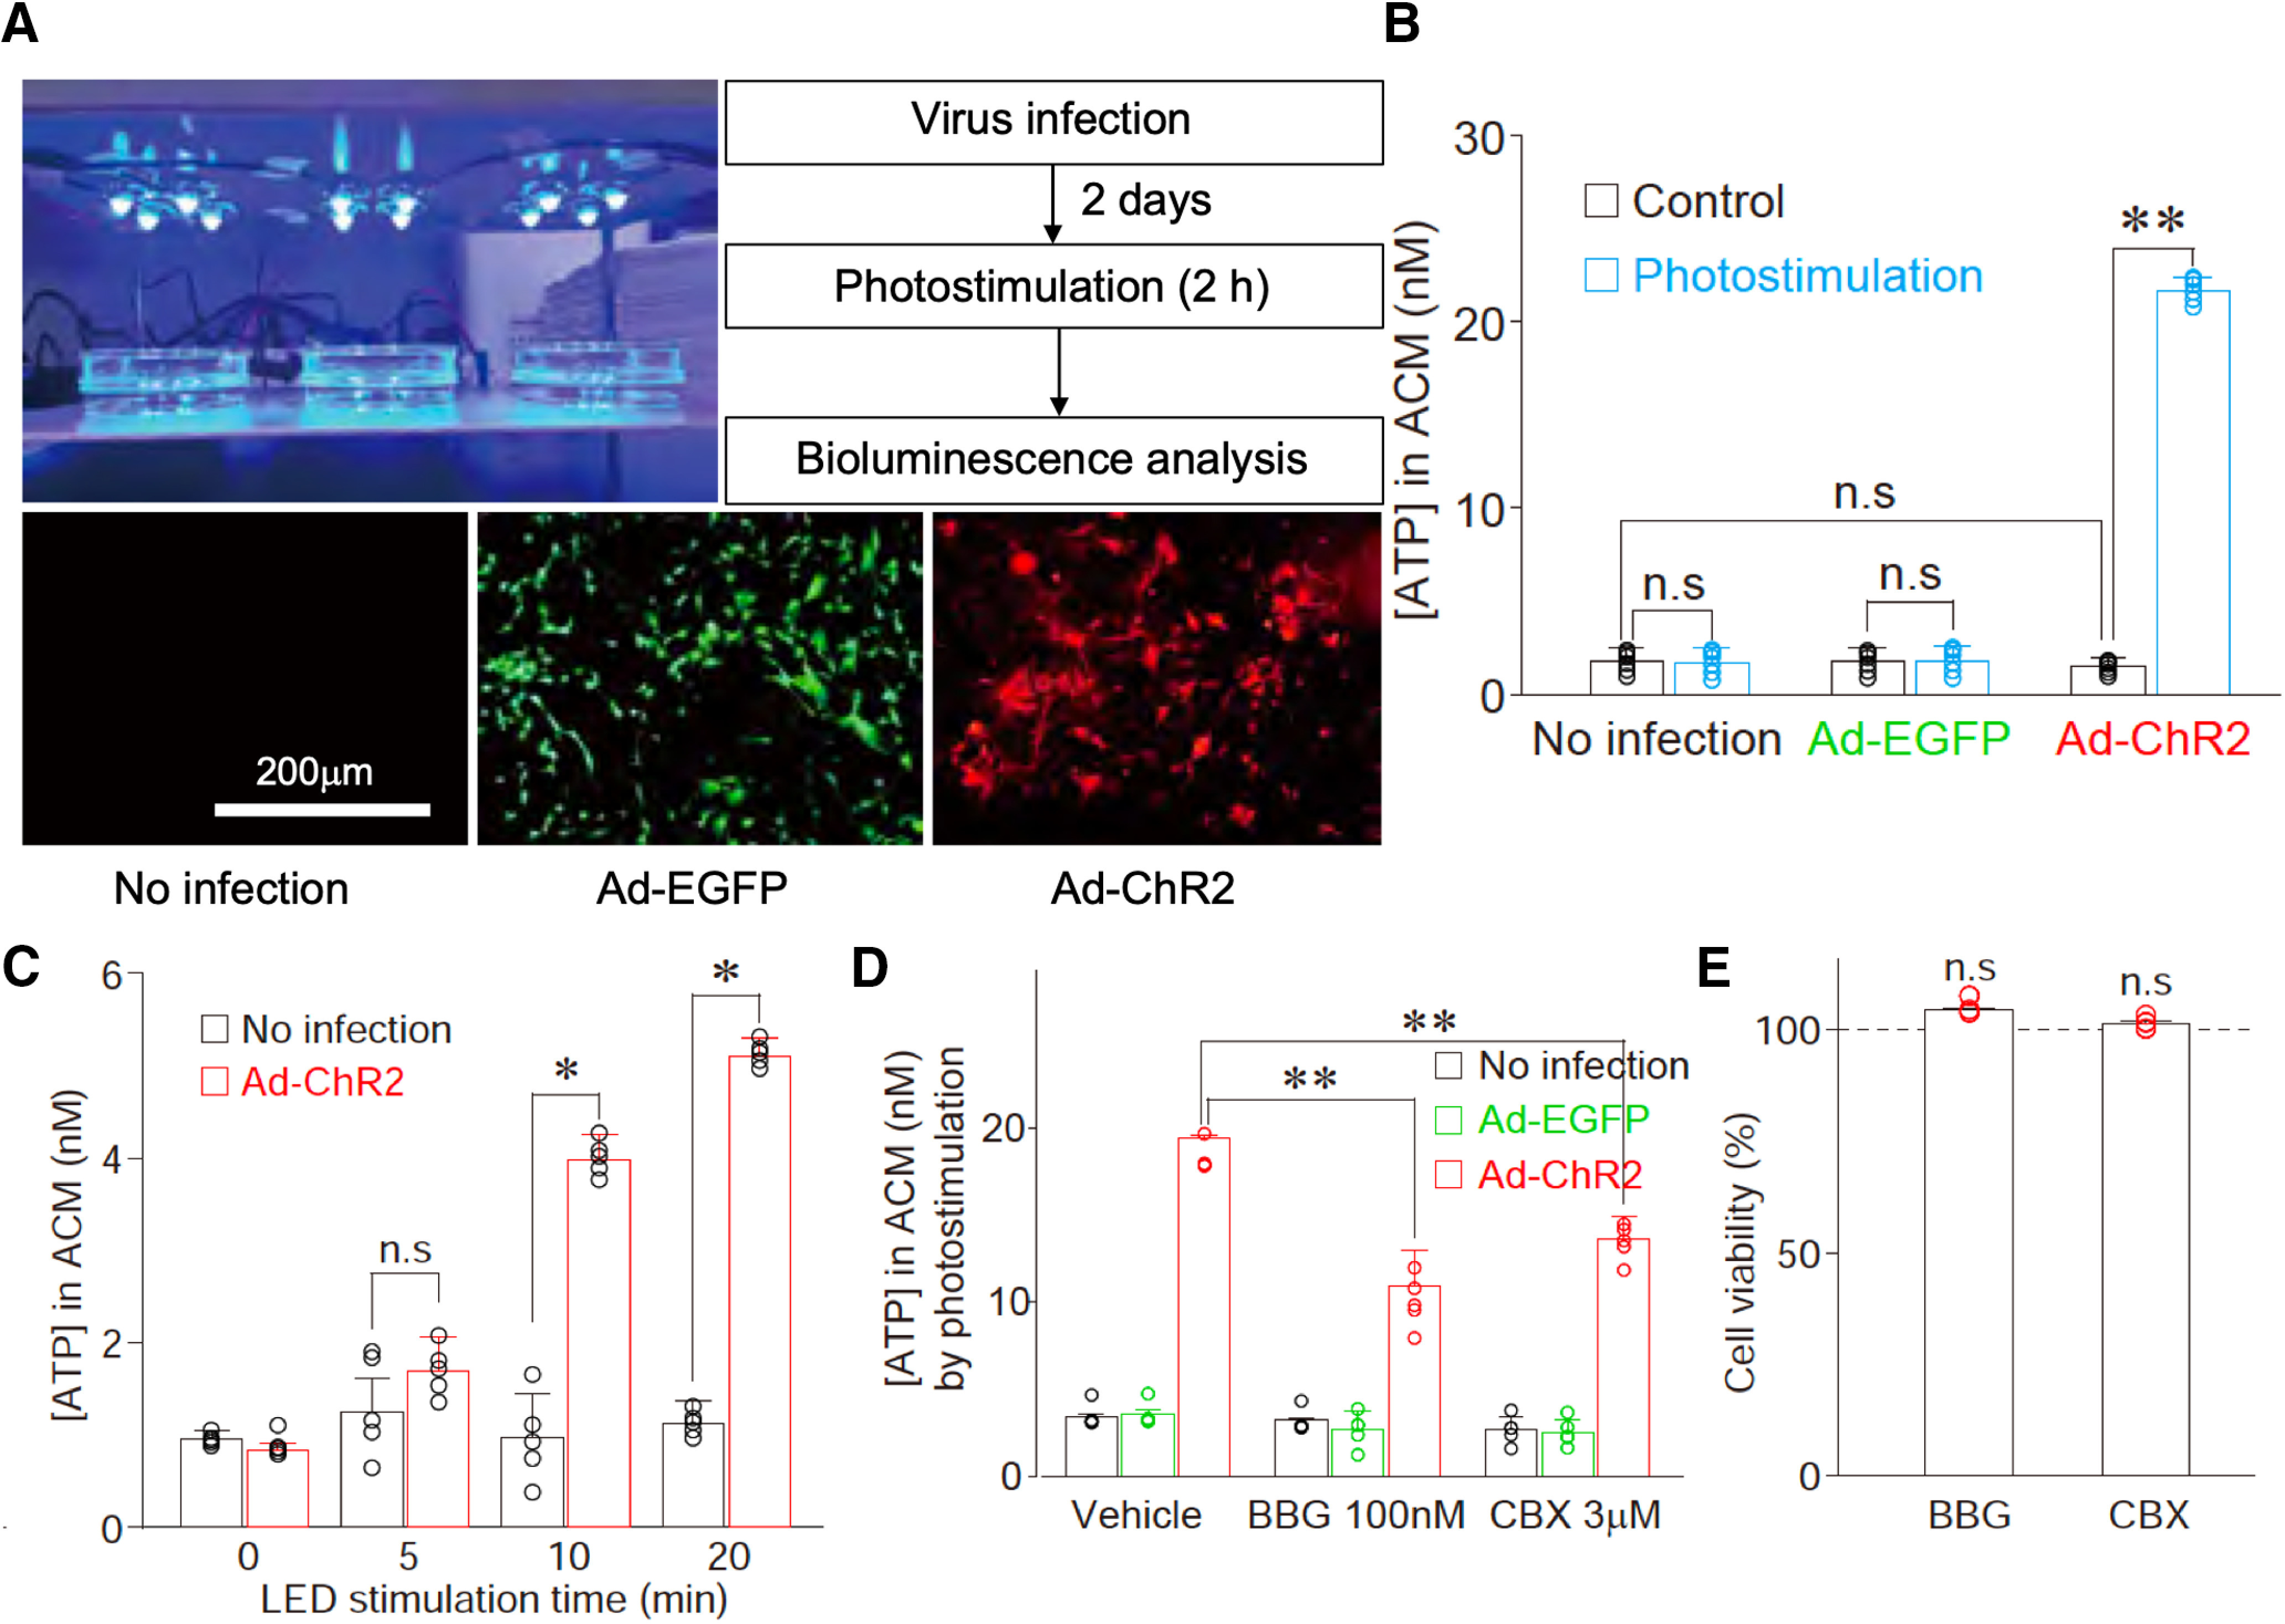
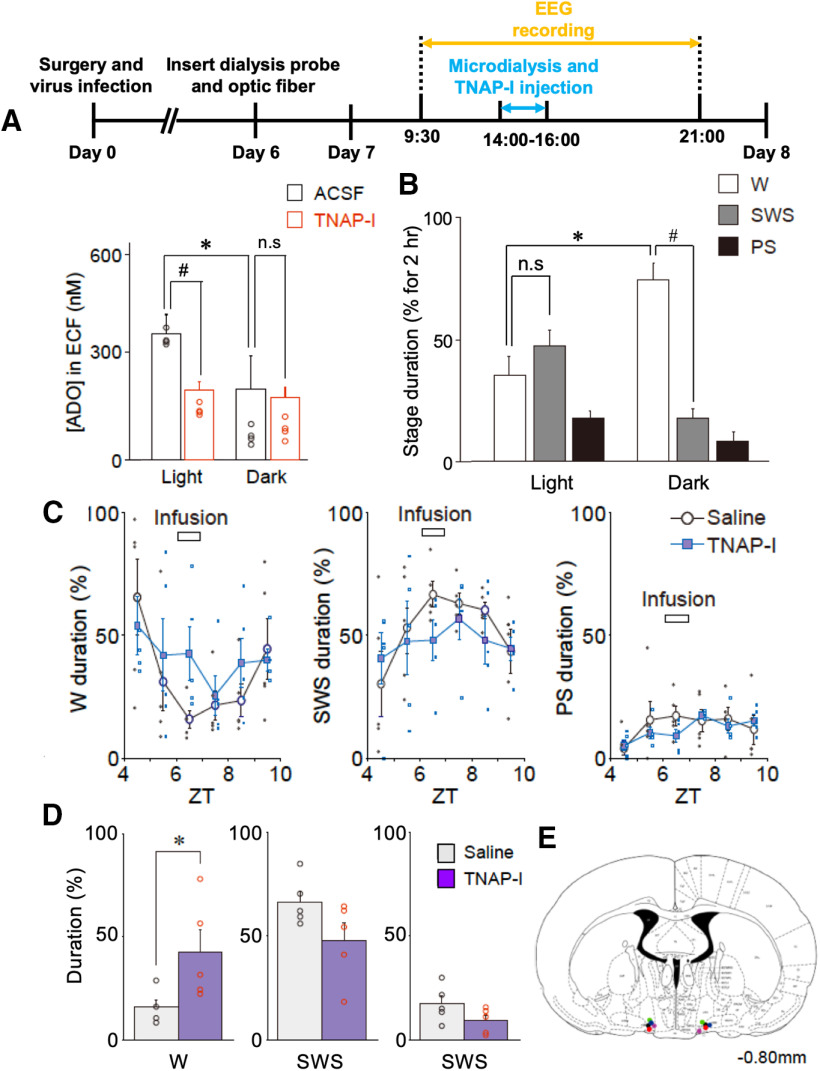
Although ventrolateral preoptic (VLPO) nucleus is regarded as a center for sleep promotion, the exact mechanisms underlying the sleep regulation are unknown. Here, we used optogenetic tools to identify the key roles of VLPO astrocytes in sleep promotion. Optogenetic stimulation of VLPO astrocytes increased sleep duration in the active phase in naturally sleep-waking adult male rats (n = 6); it also increased the extracellular ATP concentration (n = 3) and c-Fos expression (n = 3-4) in neurons within the VLPO. In vivo microdialysis analyses revealed an increase in the activity of VLPO astrocytes and ATP levels during sleep states (n = 4). Moreover, metabolic inhibition of VLPO astrocytes reduced ATP levels (n = 4) and diminished sleep duration (n = 4). We further show that tissue-nonspecific alkaline phosphatase (TNAP), an ATP-degrading enzyme, plays a key role in mediating the somnogenic effects of ATP released from astrocytes (n = 5). An appropriate sample size for all experiments was based on statistical power calculations. Our results, taken together, indicate that astrocyte-derived ATP may be hydrolyzed into adenosine by TNAP, which may in turn act on VLPO neurons to promote sleep.SIGNIFICANCE STATEMENT Glia have recently been at the forefront of neuroscience research. Emerging evidence illustrates that astrocytes, the most abundant glial cell type, are the functional determinants for fates of neurons and other glial cells in the central nervous system. In this study, we newly identified the pivotal role of hypothalamic ventrolateral preoptic (VLPO) astrocytes in the sleep regulation, and provide novel insights into the mechanisms underlying the astrocyte-mediated sleep regulation.

Keywords: astrocyte; gliotransmitters; optogenetics; sleep; ventrolateral preoptic area.


Figures

Figure 1.
Figure 1.
Functional expression of ChR2 in astrocytes. A, An illustration of the adenoviral vector containing the ChR2 construct (Ad-ChR2-Kat1.3; Ad-sGFAP-ChR2(H134R)-Katushka1.3). The expression of ChR2 is controlled by GfaABC1D, a shortened version of the GFAP promoter. mCMV operating in the antisense orientation drives the expression of a chimeric transcriptional activator Gal4p56, while the specificity of expression in both directions is determined by GfaABC1D. B, Phase contrast (Ph, left), fluorescence (middle), and superimposed (right) images of cultured astrocytes infected with Ad-ChR2-Kat1.3. C, Typical traces of membrane currents induced by different photostimulation (473 nm) intensities in cultured astrocytes (a). Photostimulation intensity-current relationship in cultured astrocytes (b). All points and error bars represent the mean and SEM from four experiments. D, Typical traces of photostimulation (473 nm)-induced membrane currents in a standard external solution (upper), a Na+-free (replaced with equimolar NMDG+) solution (0 Na+; middle), and a solution that was both Na+-free and Ca2+-free (0 Na+/Ca2+; lower; a). Changes in photostimulation-induced membrane currents for each condition (b). All columns and error bars represent the mean and SEM from five experiments. Note that the photostimulation-induced membrane currents in the Na+-free solution were significantly reduced by omission of extracellular Ca2+; *p < 0.05; paired t test; t(4) = 4.21, p = 0.0136. E, Typical fluorescence images of ChR2-expressing astrocytes displaying the Ca2+ response on photostimulation. Cultured astrocytes were infected with Ad-ChR2-Kat1.3 and loaded with Fluo-4AM. Note that photostimulation induced a profound increase in intracellular Ca2+ concentration (arrows) in the presence of 2 mm extracellular Ca2+. F, Time courses of individual (upper) and mean (lower) Fluo-4AM fluorescence intensity changes obtained from three astrocytes on photostimulation in the absence or presence of extracellular Ca2+(blue lines, 0 mm; red lines, 2 mm). Photostimulation (1.7 mW, 1 Hz, horizontal bar) was applied to Fluo-4AM-loaded astrocytes. Fluorescence intensities were measured using Zeiss ZEN Microscope software and are expressed as the ratio of (F – F0)/F0, where F0 is the base level fluorescence intensity in cell bodies before any treatment. All measurements were corrected for background fluorescence. Increases in the fluorescence ratio that were >0.1 were considered to be significant changes; basal level fluorescence values exhibited a peak (F – F0)/F0 ratio of 0.01 ± 0.01 on average. The results are representative of three experiments. G, An illustration of the adeno-associated viral vector containing the ChR2 construct (AAV-ChR2-eYFP; AAV-GFAP-hChR2(H134R)-eYFP). The expression of ChR2 is controlled by GfaABC1D, a shortened version of the GFAP promoter. H, Typical fluorescence images of AAV-ChR2-eYFP-expressing astrocytes displaying a Ca2+ response on photostimulation. Cultured astrocytes were infected with AAV-ChR2-eYFP and loaded with rhodamine 2. Note that photostimulation induced a profound increase in intracellular Ca2+ concentration (arrows) in the presence of 2 mm extracellular Ca2+. I, Changes in individual (upper) and mean (lower) rhodamine 2 fluorescence intensities obtained from six astrocytes on photostimulation in the absence or presence of extracellular Ca2+ (blue lines, 0 mm; red lines, 2 mm). Photostimulation (1.7 mW, 1 Hz, horizontal bar) was applied to rhodamine 2-loaded astrocytes. The results are representative of three experiments. J, Fluorescence images displaying AAV-ChR2-eYFP expression in the VLPO area. The VLPO regions in the brain slices were subjected to immunofluorescence analysis to identify AAV-ChR2-eYFP (green) expression in astrocytes (GFAP, red), which was confirmed by reconstructed Z-section images (bottom panels, high-power images). Arrows indicate the co-localization of AAV-ChR2-eYFP and GFAP. ChR2 expression (green) was not co-localized with either Iba-1 or NeuN. Dotted lines indicate the VLPO (core and extended region) and optic chiasm (OX) areas. The results are representative of six experiments. K, Quantification of AAV-ChR2-eYFP-positive and GFAP-positive cells around the VLPO region. Shown are the number of cells (a) and their co-localization (b). Each column and error bar represents the mean and SD from three experiments.
Figure 2.
Figure 2.
A representative low-magnification image showing the localization of AAV-ChR2-eYFP in VLPO region.
Figure 3.
Figure 3.
Expression of ChR2 in astrocytes in the VLPO area following AAV-mediated gene transfer. A, B, The VLPO regions of rat brains infected with AAV-ChR2-eYFP were subjected to immunofluorescence analysis to evaluate ChR2 (green) expression in microglia (A, Iba-1, red) and neurons (B, NeuN, red). These results were confirmed by reconstructed Z-section images. Nuclei were stained with DAPI (blue). Images are representative of three independent experiments. C, D, Quantification of Iba-1, NeuN, or AAV-ChR2-eYFP-positive cells around the VLPO region. Shown are the number of cells (a) and their co-localization (b). Each column and error bar represents the mean and SD from three experiments; n.d., not detected. Note that neither Iba-1 nor NeuN was co-localized with AAV-ChR2-eYFP.
Figure 4.
Figure 4.
Optogenetic stimulation of the VLPO astrocytes promotes sleep when rats are in a waking state. A, Timeline of experiments (top). Visual representation of the cannula placement site used to stimulate VLPO astrocytes and the quantification of the ChR2-Kat1.3 expression profile in the VLPO area. Ad-ChR2-Kat1.3 was delivered to the VLPO area using a guide cannula. The expression of ChR2 fused to Katushka1.3 was confirmed by fluorescence (red) detected in serial coronal sections of the brain. The VLPO area corresponds to the position 0.3–0.9 mm posterior to bregma (red columns). The graph shows the quantification of ChR2 expression in the serial sections. Representative fluorescence images are also shown in the lower panel. Expression of Ad-ChR2-Kat1.3 was confirmed in 15 animals, among which four animals were subjected to serial brain sectioning and fluorescence analysis. B, Fluorescence images of the VLPO region. Note that Ad-ChR2-Kat1.3 (red) is co-localized with GFAP (green). Dotted lines indicate the areas of the VLPO region (core and extended region), supraoptic nucleus (SON), and optic chiasm (OX). The results are representative of six experiments. Arrows in the magnified images (lower row) indicate co-localization of Ad-ChR2-Kat1.3 and GFAP. C, Quantification of cells positive for Ad-ChR2-Kat1.3 and GFAP around the VLPO region. Shown are the number of cells (a) and their co-localization (b). Each column and error bar represents the mean and SD from six experiments. D, Representative traces of a frontal cortex EEG (FC EEG), motor activity-related vibration, and a hypnogram before and during (Lb) photostimulation. W, wake; S, SWS; and P, PS. E, Effects of photostimulation during the 12:30 P.M. to 2:30 P.M. (La) period. The duration of sleep-wake states (a) in the stimulation group (Stim, n = 7) was similar to that of the control group (No Stim, n = 6). The δ power during SWS was not affected by photostimulation (b); Each column and error bar represents the mean and SD from 6-7 experiments; n.s., not significant; unpaired t test. F, Effects of photostimulation during the 3:30 to 5:30 P.M. (Lb) period. The duration of sleep (a) in the stimulation group (Stim, n = 6) was increased relative to that in the control group (No Stim, n = 4). The δ power during SWS was not affected by photostimulation (b); Each column and error bar represents the mean and SD from 4-6 experiments; *p < 0.05; n.s., not significant; unpaired t test; Wake, t(8) = 2.62, p = 0.0305; SWS, t(8) = 2.37, p = 0.0446; PS, t(8) = 2.37, p = 0.0453.
Figure 5.
Figure 5.
A representative low-magnification image showing the localization of Ad-ChR2-Kat1.3 in VLPO region.
Figure 6.
Figure 6.
Expression of ChR2 in astrocytes in the VLPO area following Ad-mediated gene transfer. A, Astrocytic expression of Ad-ChR2 (Ad-ChR2-Kat1.3) was confirmed by co-localization of GFAP (green) staining and ChR2-Kat1.3 (red) expression in the VLPO area. Asterisks indicate the virus injection sites. ChR2-Kat1.3 (red) was found in the membrane of GFAP-positive astrocytes (green), which was confirmed by reconstructed Z-section images. Nuclei were stained with DAPI (blue). The results are representative of five experiments. B, C, Brain sections containing the VLPO region were subjected to immunofluorescence analysis to assess the expression of ChR2 in microglia or neurons. ChR2 expression (red) was not co-localized with either Iba-1 (B, green, a microglial marker) or NeuN (C, green, a neuronal marker). Nuclei were stained with DAPI (blue). The results are representative of five experiments. D, E, Quantification of cells positive for Iba-1, NeuN, or ChR2-Kat1.3 around the VLPO region. Shown are the number of cells (a) and their co-localization (b). Each column and error bar represents the mean and SD from five experiments; n.d., not detected.
Figure 7.
Figure 7.
Time-dependent effects of photostimulation on sleep promotion. A, Three photostimulation (473 nm, 1 Hz, 500 ms in duration for 30 min) sessions were conducted at 11 to 11:30 A.M. (L1), 2 to 2:30 P.M. (L2), and 5 to 5:30 P.M. (L3) after the awakening (indicated by arrowheads) of rats (top). Representative traces of the frontal cortex EEG (FC EEG), motor activity-related vibration, and hypnograms (bottom). The recording session included a photostimulation period for 30 min (L3, blue bar). At the start of each photostimulation, rats were awakened by cage tilting (arrowheads). W, wake; S, SWS; and P, PS. B, Photostimulation-induced changes in the duration of wake (a1), SWS (b1), PS (c1), and sleep latency (d1) in rats with Ad-ChR2 (Ad-ChR2-Kat1.3) expression in the VLPO area (n = 5). Note that photostimulation changed sleep parameters in comparison to those observed in control animals (No Stim, white columns, n = 5) for the L3, but not for the L1 or L2, period. The averaged data for three sessions (pool) are also shown; *p < 0.05; unpaired t test; wake duration, L3, t(8) = 3.33, p = 0.0103, pool, t(8) = 2.48, p = 0.0378; SWS duration, L3, t(8) = 6.30, p = 0.0002, pool, t(8) = 2.75, p = 0.0249; sleep latency, L3, t(8) = 0.0104, pool, t(8) = 2.675, p = 0.0140. In rats with Ad-eGFP expression in the VLPO area (n = 4, a2–d2), photostimulation (blue columns) did not affect the sleep-wake parameters relative to those of animals that were not photostimulated (n = 4). C, EEG power spectra (a) and δ (0.5–2.5 Hz) power (b) during SWS. Power spectra and δ power were not significantly different among the three sessions regardless of whether they were stimulated or not. All data represent the mean and SEM from five experiments. D, Tip locations of the optic cannula in the VLPO area of Ad-ChR2-Kat1.3-injected rats (red squares) and Ad-eGFP-injected rats (green circles) are shown on coronal sections modified from the rat brain atlas.
Figure 8.
Figure 8.
Effects of photostimulation on sleep-wake states and EEG power in light and dark phases. A, B, Changes in the duration of sleep-wake states (wake, SWS, and PS) every 30 min during light [A, zeitgeber time (ZT)5–ZT9] and dark (B, ZT12–ZT16) phases. In these experiments, AAV-ChR2-eYFP was delivered to the VLPO region. Photostimulation was applied to the VLPO region for 120 min (blue bar). Each point and error bar represents the mean and SEM from four experiments. C, D, Photostimulation-induced changes in the duration of sleep-wake states during light (C) and dark (D) phases. Each column and error bar represents the mean and SEM during the first 60 min and the last 60 min of photostimulation. Note that in the first 60 min, but not the last 60 min, photostimulation significantly decreased the wake duration and increased the SWS duration during the dark phase (n = 4, D); *p < 0.05; unpaired t test; wake duration, ZT13–ZT14, t(6) = 3.02, p = 0.0116; SWS duration, ZT13–ZT14, t(6) = 3.18, p = 0.0095. In contrast, sleep-wake states were not significantly affected by photostimulation during the light phase (n = 4, C). E, F, Photostimulation-induced EEG power spectra in sleep-wake states [wake (W), SWS, and PS] during light (E) and dark (F) phases. Note that there was no significant difference in the power spectra between the unstimulated (No Stim) and photostimulated (Photostim) groups. G, H, Changes in δ power in the SWS state every 30 min during light (G) and dark (H) phases. Note that there was no significant difference between the two groups. Each point and error bar represents the mean and SEM from four experiments. I, Effects of photostimulation on the duration of sleep-wake states (wake, SWS, and PS) during the dark phase. The same photostimulation as that shown in B was applied to the VLPO region, but a control virus without ChR2 (AAV-eYFP) was delivered to the VLPO. Each column and error bar represents the mean and SEM from four experiments. J, Effects of photostimulation on the duration of sleep-wake states (wake, SWS, and PS) during the dark phase. The same 120-min photostimulation period shown in B was applied to the hippocampal region, but AAV-ChR2-eYFP was delivered to the hippocampal CA1 region. Each column and error bar represents the mean and SEM from six experiments. Note that photostimulation of ChR2-expressing astrocytes within the hippocampal region had no influence on sleep-wake states.
Figure 9.
Figure 9.
The activity of VLPO astrocytes is increased during sleep states. A, B, c-Fos expression in the VLPO astrocytes during the light (sleep; A) and dark (wake; B) periods. Confocal images of c-Fos (red) and GFAP immunoreactivity (green) in the VLPO region. Frozen sections of brain were prepared from animals in sleep (light period: 2–4 P.M.) and wake (dark period: 7–9 P.M.) states. Colocalizations of c-Fos (red) and GFAP immunoreactivity (green) in the VLPO region are indicated by arrows. Cell nuclei were stained with DAPI to confirm the nuclear expression of c-Fos. C, D, Increased c-Fos immunoreactivity in GABAergic neurons and astrocytes within the VLPO region following optogenetic stimulation. Rats were injected with AAV-ChR2-eYFP (n = 3). Frozen sections of brains were prepared 60 min after the animals received photostimulation. Neuronal and astrocytic expression of c-Fos in the VLPO area was identified using anti-GAD67 (C) and anti-GFAP (D) antibodies, respectively, in conjunction with anti-c-Fos antibodies. Cell nuclei were stained with DAPI to confirm the nuclear expression of c-Fos. GAD67-double positive and c-Fos-double positive cells or GFAP-double positive and c-Fos-double positive cells are indicated by arrows. E, Quantification of immunopositive cells for GFAP and c-Fos (a) and their co-localization (b). Frozen sections of brain were prepared from animals in sleep (light period: 2–4 P.M.) and wake (dark period: 7–9 P.M.) states. Astrocytic expression of c-Fos in the VLPO region was identified using an anti-GFAP antibody. Each column and error bar represents the mean and SD from four experiments; *p < 0.05; unpaired t test; c-Fos positive cells, t(6) = 2.53, p = 0.0223; co-localized cells, t(6) = 2.98, p = 0.0122. F, Quantification of GAD67 and c-Fos immunoreactive cells (a) and their co-localization (b). Rats were injected with AAV-ChR2-eYFP (n = 3). Frozen sections of brain were prepared 60 min after animals received photostimulation. Neuronal expression of c-Fos in the VLPO region was identified using an anti-GAD67 antibody. Each column and error bar represents the mean and SD from three experiments; *p < 0.05; **p < 0.01; unpaired t test; c-Fos-positive cells, t(4) = 2.84, p = 0.0233; co-localized cells, t(4) = 3.765, p = 0.0098. G, Quantification of immunopositive cells for GFAP and c-Fos (a) and their co-localization (b). Rats were injected with AAV-ChR2-eYFP (n = 3). Frozen sections of brain were prepared 60 min after the animals received photostimulation. Astrocytic expression of c-Fos in the VLPO region was identified using an anti-GFAP antibody. Each column and error bar represents the mean and SD from three experiments; *p < 0.05; unpaired t test; c-Fos-positive cells, t(4) = 2.96, p = 0.0206; co-localized cells, t(4) = 3.54, p = 0.0119.
Figure 10.
Figure 10.
Astocytes release ATP during optogenetic stimulation in vivo. A, Experimental timeline (top) and schematic illustration of microdialysis of the ECFs in the VLPO region during photostimulation (bottom). The microdialysis site was validated by cresyl violet staining at the end of the experiment (right panel); # represents the insertion site of the microdialysis probe. The results are representative of nine experiments. B, The ATP concentration in the dialysate (ECF) before and after photostimulation (120 min). The ATP concentration was measured using a bioluminescence assay. Open circles represent the individual results (n = 3), whereas columns and error bars represent the mean and SD from three experiments; **p < 0.01; unpaired t test; t(4) = 9.77, p = 0.0006. C, Microdialysis was performed at a flow rate of 0.5 ml/min with or without photostimulation of the VLPO region for 120 min in the presence or absence of L-α-AA (10 nm, a metabolic inhibitor of astrocytes). L-α-AA (3 μl) was microinjected into the VLPO region 10 min before photostimulation. The concentration of ATP in the VLPO dialysate (ECF) was measured using a bioluminescence assay. Each column and error bar represents the mean and SD from four experiments; **p < 0.01; one-way ANOVA; F(2,9) = 40.32, p = 0.0001. D, Photostimulation (120 min)-induced changes in D-serine, glutamate, and glycine levels in microdialysates obtained from the VLPO region. Animals were injected with AAV-ChR2-eYFP. The concentrations of D-serine, glutamate, and glycine were determined using an amino acid analyzer; Each column and error bar represents the mean and SD from 4 experiments; n.s., not significant; unpaired t test. E, The concentration of ATP in the VLPO dialysate collected during the light (2–4 P.M.) or dark (7–9 P.M.) period in the presence or absence of L-α-AA (10 nm) was measured by a bioluminescence assay. Each column and error bar represents the mean and SD from four experiments; n.s., not significant; *p < 0.05, paired t test, t(3) = 19.79, p = 0.0003; #p < 0.05, paired t test, t(3) = 10.79, p = 0.0017. F, The percentage of wake (W), SWS, and PS in the representative wake (dark: 7–9 P.M.) or sleep (light: 2–4 P.M.) period; Each column and error bar represents the mean and SEM from four experiments; *p < 0.05, paired t test, wake duration, t(3) = 5.01, p = 0.0153; SWS duration, t(3) = 9.43, p = 0.0025; #p < 0.05, paired t test, t(3) = 5.53, p = 0.0116. G, A representative image showing each microinjection site of L-α-AA as indicated on the coronal section drawing modified from the rat brain atlas. H, Changes in the duration of the sleep-wake states [wake (W), SWS, and PS] at 30-min intervals before, during, and after treatment with saline or L-α-AA (horizontal bar). Saline or L-α-AA (3 μl, 10 nm) was directly microinjected into the VLPO region for 30 min at a rate of 0.1 μl/min. Each column and error bar represents the mean and SEM from four experiments; I, The duration of the sleep-wake states during microinjection of saline or L-α-AA. Each column and error bar represents the mean and SEM from four experiments; *p < 0.05; unpaired t test; W duration, t(6) = 5.57, p = 0.0014; SWS duration, t(6) = 9.02, p = 0.0001.
Figure 11.
Figure 11.
The microdialysis site was validated by cresyl violet staining at the end of the experiment (coronal section; A); # represents the insertion site of the microdialysis probe in high-magnification image (B).
Figure 12.
Figure 12.
Cytokine levels in the dialysate (ECF) before and after photostimulation (120 min). TNF-α and IL-1β levels were measured using ELISA assay in VLPO (A) and hippocampus (B). Columns and error bars represent the mean and SD from four experiments; n.s., not significant; one-way ANOVA.
Figure 13.
Figure 13.
Optogenetic stimulation of cultured astrocytes induces ATP release. A, Primary astrocytes were infected with either Ad-EGFP (control virus, green, 7.6 × 10¹⁰ PFU/ml) or Ad-ChR2 (red). Two days after virus infection, cultured astrocytes were optically stimulated using an LED device before bioluminescence analysis of ATP release. The results are representative of three to six experiments. B, The extracellular ATP concentration was measured from the astrocyte-conditioned medium (ACM) in cultured astrocytes infected with either Ad-EGFP or Ad-ChR2 after 2-h photostimulation. Open circles represent the individual results (n = 6), and columns and error bars represent the mean and SD from six experiments; n.s., not significant; **p < 0.01; unpaired t test, t(10) = 29.50, p = 0.0001. C, The extracellular ATP concentration was measured from the ACM in cultured astrocytes infected with Ad-ChR2 by various duration of photostimulation. Open circles represent the individual results (n = 6), and columns and error bars represent the mean and SD from six experiments; n.s., not significant; **p < 0.01; unpaired t test, 10 min, t(10) = 8.67, p = 0.0001; 20 min, t(10) = 15.88, p = 0.0001. D, Effects of Brilliant Blue G (BBG, a P2X7 receptor antagonist, 100 nm) or CBX (a hemichannel blocker, 3 μm) on ATP release in cultured astrocytes. ChR2-expressing astrocytes were illuminated with LED in the absence (vehicle) or presence of 100 nm BBG or 3 μm CBX for 2 h. Extracellular ATP concentration was measured by a bioluminescence assay. Open circles represent the individual results (n = 5), and columns and error bars represent the mean and SD from five experiments; **p < 0.01; one-way ANOVA, F(2,12) = 29.42, p = 0.0001. E, Cell viability was measured by MTT assays 24 h after the treatment of 100 nm BBG or 3 μm CBX. Open circles represent the individual results (n = 4), and columns and error bars represent the mean and SD from four experiments; n.s.; not significant; one-way ANOVA.
Figure 14.
Figure 14.
TNAP plays pivotal roles in sleep-wake states. A, Experimental timeline (top) and the concentration of adenosine (ADO) in the VLPO dialysate collected during the light (2–4 P.M.) or dark (7–9 P.M.) period in the presence or absence of TNAP-I was measured by HPLC assay. ACSF or TNAP-I (3 μl, 10 mg/ml) was directly microinjected into the VLPO region for 30 min at a rate of 0.1 μl/min. The results are representative of four experiments; n.s., not significant; *p < 0.05, paired t test, t(4) = 3.19, p = 0.0331; #p < 0.05, unpaired t test, t(4) = 5.79, p = 0.0044. B, The percentage of wake (W), SWS, and PS in the representative wake (dark: 7–9 P.M.) or sleep (light: 2–4 P.M.) periods; Each column and error bar represents the mean and SEM from four experiments; n.s., not significant; *p < 0.05; paired t test, t(3) = 9.13, p = 0.0028; #p < 0.05; unpaired t test, t(6) = 13.50, p = 0.0001. C, Changes in the duration of the sleep-wake states [wake (W), SWS, and PS] at 30-min intervals before, during, and after treatment with saline or TNAP-I (horizontal bar). Saline or TNAP-I (3 μl, 10 mg/ml) was directly microinjected into the VLPO region for 30 min at a rate of 0.1 μl/min. Each column and error bar represents the mean and SEM from four experiments. D, The duration of the sleep-wake states during microinjection of saline or TNAP-I. Each column and error bar represents the mean and SEM from five experiments; *p < 0.05; unpaired t test, t(8) = 2.34, p = 0.0473. Note that the duration of the wake state was significantly increased in the TNAP-I group. E, The image represents each microinjection site of TNAP-I shown on coronal sections modified from the rat brain atlas.

References

    1. Araque A, Carmignoto G, Haydon PG, Oliet SH, Robitaille R, Volterra A (2014) Gliotransmitters travel in time and space. Neuron 81:728–739. 10.1016/j.neuron.2014.02.007 - DOI - PMC - PubMed
    1. Barat E, Boisseau S, Bouyssières C, Appaix F, Savasta M, Albrieux M (2012) Subthalamic nucleus electrical stimulation modulates calcium activity of nigral astrocytes. PLoS One 7:e41793. 10.1371/journal.pone.0041793 - DOI - PMC - PubMed
    1. Basheer R, Strecker RE, Thakkar MM, McCarley RW (2004) Adenosine and sleep-wake regulation. Prog Neurobiol 73:379–396. 10.1016/j.pneurobio.2004.06.004 - DOI - PubMed
    1. Ben Achour S, Pascual O (2012) Astrocyte-neuron communication: functional consequences. Neurochem Res 37:2464–2473. 10.1007/s11064-012-0807-0 - DOI - PubMed
    1. Benington JH, Heller HC (1995) Restoration of brain energy metabolism as the function of sleep. Prog Neurobiol 45:347–360. 10.1016/0301-0082(94)00057-o - DOI - PubMed

Publication types

MeSH terms

LinkOut - more resources