. 2020 Oct 16;11(5):e01930-20.
doi: 10.1128/mBio.01930-20.

SARS-CoV-2 Is Restricted by Zinc Finger Antiviral Protein despite Preadaptation to the Low-CpG Environment in Humans

Affiliations

SARS-CoV-2 Is Restricted by Zinc Finger Antiviral Protein despite Preadaptation to the Low-CpG Environment in Humans

Rayhane Nchioua et al. mBio. .

Abstract

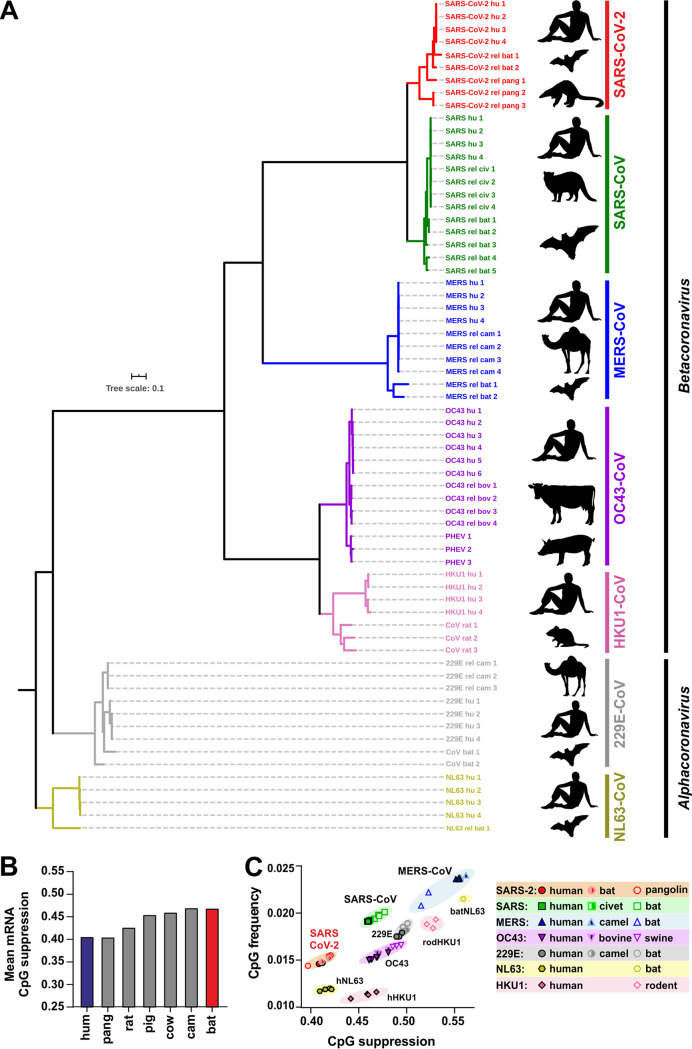
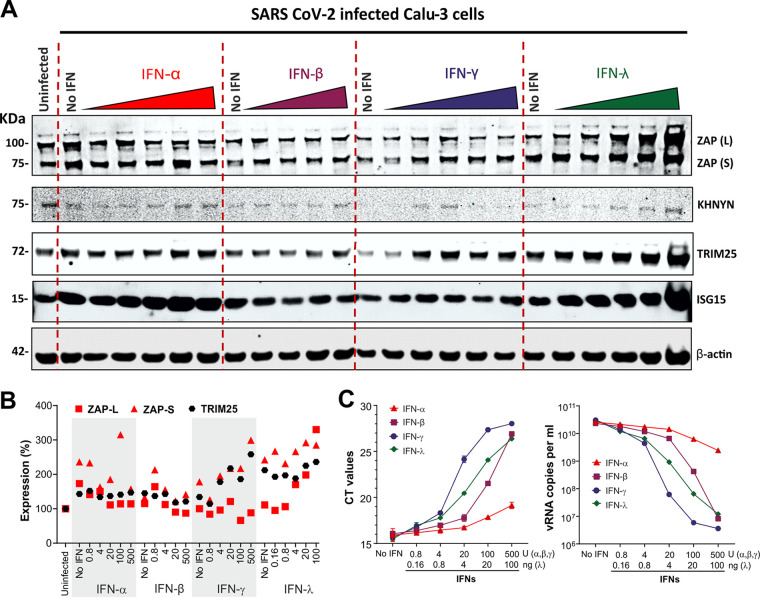
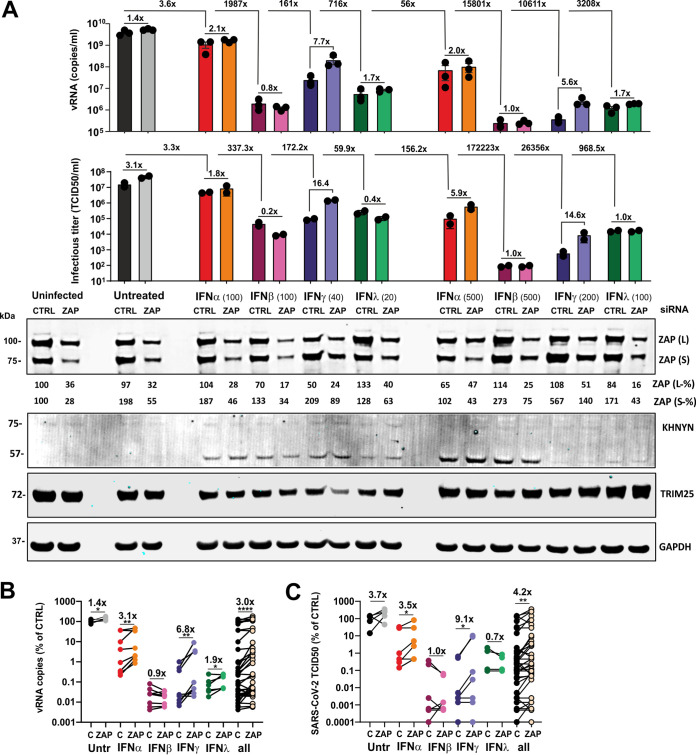
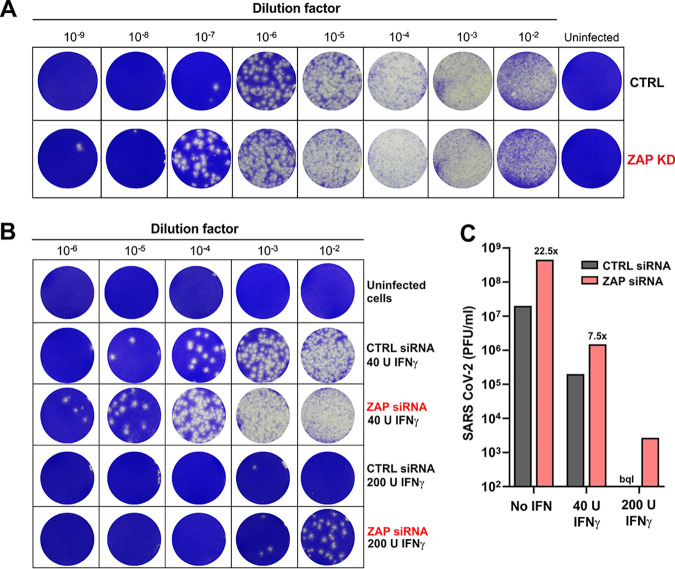
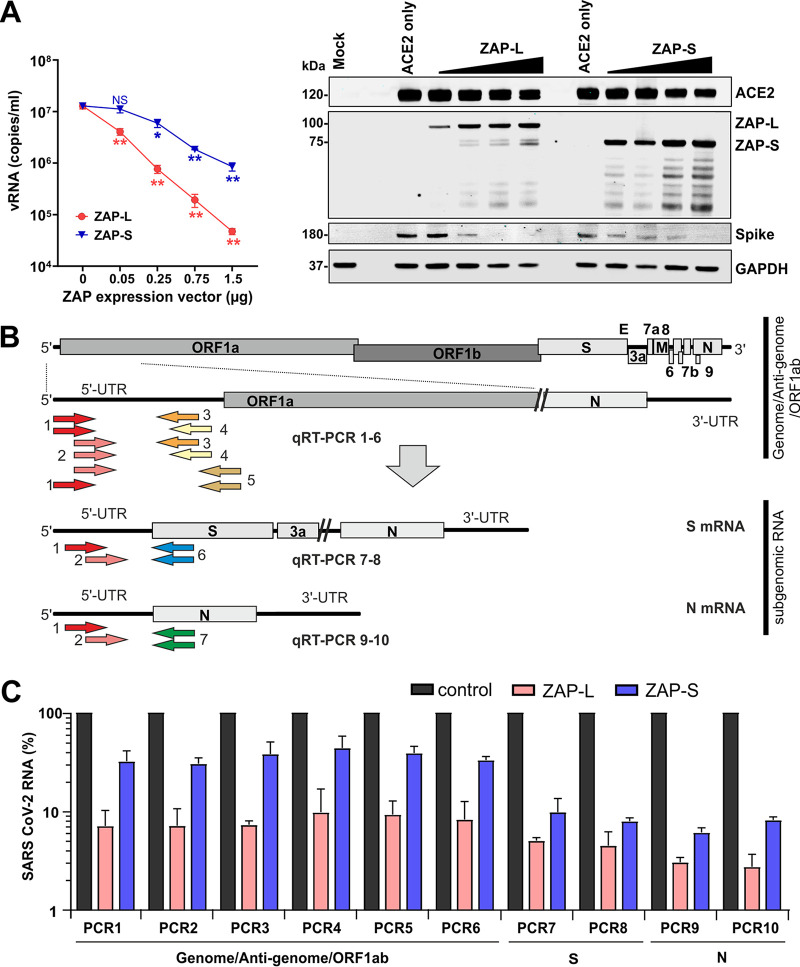
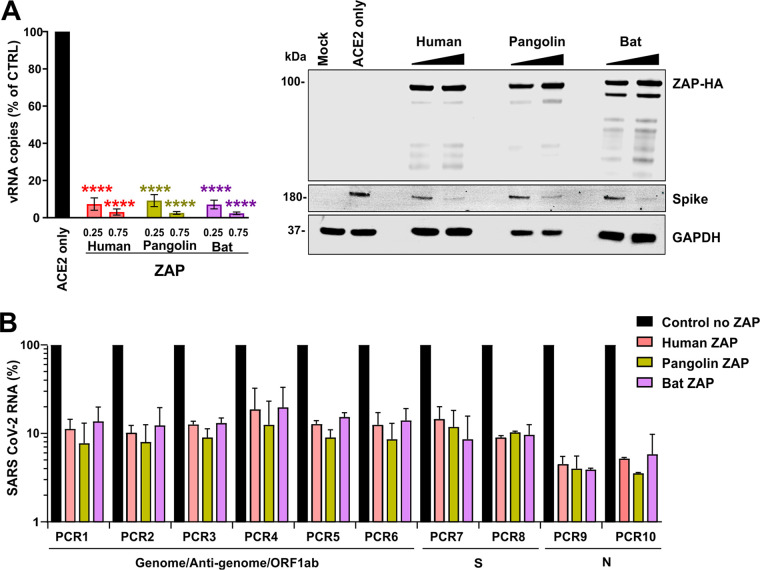
Recent evidence shows that severe acute respiratory syndrome coronavirus 2 (SARS-CoV-2) is sensitive to interferons (IFNs). However, the most effective types of IFNs and the underlying antiviral effectors remain to be defined. Here, we show that zinc finger antiviral protein (ZAP), which preferentially targets CpG dinucleotides in viral RNA sequences, restricts SARS-CoV-2. We further demonstrate that ZAP and its cofactors KHNYN and TRIM25 are expressed in human lung cells. Type I, II, and III IFNs all strongly inhibited SARS-CoV-2 and further induced ZAP expression. Comprehensive sequence analyses revealed that SARS-CoV-2 and its closest relatives from horseshoe bats showed the strongest CpG suppression among all known human and bat coronaviruses, respectively. Nevertheless, endogenous ZAP expression restricted SARS-CoV-2 replication in human lung cells, particularly upon treatment with IFN-α or IFN-γ. Both the long and the short isoforms of human ZAP reduced SARS-CoV-2 RNA expression levels, but the former did so with greater efficiency. Finally, we show that the ability to restrict SARS-CoV-2 is conserved in ZAP orthologues of the reservoir bat and potential intermediate pangolin hosts of human coronaviruses. Altogether, our results show that ZAP is an important effector of the innate response against SARS-CoV-2, although this pandemic pathogen emerged from zoonosis of a coronavirus that was preadapted to the low-CpG environment in humans.IMPORTANCE Although interferons inhibit SARS-CoV-2 and have been evaluated for treatment of coronavirus disease 2019 (COVID-19), the most effective types and antiviral effectors remain to be defined. Here, we show that IFN-γ is particularly potent in restricting SARS-CoV-2 and in inducing expression of the antiviral factor ZAP in human lung cells. Knockdown experiments revealed that endogenous ZAP significantly restricts SARS-CoV-2. We further show that CpG dinucleotides which are specifically targeted by ZAP are strongly suppressed in the SARS-CoV-2 genome and that the two closest horseshoe bat relatives of SARS-CoV-2 show the lowest genomic CpG content of all coronavirus sequences available from this reservoir host. Nonetheless, both the short and long isoforms of human ZAP reduced SARS-CoV-2 RNA levels, and this activity was conserved in horseshoe bat and pangolin ZAP orthologues. Our findings indicating that type II interferon is particularly efficient against SARS-CoV-2 and that ZAP restricts this pandemic viral pathogen might promote the development of effective immune therapies against COVID-19.

Keywords: COVID-19; CpG suppression; SARS-CoV-2; ZAP; evolution; interferon.


Figures

FIG 1
FIG 1
Phylogenetic relationship between human coronaviruses and their animal relatives and CpG suppression in pathogens and their hosts. (A) Distance-based relationship inference based on representative full-genome nucleotide sequences of human-infecting SARS-CoV-2, SARS-CoV, MERS-CoV, HKU1-CoV, OC43-CoV, NL63-CoV, and 229E-CoV strains and their closest known animal relatives. Black symbols to the right indicate the viral host (human, horseshoe bat, pangolin, civet, camel, rat, pig, or cattle). (B) Mean CpG suppression (i.e., number of observed CpGs normalized to expected CpGs based on sequence length and GC content) in mRNAs of the indicated host species (human [hum], pangolin [pang], rat, pig, cow, camel [cam], or horseshoe bat [bat]). (C) CpG frequency (number of CpGs normalized to sequence nucleotide length) and suppression (number of observed CpGs normalized to expected CpGs based on sequence length and GC content) in human coronavirus genomes and their closest animal-infecting relatives.
FIG 2
FIG 2
CpG content and distribution in human coronaviruses and their animal relatives. (A) CpG frequency, suppression, and GC content in the genomes of human (h)-infecting and animal (a)-infecting coronaviruses. (B) CpG frequency and suppression of sequenced bat coronaviruses available in NCBI database (n = 182); close relatives of SARS-CoV-2 are shown in bright (RaTG13) and dark (RmYN02) red. Each point represents one viral strain. (C) Heat map showing the number of CpG dinucleotides, ranging from 0 (white) to 10 (black), within 100-bp sliding windows of aligned genomic sequences of SARS-CoV-2 and its closest relatives infecting horseshoe bats and pangolins. The genome organization diagram at the top represents that of the human virus. (D) CpG frequency in major genes of human and related animal coronaviruses. These genes encode viral polyproteins (ORF1ab), envelope (E), spike (S), nucleocapsid (N), and matrix (M) proteins. bov, bovine; civ, civet. (E) Schematic representation of spike nucleotide sequences of SARS-CoV-2 and its closest relatives showing the relative positions of CpGs (pink stars), receptor binding domains (RBD), and receptor binding motifs (RBM). Gray lines indicate nucleotide mismatches compared to aligned SARS-CoV-2 spike. (F) Insertion in spike of SARS-CoV-2 introducing a novel furin-cleavage site after an RRAR motif.
FIG 3
FIG 3
Inhibition of SARS-CoV-2 by different types of IFN. (A) Endogenous expression of ZAP and its cofactors KHNYN and TRIM25 in Calu-3 cells that were left untreated and/or uninfected or were treated with the amounts of IFNs indicated in panel B and infected with SARS-CoV-2. Whole-cell lysates were immunoblotted and stained with anti-ZAP, anti-KHNYN, anti-TRIM25, anti-ISG15 and anti-β-actin. (B) Relative expression levels of the long (L) or short (S) isoforms of ZAP and TRIM25 normalized to unstimulated cells set as 100%. The data were derived from the Western blots shown in panel A. (C) Raw RT-qPCR threshold cycle (CT) values (left) and corresponding SARS-CoV-2 RNA copy numbers per ml (right) in the supernatants of Calu-3 cells were determined as described for panel A. n = 1 in technical duplicate. Shown are mean values ±SD.
FIG 4
FIG 4
Role of ZAP in restricting SARS-CoV-2 production. (A) SARS-CoV-2 RNA levels (top panel, n = 3 [biological replicates] ± SEM) and infectious titers (middle panel, n = 2 [biological replicates] ± standard deviations [SD]) in the supernatant of Calu-3 cells that were left untreated and/or uninfected or infected with SARS-CoV-2 and treated with the indicated amounts of IFNs. Cells were additionally transfected either with control siRNA (CTRL) or ZAP siRNA (ZAP) as indicated. Immunoblots of whole-cell lysates were stained with anti-ZAP, anti-KHNYN, anti-TRIM25, and anti-GAPDH (bottom panel). Relative expression levels of the long (L) or short (S) isoforms of ZAP are indicated below the blots. One representative blot of 2 biological replicates is shown. (B and C) SARS-CoV-2 RNA copy numbers (B) or infectious virus titers (C), quantified relative to the control in the supernatant of Calu-3 cells that were left untreated or treated with the indicated IFNs and transfected with control (C) or ZAP (ZAP) siRNA. Numbers above the samples indicate the average change in viral RNA copy numbers (vRNA) or infectious titer. P values: *, <0.05; **, <0.01; ***, <0.001; ****, <0.0001; unpaired Student's t test.
FIG 5
FIG 5
ZAP knockdown enhances infectious SARS-CoV-2 yield. (A and B) Cytopathic effects after infection of monolayers of Vero cells with serial dilutions of Calu-3 supernatants from the experiment represented in Fig. 4. Supernatants were obtained from Calu-3 cells treated with control or ZAP siRNA in the absence (A) or presence (B) of IFN-γ. Vero cells were stained with crystal violet (blue). (C) Calculated number of PFU in the supernatant of Calu-3 cells treated with control of ZAP siRNA. The number of plaques from cells treated with control siRNA and 200 U IFN-γ was too low for quantification (bql, below quantitation limit).
FIG 6
FIG 6
Restriction of SARS-CoV-2 by transient ZAP-L and ZAP-S expression. (A) Quantification of viral N gene RNA copies by qRT-PCR in the supernatant of ZAP KO HEK293T cells cotransfected with an ACE2 expression vector and increasing concentrations of vectors expressing ZAP-L or ZAP-S. Viral RNA yield was determined 48 h postinfection with SARS-CoV-2. Shown are mean values (±SD) obtained in three independent experiments, each measured in duplicate. Stars indicate significant (P value) differences from the no-ZAP control results as follows: *, <0.05; **, <0.01; ***, <0.001.The right panel shows a Western blot of whole-cell lysates stained with anti-ACE2, anti-ZAP-L and anti-ZAP-S, anti-SARS-CoV-2 Spike, and anti-GAPDH as loading control. (B) Schematic presentation of the SARS-CoV-2 genome and the positions of the primer binding sites in the full-length or subgenomic viral RNAs. (C) Effect of ZAP-L and ZAP-S on the levels of the indicated viral RNAs. Shown are mean values (±SD) from two independent experiments relative to the RNA levels obtained after cotransfection of ZAP-L or ZAP-S expression vectors compared to empty control vector (100%).
FIG 7
FIG 7
Restriction of SARS-CoV-2 by pangolin and horseshoe bat ZAP. (A) Viral N gene RNA copies detected in the supernatant of ZAP KO HEK293T cells cotransfected with an ACE2 expression vector and the indicated amounts of ZAP expression vectors compared to those transfected with the empty control vector (100%). Viral RNA yield was determined 48 h postinfection with SARS-CoV-2. Shown are mean values (±SD) obtained in three independent experiments, each measured in duplicate. Stars indicate significant differences from the no-ZAP control results as follows: *, <0.05; **, <0.01; ***, <0.001. The right panel shows a representative Western blot. (B) Effect of human, pangolin, and horseshoe bat ZAP expression on the levels of the indicated SARS-CoV-2 RNAs. Shown are mean values (±SD) from two independent experiments relative to the RNA levels obtained in the absence of ZAP (100%).

Similar articles

Cited by

References

    1. Zhou P, Yang X-L, Wang XG, Hu B, Zhang L, Zhang W, Si HR, Zhu Y, Li B, Huang CL, Chen HD, Chen J, Luo Y, Guo H, Jiang R-D, Liu MQ, Chen Y, Shen XR, Wang X, Zheng XS, Zhao K, Chen QJ, Deng F, Liu LL, Yan B, Zhan FX, Wang YY, Xiao GF, Shi ZL. 2020. A pneumonia outbreak associated with a new coronavirus of probable bat origin. Nature 579:270–273. doi:10.1038/s41586-020-2012-7. - DOI - PMC - PubMed
    1. Zheng Z, Peng F, Xu B, Zhao J, Liu H, Peng J, Li Q, Jiang C, Zhou Y, Liu S, Ye C, Zhang P, Xing Y, Guo H, Tang W. 2020. Risk factors of critical & mortal COVID-19 cases: a systematic literature review and meta-analysis. J Infect 81:E16–E25. doi:10.1016/j.jinf.2020.04.021. - DOI - PMC - PubMed
    1. Graham RL, Baric RS. 2010. Recombination, reservoirs, and the modular spike: mechanisms of coronavirus cross-species transmission. J Virol 84:3134–3146. doi:10.1128/JVI.01394-09. - DOI - PMC - PubMed
    1. Petrosillo N, Viceconte G, Ergonul O, Ippolito G, Petersen E. 2020. COVID-19, SARS and MERS: are they closely related? Clin Microbiol Infect 26:729–734. doi:10.1016/j.cmi.2020.03.026. - DOI - PMC - PubMed
    1. Mantlo E, Bukreyeva N, Maruyama J, Paessler S, Huang C. 2020. Antiviral activities of type I interferons to SARS-CoV-2 infection. Antiviral Res 179:104811. doi:10.1016/j.antiviral.2020.104811. - DOI - PMC - PubMed

Publication types

MeSH terms

LinkOut - more resources