. 2020 Nov 3;117(44):27445-27455.
doi: 10.1073/pnas.2012088117. Epub 2020 Oct 16.

Diatom modulation of select bacteria through use of two unique secondary metabolites

Affiliations

Diatom modulation of select bacteria through use of two unique secondary metabolites

Ahmed A Shibl et al. Proc Natl Acad Sci U S A. .

Abstract

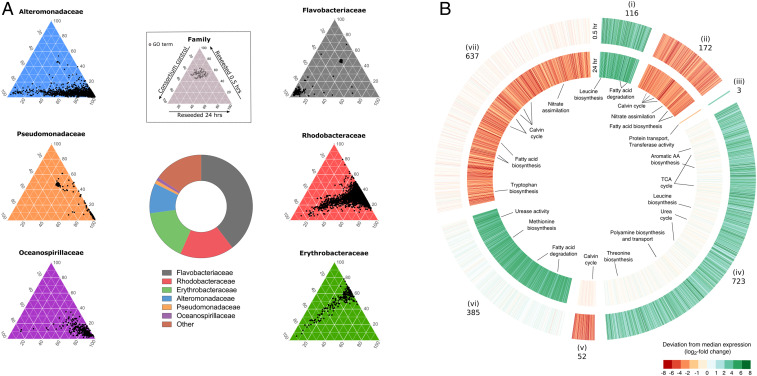
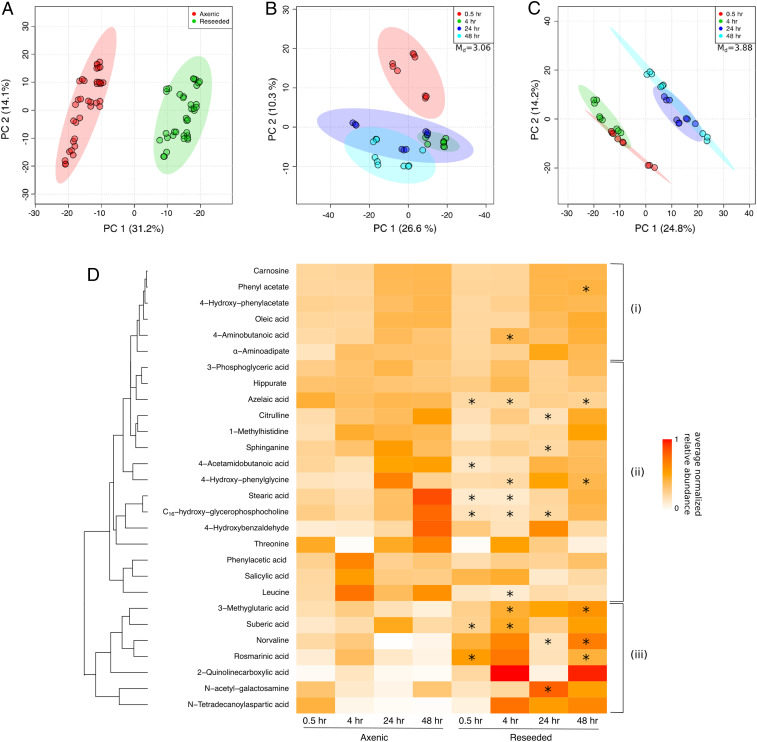
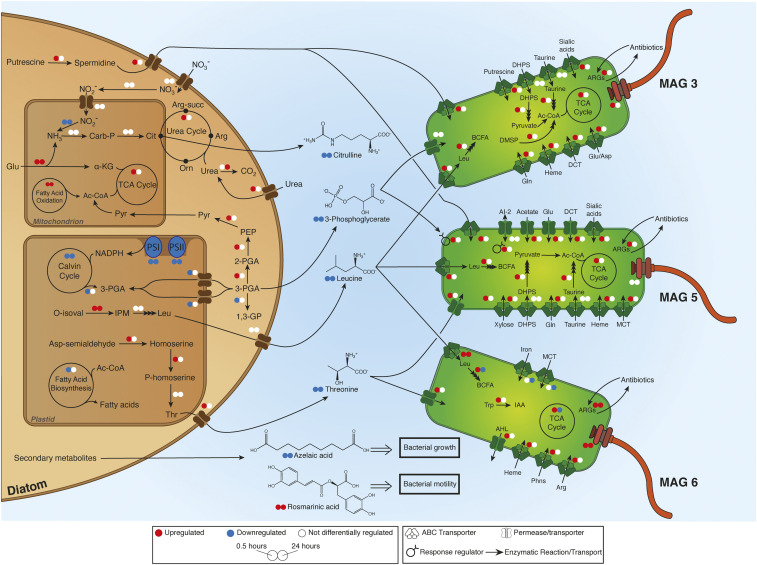
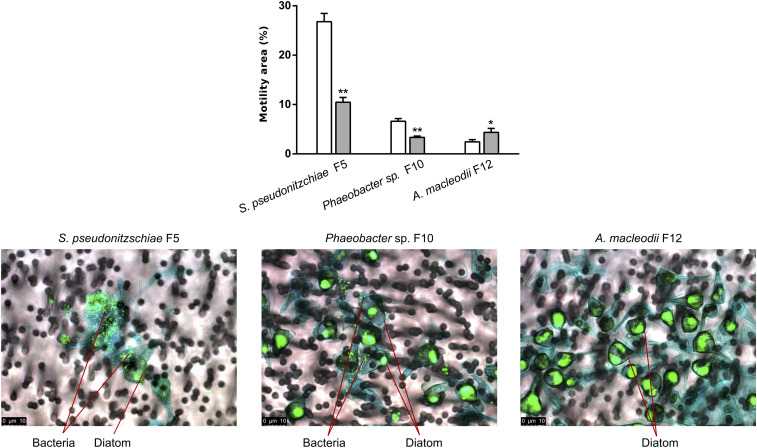
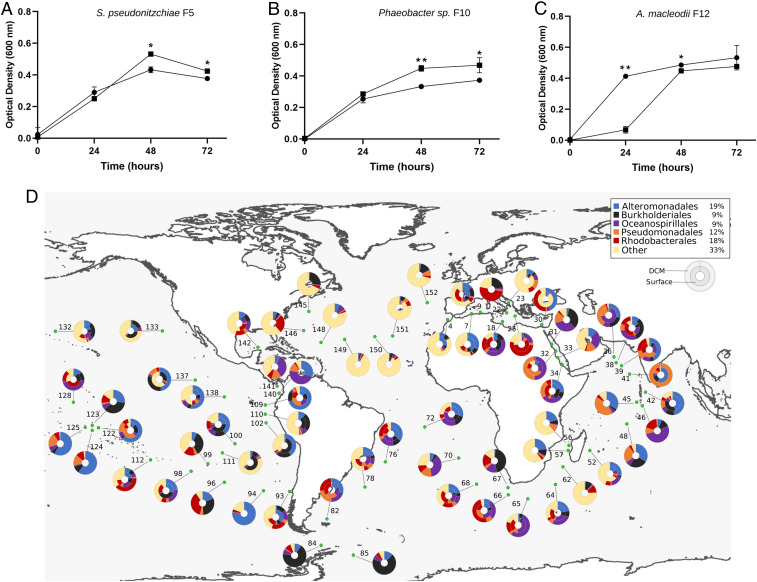
Unicellular eukaryotic phytoplankton, such as diatoms, rely on microbial communities for survival despite lacking specialized compartments to house microbiomes (e.g., animal gut). Microbial communities have been widely shown to benefit from diatom excretions that accumulate within the microenvironment surrounding phytoplankton cells, known as the phycosphere. However, mechanisms that enable diatoms and other unicellular eukaryotes to nurture specific microbiomes by fostering beneficial bacteria and repelling harmful ones are mostly unknown. We hypothesized that diatom exudates may tune microbial communities and employed an integrated multiomics approach using the ubiquitous diatom Asterionellopsis glacialis to reveal how it modulates its naturally associated bacteria. We show that A. glacialis reprograms its transcriptional and metabolic profiles in response to bacteria to secrete a suite of central metabolites and two unusual secondary metabolites, rosmarinic acid and azelaic acid. While central metabolites are utilized by potential bacterial symbionts and opportunists alike, rosmarinic acid promotes attachment of beneficial bacteria to the diatom and simultaneously suppresses the attachment of opportunists. Similarly, azelaic acid enhances growth of beneficial bacteria while simultaneously inhibiting growth of opportunistic ones. We further show that the bacterial response to azelaic acid is numerically rare but globally distributed in the world's oceans and taxonomically restricted to a handful of bacterial genera. Our results demonstrate the innate ability of an important unicellular eukaryotic group to modulate select bacteria in their microbial consortia, similar to higher eukaryotes, using unique secondary metabolites that regulate bacterial growth and behavior inversely across different bacterial populations.

Keywords: diatoms; microbiomes; phycosphere; phytoplankton–bacteria interactions; secondary metabolism.


Conflict of interest statement

The authors declare no competing interest.

Figures

Fig. 1.
Fig. 1.
Major reprogramming of transcriptional responses of A. glacialis A3 and Roseobacters in response to reseeding. (A) Central donut plot depicts relative abundances of the top six bacterial families in the consortium metagenomic dataset. (Inset) Key for color-coded ternary plots represents transcriptional responses of the bacterial families before (consortium 0.5 h control) and after (reseeded 0.5 and 24 h) reseeding based on biological triplicates. Each dot depicts a unique Gene Ontology (GO) annotation associated with transcripts from each of the six major families in the metatranscriptome. The position of each dot corresponds to the percent contribution of the sample (consortium control, reseeded 0.5 h, and reseeded 24 h) relative to the total normalized abundance of transcripts annotated with the same GO term in copies per million (cpm). (B) Differentially expressed (DE) genes in reseeded A. glacialis A3 after 0.5 (outer circle) and 24 (inner circle) hours relative to axenic controls. Genes are organized into seven clusters (i to vii) based on their expression pattern at the two time points. Numbers indicate the number of DE genes in each cluster. Opaque clusters indicate genes that are not DE. TCA, tricarboxylic acid; AA, amino acid.
Fig. 2.
Fig. 2.
SPE-extracted DOM profile is highly influenced by reseeding. (AC) Principal components analysis (PCA) plots of axenic and reseeded untargeted exometabolome samples. PCA was performed based on Mahalanobis distances (Md), comparing 1,237 SPE-extracted molecules between (A) axenic vs. reseeded samples and (B and C) early (0.5 and 4 h) and late (24 and 48 h) time points for (B) axenic and (C) reseeded conditions. Circles represent technical replicates (n = 3) of three biological replicates. (D) Euclidean hierarchical clustering of 28 exometabolites (SI Appendix, Table S4) identified in axenic and reseeded samples and confirmed using a library of in-house chemical standards. Colors represent average normalized relative abundance of each metabolite. Time points marked with an asterisk indicates a significant change in relative abundance across reseeded and axenic samples as determined with a Student’s t test (Bonferroni-adjusted P < 0.05). (i) Prospective refractory diatom metabolites, (ii) diatom metabolites possibly taken up by the consortium, and (iii) diatom metabolites with a potential signaling role.
Fig. 3.
Fig. 3.
A. glacialis A3 preferentially promotes growth of Roseobacters by secreting specific metabolites that influence bacterial growth and behavior. Summary of diatom–bacteria interactions highlighting the metabolic exchanges and differentially expressed (DE) genes in A. glacialis A3 and three Roseobacter MAGs. Small colored circles (red, up-regulation; blue, down-regulation; white, no DE) represent differential expression of genes/processes at 0.5 (Left) and 24 (Right) hours after reseeding. Differential expression of metabolic cycles indicates that at least one gene was DE in one direction while no other genes were DE in the opposite direction. A complete list of genes and expression values are in SI Appendix, Tables S3 and S5. Confirmed central and secondary molecules from the exometabolome (SI Appendix, Table S4) are shown between the cells, and their relative abundance is indicated by colored circles relative to axenic controls. Multiple stacked arrows indicate several enzymatic reactions. SAMamine, S-adenosylmethionineamine; Carb-P, carbamoylphosphate; Cit, citrulline; α-KG, α-ketoglutarate; Pyr, pyruvate; Arg-succ, argininosuccinate; Arg, arginine; Orn, ornithine; PEP, phosphoenolpyruvate; 3-PGA, 3-phosphoglycerate; 1,3-GP, glycerate 1,3-diphosphate; PS, photosystem genes; O-isoval, o-isovalerate; IPM, isopropylmalate; Asp, aspartate; Glu, glutamate; Gln, glutamine; Leu, leucine; Thr, threonine; Trp, tryptophan; BCFA, branched-chain fatty acids; DHPS, 2,3-dihydroxypropanesulfonate; ARGs, antibiotic resistance genes; DCT, dicarboxylate transporter; DMSP, dimethylsulfoniopropionate; AI-2, autoinducer-2; MCT, monocarboxylate 2-oxoacid transporter; Phns, phosphonates; AHL, acyl homoserine lactones; IAA, indole-3-acetate.
Fig. 4.
Fig. 4.
Diatom secondary metabolite rosmarinic acid reduces motility and promotes attachment of potential Roseobacter symbionts to A. glacialis A3. (Top) Motility behavior of strains S. pseudonitzschiae F5, Phaeobacter sp. F10, and A. macleodii F12 grown on semisolid (0.25% wt/vol) marine agar plates with (gray bars) or without (white bars) 2 µM rosmarinic acid. Error bars represent standard deviation (SD) of three replicates. Significance was determined by Student’s t test: *P < 0.05 and **P < 0.001. (Bottom) Fluorescence microscopy images of cocultures of the diatom with the two Roseobacter strains and A. macleodii F12. SYBR Green I was used to visualize diatom and bacterial DNA; alcian blue was used to stain the diatom exopolysaccharide matrix, known as transparent exopolymeric particles (TEP; in blue). Cocultures were gently filtered prior to microscopy onto 3-μm membrane filters to remove free-living bacteria. No bacteria are visible on TEP in the vicinity of diatom cells in the A. macleodii F12 panel, indicating that most A. macleodii F12 cells were free-living and were removed by gravity filtration.
Fig. 5.
Fig. 5.
Azelaic acid inhibits growth of A. macleodii F12 and promotes growth of Roseobacters. Growth of (A) S. pseudonitzschiae F5, (B) Phaeobacter sp. F10, and (C) A. macleodii F12 on 10% marine broth supplemented with 100 µM azelaic acid (squares) compared to controls (circles). Error bars represent SD of three replicates. Significance was determined by Student’s t test: *P < 0.05 and **P < 0.001. (D) Bacterial response to azelaic acid is geographically widespread throughout the oceans. The relative abundance of reads of the azelaic acid transcriptional regulator, AzeR, in the Tara Oceans database is 0.03%. The total percentage abundance of AzeR homologs according to their taxonomic distribution is shown in the top right box. Rhizobiales makes up the majority of hits (39%) in the “other” group. The color-coded donut plots represent the percentage taxonomic abundance of AzeR homologs from all size fractions (0 to 3 μm) at the surface (inner circle) and deep chlorophyll maximum (outer circle) from the Tara Oceans Microbiome Reference Gene Catalog. Numbers refer to the Tara Oceans stations; single donut plots depict surface samples only.

References

    1. Pennisi E., No microbiome is an island, survey reveals. Science 365, 851 (2019). - PubMed
    1. Nyholm S. V., McFall-Ngai M. J., The winnowing: Establishing the squid-vibrio symbiosis. Nat. Rev. Microbiol. 2, 632–642 (2004). - PubMed
    1. van Oppen M. J. H., Blackall L. L., Coral microbiome dynamics, functions and design in a changing world. Nat. Rev. Microbiol. 17, 557–567 (2019). - PubMed
    1. Knight R.et al. ., The microbiome and human biology. Annu. Rev. Genomics Hum. Genet. 18, 65–86 (2017). - PubMed
    1. Stone B. W. G., Weingarten E. A., Jackson C. R., The role of the phyllosphere microbiome in plant health and function. Annu. Plant Rev. Online 5, 533–556 (2018).

Publication types

LinkOut - more resources