. 2020 Oct 16;11(1):5247.
doi: 10.1038/s41467-020-19076-2.

A role for spindles in the onset of rapid eye movement sleep

Affiliations

A role for spindles in the onset of rapid eye movement sleep

Mojtaba Bandarabadi et al. Nat Commun. .

Abstract

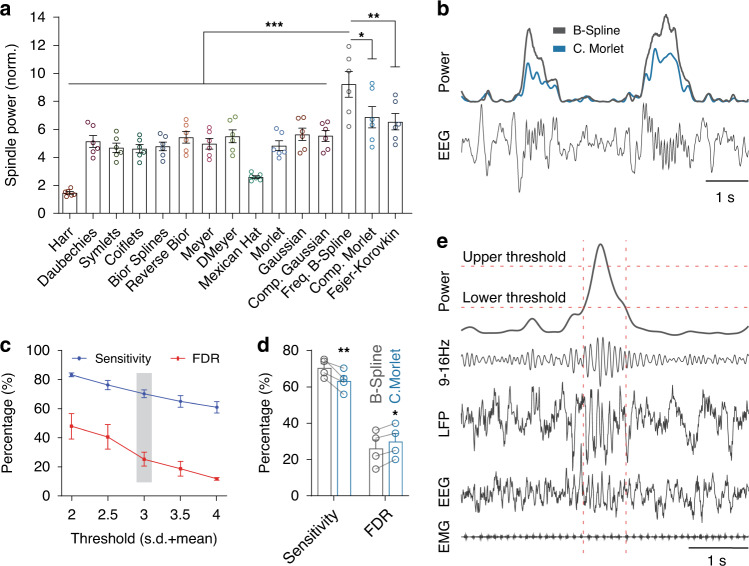
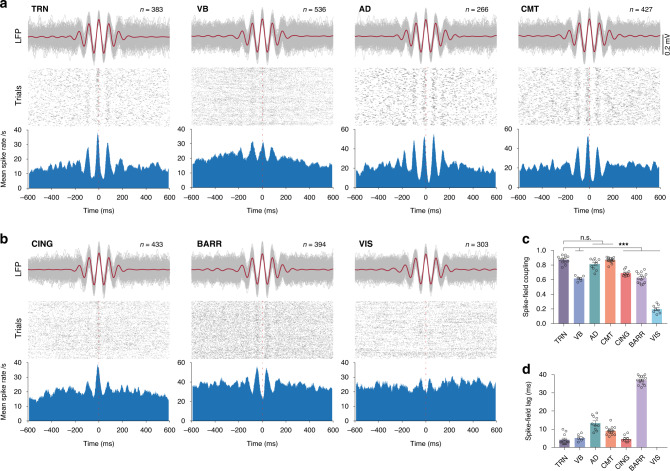
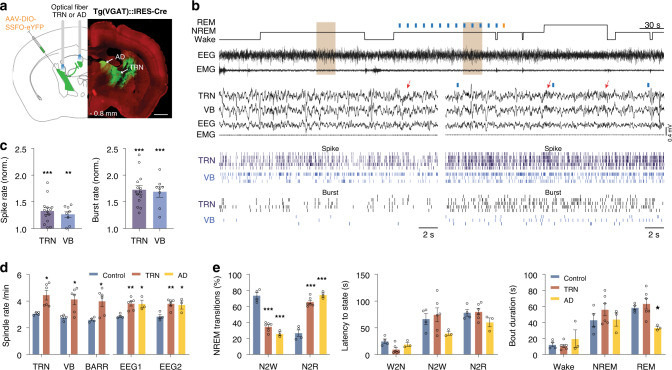
Sleep spindle generation classically relies on an interplay between the thalamic reticular nucleus (TRN), thalamo-cortical (TC) relay cells and cortico-thalamic (CT) feedback during non-rapid eye movement (NREM) sleep. Spindles are hypothesized to stabilize sleep, gate sensory processing and consolidate memory. However, the contribution of non-sensory thalamic nuclei in spindle generation and the role of spindles in sleep-state regulation remain unclear. Using multisite thalamic and cortical LFP/unit recordings in freely behaving mice, we show that spike-field coupling within centromedial and anterodorsal (AD) thalamic nuclei is as strong as for TRN during detected spindles. We found that spindle rate significantly increases before the onset of rapid eye movement (REM) sleep, but not wakefulness. The latter observation is consistent with our finding that enhancing spontaneous activity of TRN cells or TRN-AD projections using optogenetics increase spindle rate and transitions to REM sleep. Together, our results extend the classical TRN-TC-CT spindle pathway to include non-sensory thalamic nuclei and implicate spindles in the onset of REM sleep.


Conflict of interest statement

The authors declare no competing interests.

Figures

Fig. 1
Fig. 1. Improving the wavelet-based spindle detection method.
a Comparison between 15 different wavelet families to find the optimum function. Normalized spindle power indicates ratio between average wavelet energy of spindle segments and spindle-free segments. The complex frequency B-Spline wavelet function has significantly a higher normalized power as compared to other functions (complex frequency B-spline vs. other functions: P < 0.0001; F = 14.22; d.f. = 14; one-way ANOVA with Tukey’s post-hoc test; *P < 0.05, **P < 0.01, ***P < 0.001; n = 6 subjects). b Representative spindles of human EEG signals and normalized wavelet energy within the spindle range (9–16 Hz) using the complex Morlet and frequency B-Spline functions. c Evaluation of the spindle detection algorithm on EEG recordings from naturally sleeping mice. Visual inspection of the automatically detected spindles by a human expert using different threshold levels revealed a sensitivity of 70 ± 2.7% and a false detection rate (FDR) of 25.2 ± 4.8% using the selected threshold (3SD + mean). Sensitivity and FDR are the number of correct and false detections, respectively, divided by sum of correctly detected and missed spindles. d Comparison between the complex frequency B-Spline and the complex Morlet functions for detection of spindles from EEG recordings of mice. Using the complex frequency B-Spline function as the core of the detection method provides significantly higher sensitivity and lower FDR (Sensitivity: P = 0.002; FDR: P = 0.043; two-way ANOVA with Sidak’s post-hoc test; *P < 0.05, **P < 0.01; n = 4 animals). e Representative thalamic LFP and EEG/EMG signals of a detected spindle in mice. The dashed horizontal lines indicate upper and lower thresholds to detect the spindle and its start/end times, respectively. The dashed vertical lines indicate start and end of the spindle. Error bars indicate mean ± SEM. Source data are provided as a Source Data file.
Fig. 2
Fig. 2. Cellular substrates of regional sleep spindles in thalamic nuclei and cortical sites.
a Representative average (red) and individual (gray) traces of thalamic spindles filtered within the spindle range (9–16 Hz) and aligned to peaks of central cycles of spindles. Each gray line represents one spindle, and n indicate the number of spindles. Raster plots show single-unit activity of thalamic neurons during spindles, where each trial represents one spindle. The average neuronal firing rate of trials were obtained using a moving window of 10 ms having 80% overlap. Zero time indicates peaks of central cycles of spindles. b Same as a, but for cortical LFP/unit recordings. c Quantification of spike–field coupling during spindles using the normalized cross-correlation between filtered LFPs and average spike rate traces. Spike–field coupling within CMT and AD nuclei is as strong as in TRN (TRN vs. CMT: P > 0.99; TRN vs. AD: P = 0.18; F = 162.6; d.f. = 6; one-way ANOVA with Tukey’s post-hoc test; ***P < 0.001; TRN: n = 12, VB: n = 7, AD: n = 10, CMT: n = 15, CING: n = 9, BARR: n = 14, VIS: n = 8 cells; 6 animals for TRN/VB and 12 for other sites). d Time lags between LFPs and single-unit activities of panel c. Error bars indicate mean ± SEM. Source data are provided as a Source Data file.
Fig. 3
Fig. 3. Spindles coincide with slow waves (SW) within the CMT, CING, and AD.
a Graphs show the average time–frequency representations of spindles. Vertical dotted white lines indicate the onset of spindles. Traces below the spectrograms show average of filtered LFPs for SW (blue, 0.5–4 Hz) and average of envelope of filtered LFPs in the spindle range (red, 9–16 Hz). Representative time–frequency graphs and traces were obtained from 334 ± 19 thalamic and 318 ± 39 cortical spindles. b Normalized cross-correlation between SW and spindle envelope indicates a significant SW–spindle coupling within the CMT, CING, and AD as compared to other sites (CMT, CING, and AD vs. others: P < 0.05; F = 19.2; d.f. = 8; one-way ANOVA with Tukey’s post-hoc test, *P < 0.05; n = 6 animals for TRN/VB, n = 12 for other sites). c Percentage of spindles that coincide with UP states. The CMT, AD, and CING have significantly higher ratios of spindles occurred during UP states as compared to the other sites (CMT, CING, and AD vs. others: P < 0.01; F = 40.2; d.f. = 8; one-way ANOVA with Tukey’s post-hoc test, *P < 0.05; n = 6 animals for TRN/VB, n = 12 for other sites). d Correlation between delta power during spindles and SW–spindle coupling for the thalamic and cortical sites. This correlation is weak for the thalamic nuclei, while significantly high for the cortical sites (P = 0.079 for thalamic nuclei; P = 0.006 for cortical sites; two-tailed Pearson’s correlation test; n = 6 animals for TRN/VB, n = 12 for other sites). e Delta power during spindles significantly increases for cortical, but not for thalamic, LFP recordings during recovery sleep (yellow) as compared to baseline (black; recovery vs. baseline: P < 0.001 for CING and VIS; P < 0.05 for BARR; F = 17.5; d.f. = 8; two-way ANOVA with Sidak’s post-hoc test, ***P < 0.001; baseline: n = 6 animals for TRN/VB, n = 12 for other sites; recovery: n = 4 animals). Bars indicate mean ± SEM. Source data are provided as a Source Data file.
Fig. 4
Fig. 4. Spindle rate significantly increases before REM sleep, but not wakefulness.
a Representative spatiotemporal distribution of spindles across the vigilance states. Raster plot illustrates the detected spindles. Color-coded graph shows z-scored delta power across vigilance stats. Hypnogram is depicted below. b Spindle rate during NREM episodes before a transition to wake (N2W) or REM sleep (N2R), and within 25 s before REM sleep onset. Spindle rate of N2R episodes is significantly higher than of N2W, with a maximum rate within a window of 25 s before REM onset (N2R and 25 s before REM vs. N2W: P < 0.0001 for all sites; F = 891.2; d.f. = 2; two-way ANOVA with Bonferroni’s post-hoc test; ***P < 0.001; n = 6 animals for TRN/VB and n = 12 for other sites). c Same as b, but for recovery sleep. Spindle rate significantly increases before transition to REM sleep (25 s before REM vs. N2W: P < 0.001; F = 70.7; d.f. = 2; two-way ANOVA with Bonferroni’s post-hoc test; *P < 0.05, **P < 0.01, ***P < 0.001; n = 4 animals). d Dynamics of spindle rate during recovery sleep after 4 h of sleep deprivation, estimated using a moving window of 30 min having 25 min overlap. Spindle rate during recovery sleep significantly increased as compared to baseline, returning to baseline values after 40 min for the thalamic and 60 min for the cortical sites (recovery vs. baseline: thalamic nuclei: P < 0.001; F = 5.9; d.f. = 34; cortical sites: P < 0.001; F = 10.4; d.f. = 34; two-way ANOVA with Bonferroni’s post-hoc test; *P < 0.05; n = 4 animals for TRN/VB and n = 5 for other sites). e Spindle rate during baseline and the first 30 min of recovery sleep for the individual sites showed that spindle rate significantly increased for all sites, except the AD. Cortical recordings showed the highest increase in spindle rate during first 30 min of recovery sleep (first 30 min of recovery vs. baseline: P < 0.001; F = 190.7; d.f. = 1; two-way ANOVA with Bonferroni’s post-hoc test; *P < 0.05, **P < 0.01, ***P < 0.001; n = 4 animals for TRN/VB, n = 5 for other sites). Bars indicate mean ± SEM. Source data are provided as a Source Data file.
Fig. 5
Fig. 5. Optogenetic activation of TRNVGAT cells or TRN-AD terminals increases spindle rate and probability of transitions to REM sleep.
a Schematic representation of stereotactic injection of a EF1α-DIO-SSFO-EYFP adeno-associated virus in the anterior TRN of VGAT::IRES-Cre driver mice, and bilateral optic fiber placement in TRN or AD. b Representative EEG/EMG and thalamic LFP/unit/burst activities during NREM sleep episodes outside and within stimulation of TRNVGAT cells. The brown-shaded areas in the top traces are expanded below. Red arrows indicate the detected spindles. c Quantification of single-unit and burst firing of TRN (n = 14 cells) and VB (n = 8 cells) neurons during TRN activation, normalized to the baseline condition. Both single-unit and burst firing of TRN and VB neurons significantly increased as compared to baseline (TRN stimulation vs. control: TRN: unit: P = 0.0002; t = 5.1; d.f. = 13; burst: P < 0.0001; t = 8.8; d.f. = 13; n = 14 cells, 6 animals; VB: unit: P = 0.003; t = 4.4; d.f. = 7; burst: P = 0.0002; t = 7.0; d.f. = 7; n = 8 cells, 6 animals; two-sided paired t-test; **P < 0.01, ***P < 0.001). d Spindle rate significantly increases upon optogenetic activation of TRNVGAT neurons or their terminals within AD (TRN stimulation vs. control: TRN: P = 0.032, VB: P = 0.035, BARR: P = 0.041, EEG1: P = 0.004, EEG2: P = 0.009; AD stimulation vs. control: EEG1: P = 0.013, EEG2: P = 0.016; F = 4.48; d.f. = 4; two-way ANOVA with Tukey’s post-hoc test; *P < 0.05, **P < 0.01; n = control:4, TRN:6, AD:3 animals). e Averaged NREM sleep transitions (left), latency to next states (middle) and bout duration upon SSFO activation of TRN (red), AD (yellow), or control (blue; TRN or AD stimulation vs. control: NREM transitions: P < 0.0001 for N2R and N2W; F = 0.82; d.f. = 2; latency to vigilance state: P > 0.05 for all states; F = 1.7; d.f. = 4; two-way ANOVA with Tukey’s post-hoc test; *P < 0.05, **P < 0.01, ***P < 0.001; n = control: 4, TRN:6, AD:3 animals). All values are reported as mean ± SEM. Source data are provided as a Source Data file.

References

    1. Andrillon T, et al. Sleep spindles in humans: insights from intracranial EEG and unit recordings. J. Neurosci. 2011;31:17821–17834. doi: 10.1523/JNEUROSCI.2604-11.2011. - DOI - PMC - PubMed
    1. De Gennaro L, Ferrara M. Sleep spindles: an overview. Sleep Med. Rev. 2003;7:423–440. doi: 10.1053/smrv.2002.0252. - DOI - PubMed
    1. Nir Y, et al. Regional slow waves and spindles in human sleep. Neuron. 2011;70:153–169. doi: 10.1016/j.neuron.2011.02.043. - DOI - PMC - PubMed
    1. Schneider, W. T., Vas, S., Nicol, A. U. & Morton A. J. Characterizing sleep spindles in sheep. eNeuro7, ENEURO.0410-0419.2020 (2020). - PMC - PubMed
    1. Steriade M, McCormick DA, Sejnowski TJ. Thalamocortical oscillations in the sleeping and aroused brain. Science. 1993;262:679–685. doi: 10.1126/science.8235588. - DOI - PubMed

Publication types