Multicenter Study
. 2020 Oct 16;11(1):5228.
doi: 10.1038/s41467-020-19116-x.

Non-invasive decision support for NSCLC treatment using PET/CT radiomics

Affiliations
Multicenter Study

Non-invasive decision support for NSCLC treatment using PET/CT radiomics

Wei Mu et al. Nat Commun. .

Abstract

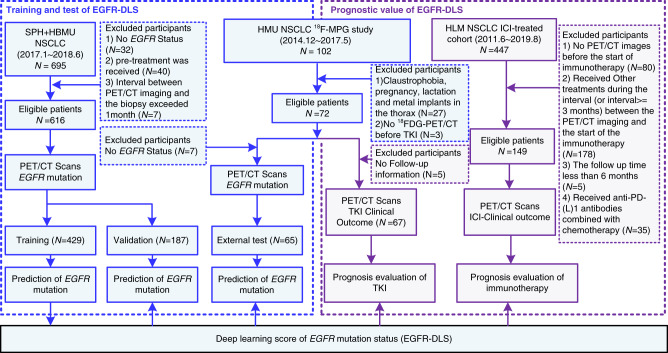
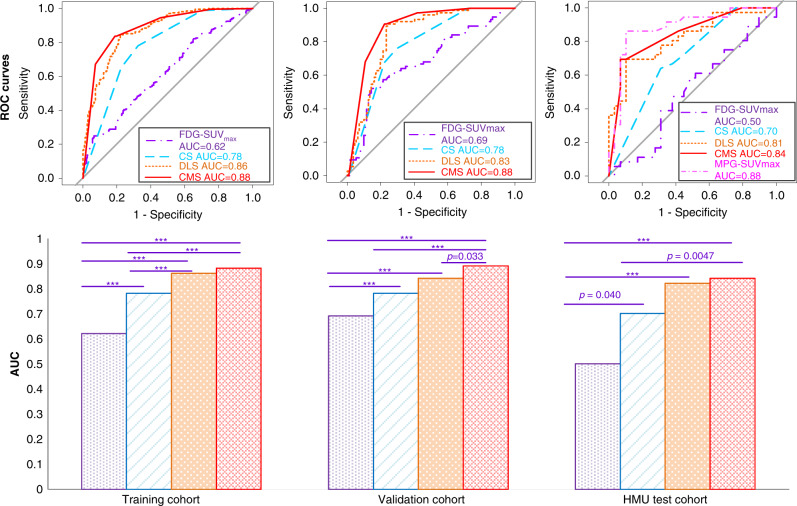
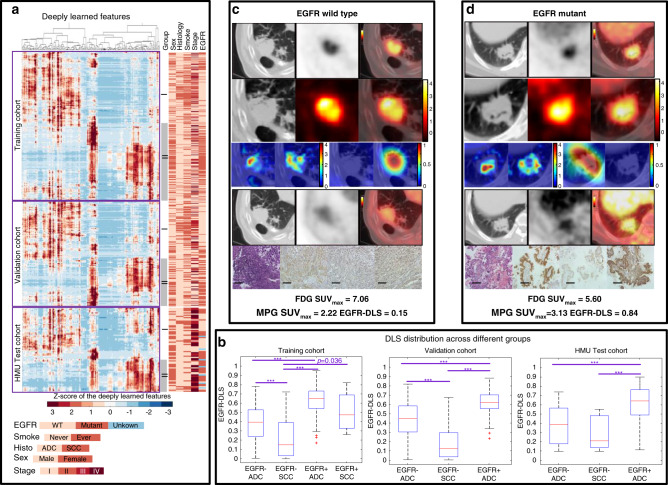
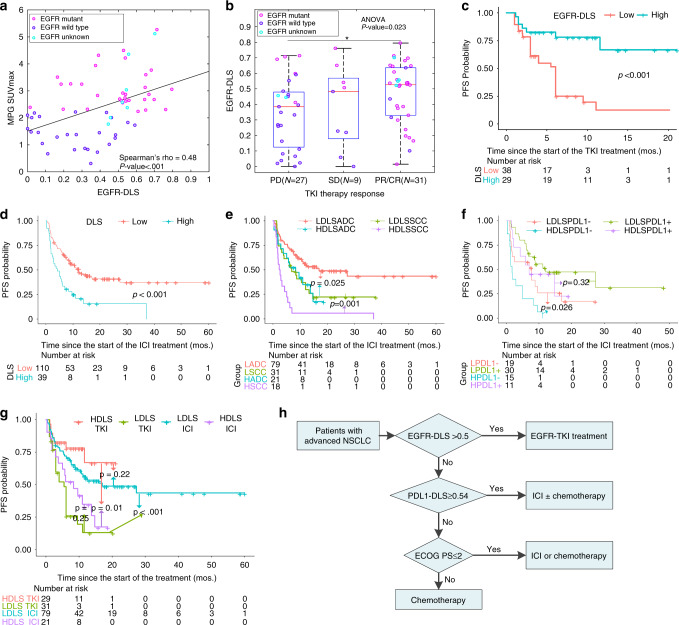
Two major treatment strategies employed in non-small cell lung cancer, NSCLC, are tyrosine kinase inhibitors, TKIs, and immune checkpoint inhibitors, ICIs. The choice of strategy is based on heterogeneous biomarkers that can dynamically change during therapy. Thus, there is a compelling need to identify comprehensive biomarkers that can be used longitudinally to help guide therapy choice. Herein, we report a 18F-FDG-PET/CT-based deep learning model, which demonstrates high accuracy in EGFR mutation status prediction across patient cohorts from different institutions. A deep learning score (EGFR-DLS) was significantly and positively associated with longer progression free survival (PFS) in patients treated with EGFR-TKIs, while EGFR-DLS is significantly and negatively associated with higher durable clinical benefit, reduced hyperprogression, and longer PFS among patients treated with ICIs. Thus, the EGFR-DLS provides a non-invasive method for precise quantification of EGFR mutation status in NSCLC patients, which is promising to identify NSCLC patients sensitive to EGFR-TKI or ICI-treatments.


Conflict of interest statement

R.J.G. declared a potential conflict with HealthMyne, Inc (Investor (major), Board of Advisors (uncompensated)). J.E.G. reports receiving commercial research grants from AstraZeneca, Merck, Array, Epic Sciences, Genentech, Bristol-Myers Squibb, BI, Trovagene, and Novartis, and is a consultant/advisory board member for AstraZeneca, Janssen, Genentech, Eli Lilly, Celgene, and Takeda, and other remuneration from Genentech, AstraZeneca, Merck, and Lilly/Genenech. The remaining authors declare no competing interests.

Figures

Fig. 1
Fig. 1. Study design and inclusion and exclusion diagram.
The SPH and HBMU data comprised EGFR mutation status and the corresponding imaging data, and was used to train and validate the deep learning score (EGFR-DLS) generated by the deep learning model. The HMU TKI-treated data comprised EGFR mutation status, and the corresponding imaging data was used for the external test of the EGFR-DLS and also used for the investigation of the prognostic value of the EGFR-DLS for TKI treatment. The HLM ICI-treated data comprised patients included in anti-PD-1 and anti-PD-L1 immunotherapy, and was used for the investigation of the prognostic value of the EGFR-DLS for immunotherapy.
Fig. 2
Fig. 2. Performance of the EGFR-DLS in predicting EGFR status across different cohorts.
The top row are the ROC curves of different models in the training, validation, and HMU test cohorts, respectively. The bottom row are the AUC values and the comparison results with Delong test. For statistical comparisons among different models, a two-sided Delong test was used. *** denotes a p value <0.001. If p value is otherwise, it is noted. Statistics for AUC, sensitivity, specificity, and accuracy for all cohorts are provided in Supplementary Table 1.
Fig. 3
Fig. 3. The unsupervised clustering of the deep learning features, the distribution of the EGFR-DLS, and two NSCLC adenocarcinoma patients with different EGFR mutation status.
a The unsupervised hierarchical clustering of the deep learning features (i.e., the output of global average pooling, N = 256) on the vertical axis, which shows a significant association of the deep learning expression patterns with EGFR mutation (training: p < 0.001, validation: p < 0.001, HMU: p = 0.002, χ2 test). There was also significant association of the expression patterns by stage (training: p < 0.001, validation: p < 0.001, HMU: p = 0.66), smoke status (training: p < 0.001, validation: p < 0.001, HMU: p = 0.045), histology (training: p < 0.001, validation: p < 0.001, HMU: p = 1.00), and sex (training: p < 0.001, validation: p < 0.001, HMU: p = 0.076). b The EGFR-DLS distribution across different subgroups divided by EGFR mutation status and histology type. Significant difference of EGFR-DLS was found between adenocarcinoma (ADC) and squamous cell carcinoma (SCC) for EGFR-wild-type patients (training: p < 0.001, validation: p < 0.001, HMU: p = 0.24). In the box plots, the central line represents the median, the bounds of box the first and third quartiles, and the whiskers are the interquartile range. For statistical comparisons among different groups, a two-sided Wilcoxon signed-rank test was used. For the validation cohort, n = 80, 32, and 75 for EGFR− ADC, EGFR− SCC, and EGFR+ ADC groups, respectively. For the HMU test cohort, n = 22, 7, and 36 for EGFR− ADC, EGFR− SCC, and EGFR+ ADC groups, respectively. Note: ***means p value <0.001. If p value is otherwise it is so noted. c, d The patients with wild-type EGFR and EGFR L858 mutant, respectively. The first lines are the CT, PET, and fusion images of 18F-FDG PET/CT imaging, the second lines are the input ROIs. For the third line, columns 1 and 2 show two of the activation maps of the fourth ResBlock, columns 3 and 4 show the negative filter and positive filter. The fourth lines are the CT, PET, and fusion images of 18F-MPG PET/CT imaging. The last lines show hematoxylin and eosin (H&E) staining, the immunohistochemistry for total-EGFR, phospho-EGFR, and L858-specific EGFR at X20 magnification demonstrating EGFR mutation status. Scale bar, 200 µm. Immunohistochemistry scoring was performed on at least two independent biological replicates (slides) per patient.
Fig. 4
Fig. 4. Prognostic value of the EGFR-DLS in the different cohorts and in guiding treatment.
ac The prognostic value of the EGFR-DLS in the TKI-treated cohort. a The correlation between the EGFR-DLS and the SUVmax of the 18F-MPG PET/CT imaging. p Value indicates two-sided Spearman rank-correlation test. b The objective response to TKI treatment relative to the EGFR-DLS. n = 27, 9, and 31 for PD, SD, and PR/CR groups, respectively. In the box plot, the central line represents the median, the bounds of box the first and third quartiles, and the whiskers are the interquartile range. p Value shows two-sided ANOVA. * denotes a p value <0.05. c The progression survival of patients relative the EGFR-DLS (cutoff: 0.5). df Prognostic value of the EGFR-DLS in the ICI-treated cohorts. d The progression survival of patients relative the EGFR-DLS. e The progression survival of patients relative the EGFR-DLS and histology type (ADC adenocarcinoma, SCC squamous cell carcinoma). f Progression-free survival of patients relative the EGFR-DLS and PD-L1 status (EGFR-DLS cutoff: 0.5). HDLS high EGFR-DLS, LDLS low EGFR-DLS, PD-L1− PD-L1 negative (i.e., the tumor proportion score (TPS) < 1%), PD-L1+ PD-L1 positive (i.e., the tumor proportion score (TPS) ≥ 1%). The LPDL1− patients with low EGFR-DLS and negative PD-L1 status, LPDL1+ patients with low EGFR-DLS and positive PD-L1 status, HPDL1− patients with high EGFR-DLS and negative PD-L1 status, HPDL1+ patients with high-EGFR-DLS and positive PD-L1 status. g The progression survival of patients relative the EGFR-DLS and different treatment using the combined TKI-treated and ICI-treated cohorts with adenocarcinoma (EGFR-DLS cutoff: 0.5). HDLS high EGFR-DLS, LDLS low EGFR-DLS. Comparisons of the above progression survival curves were performed with a two-sided log-rank test. h Proposed alternative guideline to use EGFR-DLS, PDL1_DLS, and ECOG PS score for decision support for NSCLC patients. ECOG PS Eastern Cooperative Oncology Group performance status.

References

    1. Bray F, et al. Global cancer statistics 2018: GLOBOCAN estimates of incidence and mortality worldwide for 36 cancers in 185 countries. CA Cancer J. Clin. 2018;68:394–424. doi: 10.3322/caac.21492. - DOI - PubMed
    1. Kim J, Chen D. Immune escape to PD-L1/PD-1 blockade: seven steps to success (or failure) Ann. Oncol. 2016;27:1492–1504. doi: 10.1093/annonc/mdw217. - DOI - PubMed
    1. Paez JG, et al. EGFR mutations in lung cancer: correlation with clinical response to gefitinib therapy. Science. 2004;304:1497–1500. doi: 10.1126/science.1099314. - DOI - PubMed
    1. Reck M, et al. Pembrolizumab versus chemotherapy for PD-L1–positive non–small-cell lung cancer. N. Engl. J. Med. 2016;375:1823–1833. doi: 10.1056/NEJMoa1606774. - DOI - PubMed
    1. Brahmer J, et al. Nivolumab versus docetaxel in advanced squamous-cell non–small-cell lung cancer. N. Engl. J. Med. 2015;373:123–135. doi: 10.1056/NEJMoa1504627. - DOI - PMC - PubMed

Publication types

MeSH terms