. 2020 Oct 16;11(1):5259.
doi: 10.1038/s41467-020-18988-3.

Whole-genome sequencing of acral melanoma reveals genomic complexity and diversity

Affiliations

Whole-genome sequencing of acral melanoma reveals genomic complexity and diversity

Felicity Newell et al. Nat Commun. .

Abstract

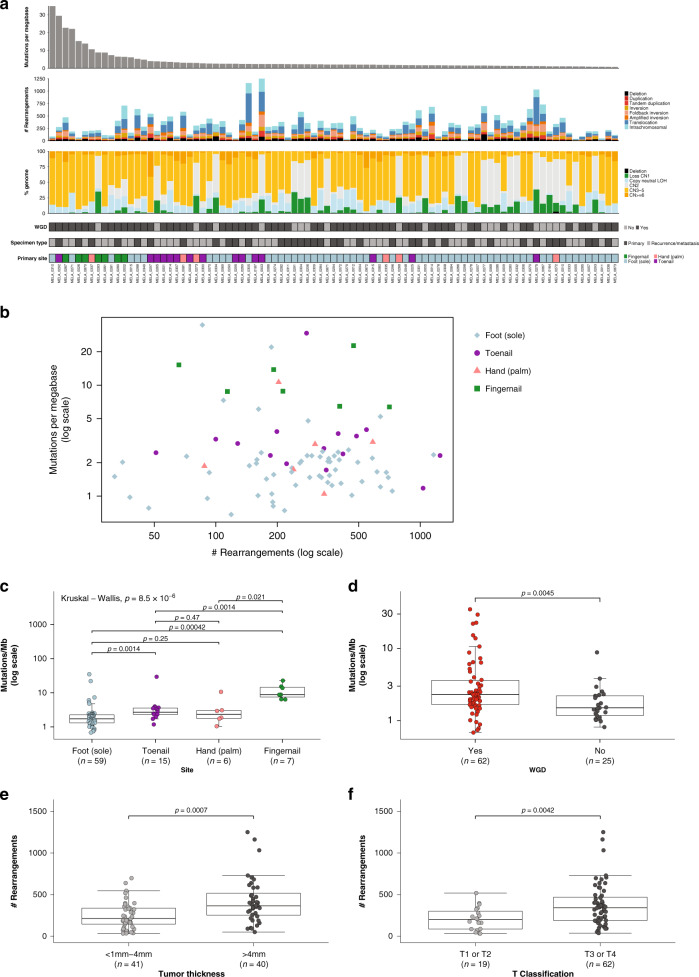
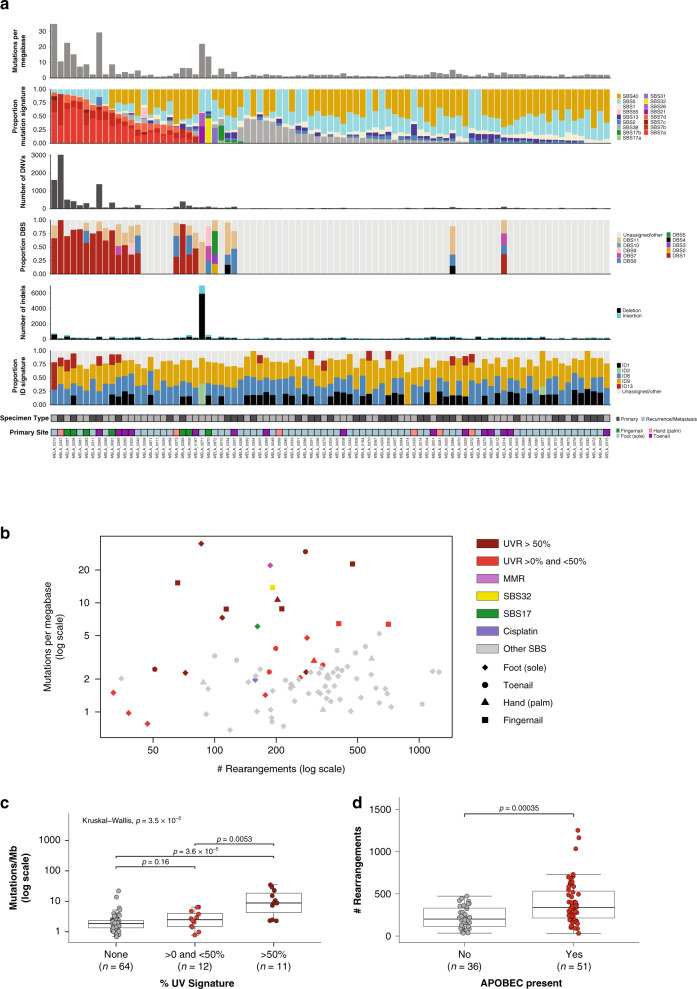
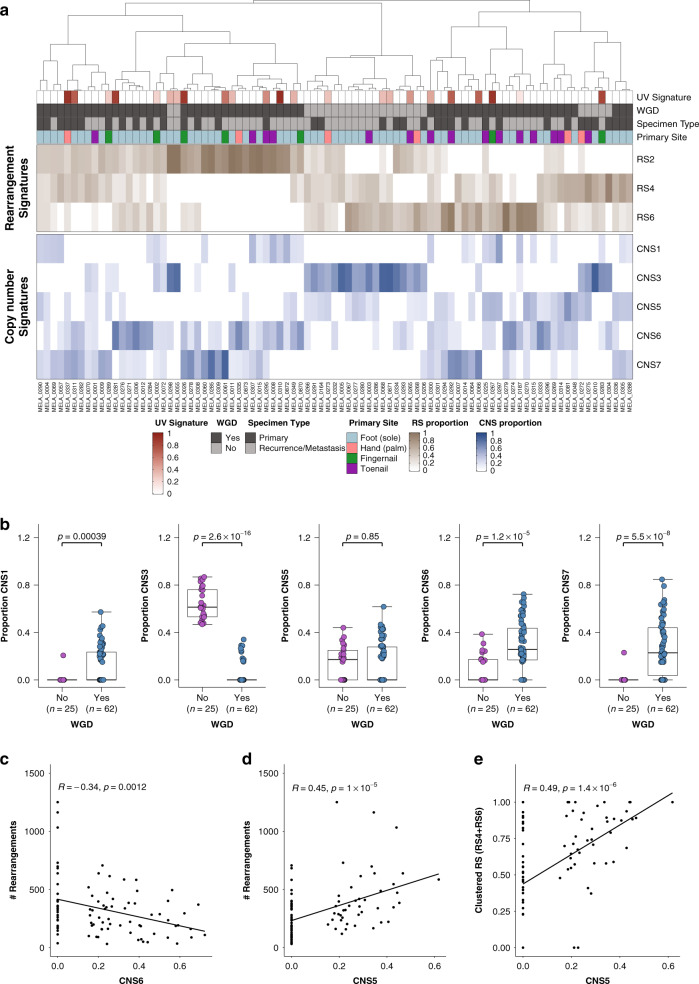
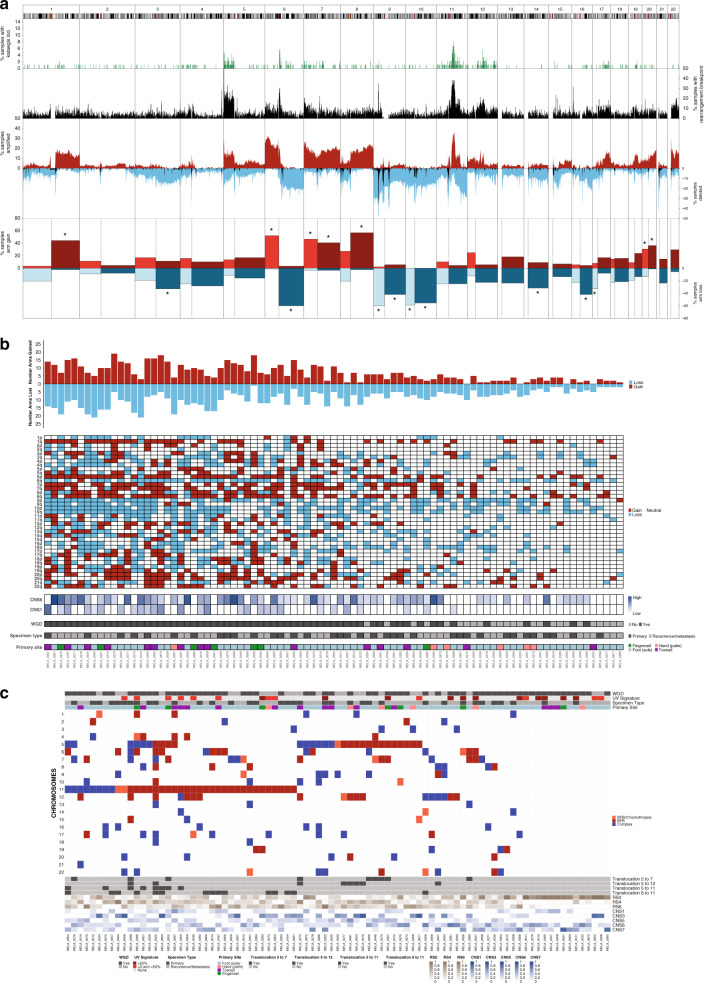
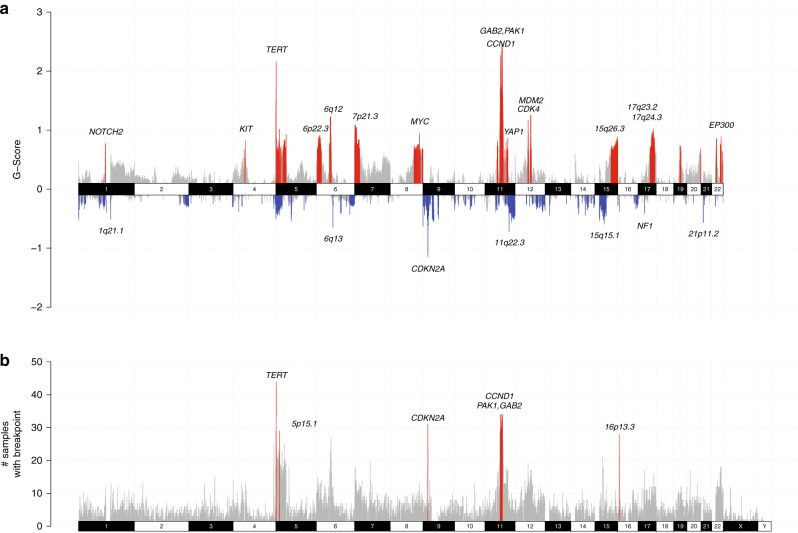
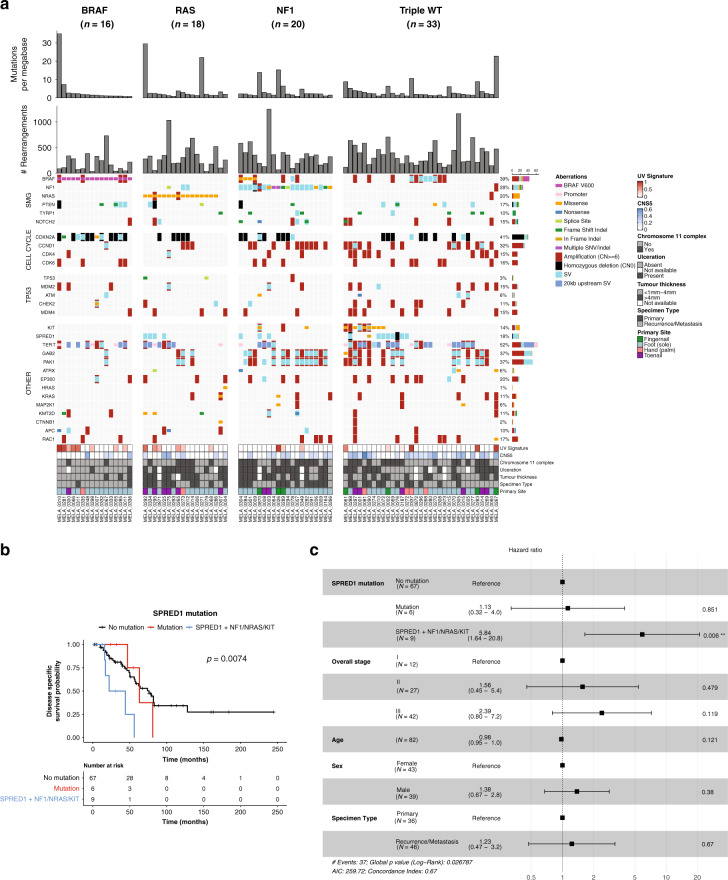
To increase understanding of the genomic landscape of acral melanoma, a rare form of melanoma occurring on palms, soles or nail beds, whole genome sequencing of 87 tumors with matching transcriptome sequencing for 63 tumors was performed. Here we report that mutational signature analysis reveals a subset of tumors, mostly subungual, with an ultraviolet radiation signature. Significantly mutated genes are BRAF, NRAS, NF1, NOTCH2, PTEN and TYRP1. Mutations and amplification of KIT are also common. Structural rearrangement and copy number signatures show that whole genome duplication, aneuploidy and complex rearrangements are common. Complex rearrangements occur recurrently and are associated with amplification of TERT, CDK4, MDM2, CCND1, PAK1 and GAB2, indicating potential therapeutic options.


Conflict of interest statement

J.V.P. and N.W. are founders and shareholders of genomiQa Pty Ltd, and members of its Board. R.A.S. has received fees for professional services from Merck Sharp & Dohme, GlaxoSmithKline Australia, Bristol-Myers Squibb, Dermpedia, Novartis Pharmaceuticals Australia Pty Ltd, Myriad, NeraCare and Amgen. G.V.L is consultant advisor for Aduro, Amgen, Array, BMS, MERCK MSD, Novartis, Pierre-Fabre, Roche, Sandoz. R.P.M.S has participated in advisory boards for MSD, Novartis and received speaking honoraria from BMS. J.F.T. has received honoraria for advisory board participation from Merck Sharpe Dohme Australia and Bristol Myers Squibb Australia. J.F.T. has also received honoraria and travel expenses from GSK and Provectus Inc. The remaining authors declare no competing interests.

Figures

Fig. 1
Fig. 1. Somatic variant burden.
a From top to bottom: mutations per megabase (where mutations includes single nucleotide (SNV), dinucleotide (DNV) and trinucleotide variants (TNV) and indels (small insertions and deletions); number and type of structural rearrangement variants; percent of the genome affected by copy number aberrations; whether a tumor has undergone whole genome doubling (WGD); specimen type (primary or recurrence/metastasis); site of primary tumor. b Scatterplot of mutations per megabase (log scale) versus structural rearrangement count (log scale) with points colored by site. c Box plot and overlaid scatterplot of mutation burden (SNV,DNV,TNV, small indel) across different primary sites. Kruskal–Wallis test was used to determine overall significance between signatures and pairwise Mann–Whitney U-tests to compare each pair of sites. The pairwise test p-values displayed are adjusted p-values after correction for multiple testing by FDR. d Box plot of number of mutations per megabase with or without whole genome doubling (Mann–Whitney U-test). e Box plot of number of rearrangements in samples with primary tumor thickness of >4 mm or <1–4 mm (Mann–Whitney U-test). f Box plot of number of rearrangements in samples with primary T Classification of T1 or T2 compared with T3 or T4 (Mann–Whitney U-test). In each box plot, the box boundaries show the first to third quartiles, the median is the center line and the whiskers represent 1.5 times the inter-quartile range.
Fig. 2
Fig. 2. Mutational signatures of point mutations, dinucleotide mutations and indels.
a From top to bottom: mutations per megabase, proportion of SBS mutational signatures; number of DNVs; proportion of DNV signatures (DBS); number of indels; proportion of indel signatures (ID), specimen type (primary or recurrence/metastasis); site of primary tumor. b Scatterplot of mutations per megabase versus structural rearrangement count with points colored by SBS signatures and shape indicating different primary sites. c Box plot of mutation burden (SNV,DNV,TNV, small indel) across samples with different proportions of UVR signature. Kruskal–Wallis test was used to determine overall significance between the groups and pairwise Mann–Whitney U-tests to compare each pair. The pairwise test p-values displayed are adjusted p-values after correction for multiple testing by FDR. d Box plot of number of rearrangements in samples that have evidence of an APOBEC signature or have no evidence of the signature (Mann–Whitney U-test). In each box plot, the box boundaries show the first to third quartiles, the median is the center line and the whiskers represent 1.5 times the inter-quartile range.
Fig. 3
Fig. 3. Rearrangement and copy number signatures.
a Unsupervised hierarchical clustering of rearrangements signatures (RS2, RS4, RS6) and copy number signatures (CNS1, CNS3, CNS5, CNS6, CNS7). b Box plots of the proportions of (from left to right) CNS1, CNS3, CNS5, CNS6, CNS7 in samples which have undergone whole genome duplication and those which have not. In each box plot, the box boundaries show the first to third quartiles, the median is the center line and the whiskers represent 1.5 times the inter-quartile range. c Pearson’s correlation of CNV signature CNS6 with numbers of rearrangements. d Pearson’s correlation of CNV signature CNS5 with numbers of rearrangements. e Pearson’s correlation of CNV signature CNS5 with proportion of clustered rearrangement signatures (RS4 and RS6).
Fig. 4
Fig. 4. Genomic complexity and chromosomal instability including aneuploidy and localized rearrangement events.
a Genomic summary of numerical and structural instability in 1 Mb regions across the genome. From top to bottom: % samples with kataegis loci (green), % samples with rearrangement breakpoints (black), % samples with amplification (CN ≥ 6, red), % samples with loss or deletion (CN0 or CN1 in blue) and % samples with deletion (CN0 only in black), % samples with chromosome arm gain (red) or loss (blue). Arms with more than 30% of samples affected are indicated with an asterisk. b Whole arm chromosomal gains or losses in each sample. For acrocentric samples, only the p arm is shown (chromosomes 13, 14, 15, 21, 22). The number of chromosome arms with a gain (red) or loss (blue). c Chromosomes with localized complex rearrangements including breakage-fusion-bridge and chromothripsis.
Fig. 5
Fig. 5. Recurrent focal regions of copy number and rearrangement breakpoints.
a Focal regions of recurrent amplification (red) and deletion (blue) as identified by GISTIC2. Genes and chromosomal cytobands of interest are annotated in the plot. b Regions of recurrent rearrangement breakpoints as identified by RETREAD. The plot shows 1 Mb windows that have 1 or more rearrangements. Bars in gray represent windows that are not significant (q > 0.2), and red bars indicate regions that are significantly enriched (q < 0.2).
Fig. 6
Fig. 6. Acral subclassifications and somatic aberrations in key acral melanoma genes.
a Overview of mutations divided by TCGA cutaneous melanoma molecular subclassifications of (left to right): BRAF hotspot (V600) mutated tumors; RAS hotspot mutated tumors; NF1 mutated tumors and Triple wild type (Triple WT). Genes are separated into: significantly mutated genes (from SNV/indel analysis), TP53, and cell cycle pathway genes, with the remaining genes grouped as Other. In the barcharts in the upper panels, each barchart represents data from n = 87 tumors, where each bar represents the number of mutations per megabase or number of rearrangements for a single tumor. b Kaplan–Meier plot of melanoma-specific survival with log-rank test in patients with or without SPRED1 mutations and co-occurring mutations in KIT, NRAS or NF1. c Forest plot for a multivariable Cox survival model based on SPRED1 mutations, overall stage, patient age at primary and sex.

References

    1. Bradford PT, Goldstein AM, McMaster ML, Tucker MA. Acral lentiginous melanoma: incidence and survival patterns in the United States, 1986–2005. Arch. Dermatol. 2009;145:427–434. doi: 10.1001/archdermatol.2008.609. - DOI - PMC - PubMed
    1. Chen YA, et al. Translational pathology, genomics and the development of systemic therapies for acral melanoma. Semin. Cancer Biol. 2019;61:149–157. doi: 10.1016/j.semcancer.2019.10.017. - DOI - PMC - PubMed
    1. Kuchelmeister C, Schaumburg-Lever G, Garbe C. Acral cutaneous melanoma in caucasians: clinical features, histopathology and prognosis in 112 patients. Br. J. Dermatol. 2000;143:275–280. doi: 10.1046/j.1365-2133.2000.03651.x. - DOI - PubMed
    1. Bello DM, et al. Prognosis of acral melanoma: a series of 281 patients. Ann. Surgical Oncol. 2013;20:3618–3625. doi: 10.1245/s10434-013-3089-0. - DOI - PubMed
    1. Sondermann W, et al. Initial misdiagnosis of melanoma located on the foot is associated with poorer prognosis. Medicine. 2016;95:e4332. doi: 10.1097/MD.0000000000004332. - DOI - PMC - PubMed

Publication types

MeSH terms