. 2020 Oct 16;11(1):5243.
doi: 10.1038/s41467-020-19080-6.

Whole blood immunophenotyping uncovers immature neutrophil-to-VD2 T-cell ratio as an early marker for severe COVID-19

Affiliations

Whole blood immunophenotyping uncovers immature neutrophil-to-VD2 T-cell ratio as an early marker for severe COVID-19

Guillaume Carissimo et al. Nat Commun. .

Abstract

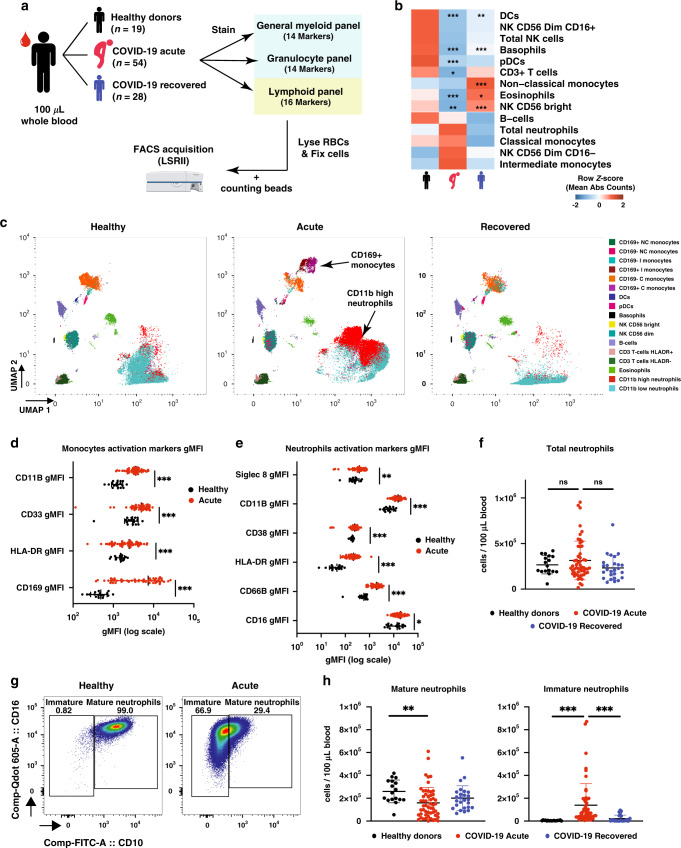
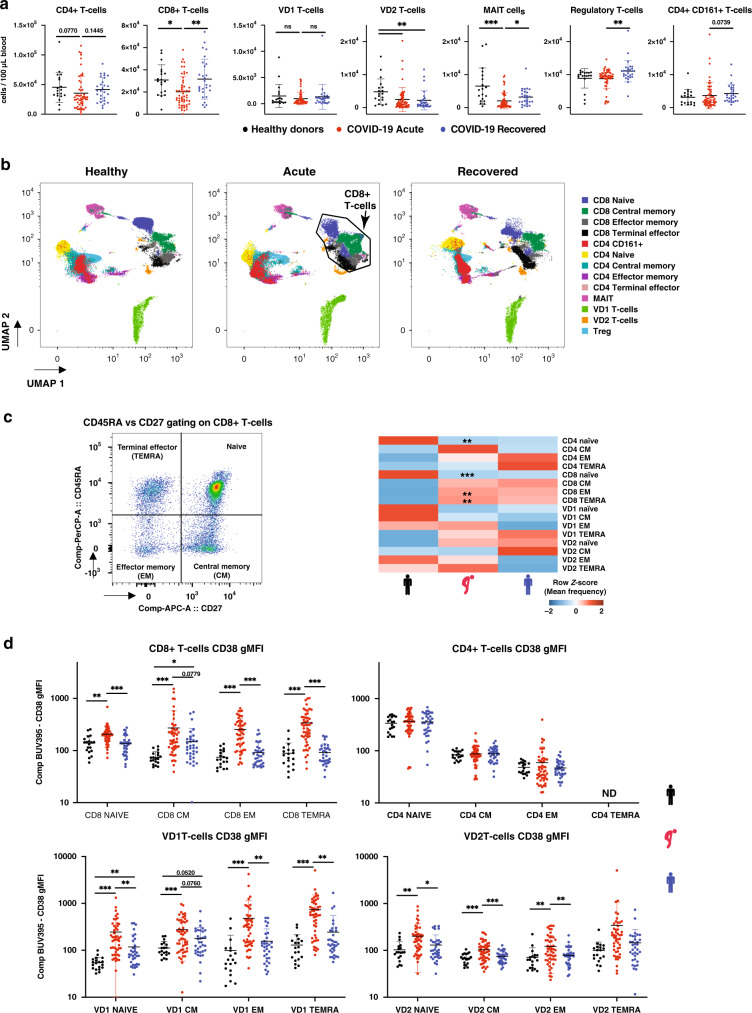
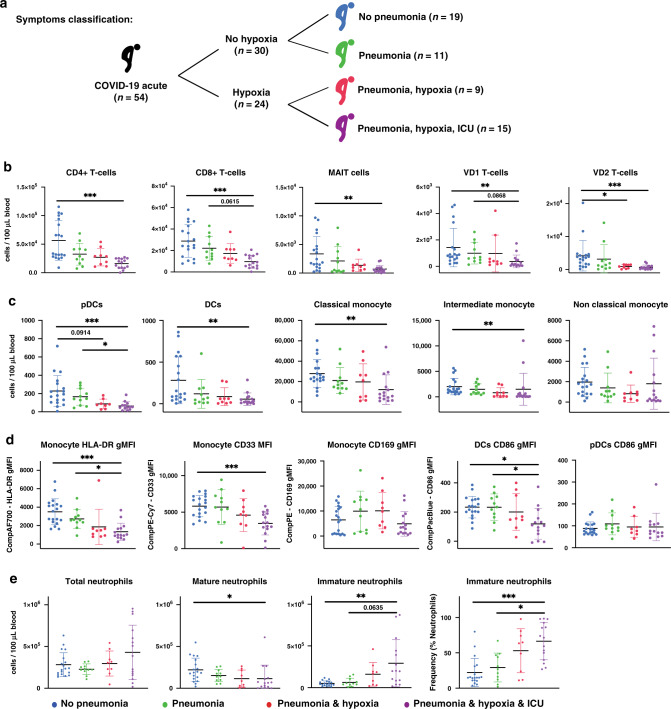
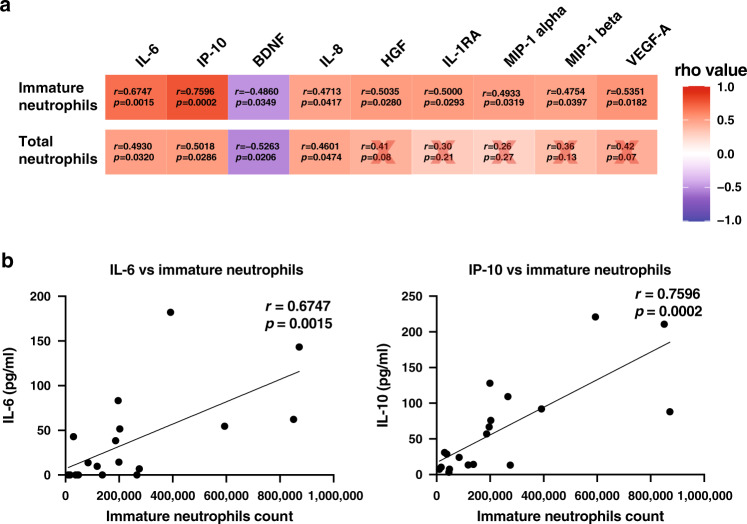
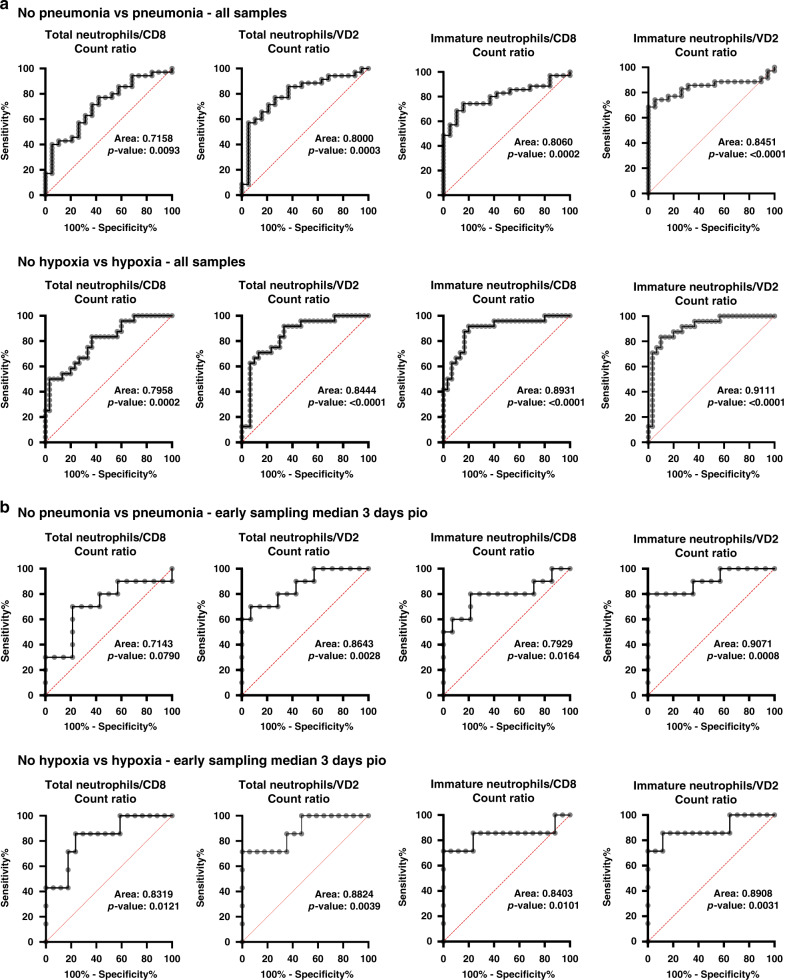
SARS-CoV-2 is the novel coronavirus responsible for the current COVID-19 pandemic. Severe complications are observed only in a small proportion of infected patients but the cellular mechanisms underlying this progression are still unknown. Comprehensive flow cytometry of whole blood samples from 54 COVID-19 patients reveals a dramatic increase in the number of immature neutrophils. This increase strongly correlates with disease severity and is associated with elevated IL-6 and IP-10 levels, two key players in the cytokine storm. The most pronounced decrease in cell counts is observed for CD8 T-cells and VD2 γδ T-cells, which both exhibit increased differentiation and activation. ROC analysis reveals that the count ratio of immature neutrophils to VD2 (or CD8) T-cells predicts pneumonia onset (0.9071) as well as hypoxia onset (0.8908) with high sensitivity and specificity. It would thus be a useful prognostic marker for preventive patient management and improved healthcare resource management.


Conflict of interest statement

The authors declare no competing interests.

Figures

Fig. 1
Fig. 1. SARS-CoV-2 infection induces a decrease in immune cells in peripheral blood.
a Schematic representation of flow cytometry workflow. b Heatmap representation of row z-score of mean absolute cell counts across the groups. Individual plots are shown in Supplementary Fig. 1A. c UMAP clustering of CD45+ immune cells. d Monocyte activation markers mean geometric MFI (gMFI). e Neutrophil activation markers mean geometric MFI (gMFI). f Absolute neutrophil counts. g Representative plot of mature and immature neutrophil gating strategy in healthy control or acute COVID-19 patient. h Mature (CD10+) and immature (CD10−) neutrophil Abs counts. Data presented are from individual human samples of healthy n = 17, acute n = 54 and recovered n = 26 common in flow panels a and c. Heatmap is presented as mean of z-score, scatter dot plots are presented with mean ± SD. Absolute counts were analysed by Kruskal–Wallis using Dunn correction for multiple comparison, gMFI was analysed by Brown-Forsythe and Welch ANOVA without multiple comparison. For heatmap, stars shown in acute column represent healthy vs acute comparison. Stars shown in recovered column represent acute vs recovered comparison. ns non-significant. *p < 0.05, **p < 0.01, ***p < 0.001. Data available in source data file, exact p-values are given in Supplementary Data 1.
Fig. 2
Fig. 2. SARS-CoV-2 infection induces general lymphopenia and CD8, VD1 and VD2 activation.
a Absolute counts of T-cell compartments in healthy donors, acute and recovered COVID-19 patient. b UMAP clustering of CD3+ cells. c left panel: CD45RA and CD27 gating strategy example on CD8+ T-cells; right panel: heatmap representation of mean frequencies of T-cell differentiation across the groups, individual plots given in Supplementary Fig. 2. d Changes in CD38 gMFI in naïve, CM, EM and TEMRA for CD8, CD4, VD1 and VD2 T-cells. ND indicates not determined since frequency of these compartment was too low for accurate gMFI measurement. Data presented are from individual human samples of healthy n = 19, acute n = 54 and recovered n = 28 from flow panel B. Absolute counts and frequency were analysed by Kruskal–Wallis using Dunn correction for multiple comparison, gMFI was analysed by Brown–Forsythe and Welch ANOVA using Dunnett T3 correction for multiple comparison. Scatter dot plots are presented as mean ± SD. For heatmaps, stars shown in acute column represent healthy vs acute comparison. Stars shown in recovered column represent acute vs recovered comparison. *p < 0.05, **p < 0.01, ***p < 0.001. Data available in source data file, exact p-values are given in Supplementary Data 1.
Fig. 3
Fig. 3. Patient symptoms are reflected in immune cell variations.
a Schematic representation of clinical symptoms in the patient cohort. b Absolute counts of T-cells across the severity. c Absolute counts of antigen presenting cells across the severity. d gMFI of activation markers on antigen presenting cells. e Absolute counts and frequency in neutrophil compartments. Data presented are from individual human acute COVID-19 patients n = 54 from panels a, b and c, separated according to clinical severity: no pneumonia n = 19, pneumonia no hypoxia n = 11, pneumonia with hypoxia no ICU n = 9, pneumonia with hypoxia with ICU n = 15. Scatter dot plots are presented with mean ± SD. Absolute counts and frequency were analysed by Kruskal–Wallis with Dunn multiple testing correction, gMFI was analysed by Brown–Forsythe and Welch ANOVA with Dunnett T3 multiple testing correction. *p < 0.05, **p < 0.01, ***p < 0.001. Data available in source data file, exact p-values are given in Supplementary Data 1.
Fig. 4
Fig. 4. Immature neutrophils correlate with several analytes in paired patient plasma.
a Spearman correlations between total neutrophils or immature neutrophils and plasma analytes. Red cross represents non-significant correlations. b Individual plots of Spearman correlations between immature neutrophil counts and IL-6 and IP-10. Line was drawn using simple linear regression. Data was analysed using non-parametric Spearman correlation two-tailed function in Prism. Data from n = 19 individual acute COVID-19 patients. Data available in source data file.
Fig. 5
Fig. 5. Immature neutrophil to VD2 T-cell ratio is an early prognosis marker for pneumonia and hypoxia symptoms.
a ROC curve analysis comparison was performed for pneumonia and hypoxia symptoms between absolute counts of total neutrophils to CD8 T-cell ratio, total neutrophils to VD2 T-cell, immature neutrophils to CD8 T-cell ratio, and immature neutrophils to VD2 T-cell ratio, n = 54 individual acute COVID-19 patient samples. b Similar analysis was performed on a subset of early samples from the 54 acute patients (n = 24 individual acute COVID-19 patients following the criteria: sampled at 1 to 7 days pio. Median of this subset is 3 days pio). ROC curve was analysed using Wilson/Brown method, 95% confidence interval and standard error for panel A are given in Supplementary Data 1 and for panel B are given in Table 1. Data available in source data file.

References

    1. Cohen J, Normile D. New SARS-like virus in China triggers alarm. Science. 2020;367:234–235. doi: 10.1126/science.367.6475.234. - DOI - PubMed
    1. Guan WJ, et al. Clinical characteristics of coronavirus disease 2019 in China. N. Engl. J. Med. 2020;382:1708–1720. doi: 10.1056/NEJMoa2002032. - DOI - PMC - PubMed
    1. Wu Z, McGoogan JM. Characteristics of and important lessons from the coronavirus disease 2019 (COVID-19) outbreak in China: summary of a report of 72314 cases from the Chinese Center for disease control and prevention. JAMA. 2020;323:1239–1242. doi: 10.1001/jama.2020.2648. - DOI - PubMed
    1. Wang D, et al. Clinical characteristics of 138 hospitalized patients with 2019 novel coronavirus-infected pneumonia in Wuhan, China. JAMA. 2020;323:1061–1069. doi: 10.1001/jama.2020.1585. - DOI - PMC - PubMed
    1. Chen N, et al. Epidemiological and clinical characteristics of 99 cases of 2019 novel coronavirus pneumonia in Wuhan, China: a descriptive study. Lancet. 2020;395:507–513. doi: 10.1016/S0140-6736(20)30211-7. - DOI - PMC - PubMed

Publication types

MeSH terms