. 2020 Dec;9(4):1029-1041.
doi: 10.1007/s40121-020-00352-z. Epub 2020 Oct 16.

Chest CT Features of 182 Patients with Mild Coronavirus Disease 2019 (COVID-19) Pneumonia: A Longitudinal, Retrospective and Descriptive Study

Affiliations

Chest CT Features of 182 Patients with Mild Coronavirus Disease 2019 (COVID-19) Pneumonia: A Longitudinal, Retrospective and Descriptive Study

Huaping Liu et al. Infect Dis Ther. 2020 Dec.

Abstract

Introduction: The evolution of computed tomography (CT) findings in patients with mild coronavirus disease 2019 (COVID-19) pneumonia has not been described in detail. A large-scale longitudinal study is urgently required.

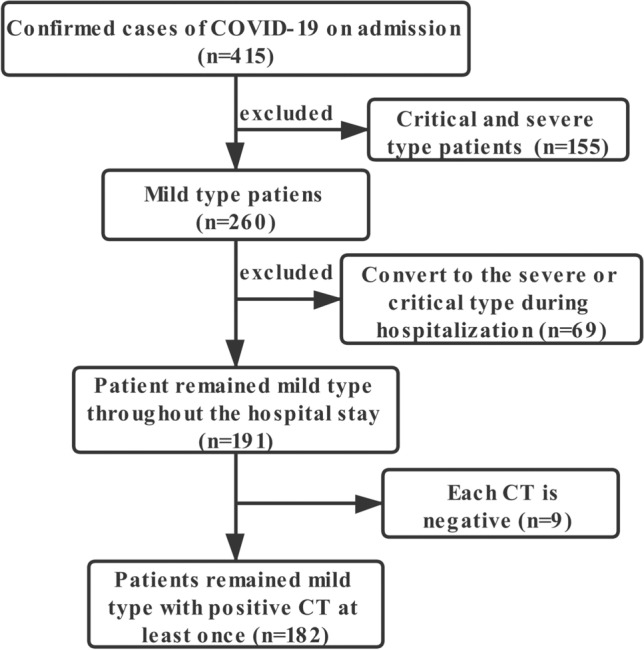
Methods: We analyzed 606 CT scans of 182 patients. The dynamic evolution of CT scores was evaluated using two staging methods: one was divided into 10 periods based on decile intervals, and the other was one stage per week. Moreover, the latter was used to evaluate the dynamic evolution of imaging performance. A published severity scoring system was used to compare findings of the two methods.

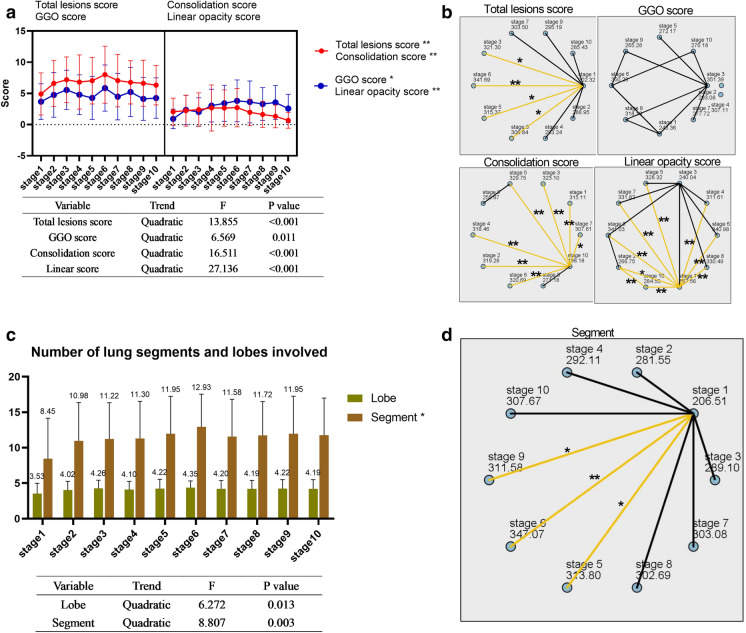
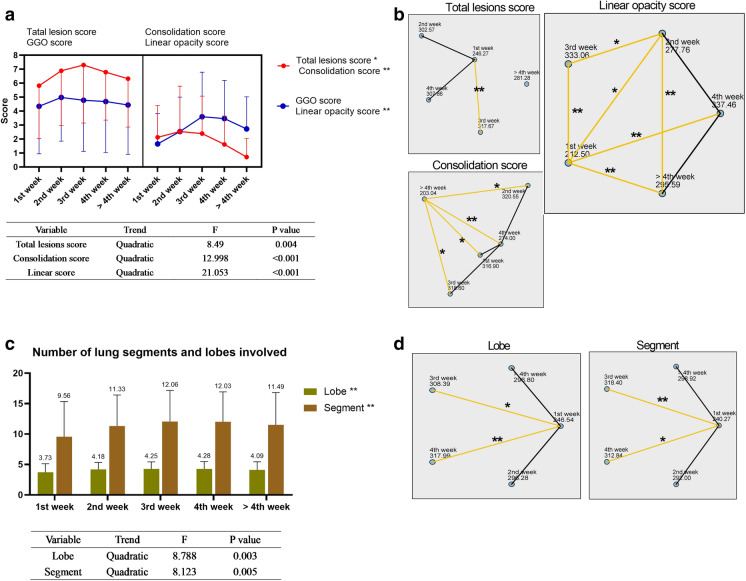
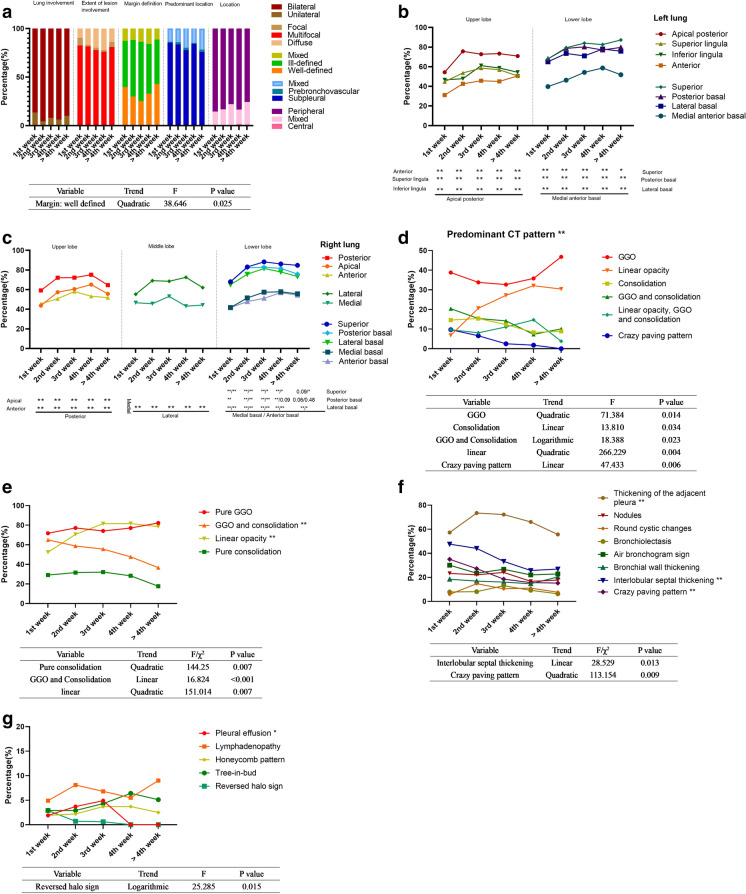
Results: In the dynamic evolution of 10 stages, the total lesion CT score peaked during stage 3 (9-11 days) and stage 6 (17-18 days), with scores = 7.19 ± 3.66 and 8.00 ± 4.57, respectively. The consolidation score peaked during stage 6 (17-18 days; score = 2.72 ± 3.07). In contrast, when a 1-week interval was used and time was divided into five stages, the total lesion score peaked during week 3 (score = 7.3 ± 4.15). The consolidation score peaked during week 2 (score = 2.54 ± 3.25). The predominant CT patterns differed significantly during each stage (P < 0.01). Ground-glass opacities (GGO), with an increased trend during week 3 and beyond, was the most common pattern in each stage (33-46%). The second most common patterns during week 1 were GGO and consolidation (24%). The linear opacity pattern with an increased trend was the second most common pattern during week 2 and beyond (21-32%).

Conclusions: The total lesion score of mild COVID-19 pneumonia peaked 17-18 days after disease onset. The consolidation scores objectively reflected the severity of the lung involvement compared with total lesion scores. Each temporal stage of mild COVID-19 pneumonia mainly manifested as GGO pattern. Moreover, good prognosis may be associated with increases in the proportions of the GGO and linear opacity patterns during the later stage of disease.

Keywords: COVID-19; Pneumonia; SARS-CoV-2; Tomography; X-ray computed.


Figures

Fig. 1
Fig. 1
Screening process of 182 patients with mild coronavirus disease 2019
Fig. 2
Fig. 2
Predominant CT patterns of mild COVID-19 pneumonia. a GGO. b Consolidation. c GGO and consolidation. d Linear opacity. e Linear opacity, GGO, and consolidation. f Crazy-paving
Fig. 3
Fig. 3
Dynamic changes of CT scores and numbers of lung segments and lung lobes involved during the 10 stages described in “Methods”. a The scores for total lesion, consolidation, linear opacity, and GGO of each stage and the significant results of trend tests are shown in the table below. b Statistical analysis of pairwise comparisons of CT scores of 10 stages. c The numbers of lung segments and lung lobes involved during the 10 stages and significant results of trend tests are shown in the table below. d Pairwise comparison of the numbers of involved lung lobes and lung segments during the 10 stages. Stage 1, 1–5 days; stage 2, 6–8 days; stage 3, 9–11 days; stage 4, 12–14 days; stage 5, 15–16 days; stage 6, 17–18 days; stage 7, 19–21 days; stage 8, 22–25 days; stage 9, 26–30 days; stage 10, more than 30 days. GGO ground glass opacity; *P < 0.05; **P < 0.01
Fig. 4
Fig. 4
Dynamic changes of CT scores and the numbers of lung segments and lung lobes involved in five stages. a The total lesion, consolidation, linear opacity, and GGO scores during each stage. Significant results of trend tests are shown in the table below. b Statistical analysis of pairwise comparisons of CT scores during five stages. c The numbers of lung segments and lung lobes involved during stages and significant results of trend tests are shown in the table below. d Pairwise comparison of the numbers of involved lung lobes and lung segments during 10 stages. GGO ground glass opacity; *P < 0.05; **P < 0.01
Fig. 5
Fig. 5
Imaging manifestations of 182 patients during five stages. a Lung involvement, extent of lesion involvement, margin definition, predominant location, and distribution of the lesions during each stage. b Proportion of involvement of each lung segment of the left lung. c Proportion of involvement of each lung segment of the right lung. d Percentages of predominant patterns in each stage and significant results of trend tests are shown in the table below. e Percentages of pure ground glass opacity (GGO), pure consolidation, GGO and consolidation and linear opacity, and significant results of trend tests are shown in the table below. f The percentages during each stage of thickening pleura, nodules, round cystic changes, bronchiolectasis, air bronchogram sign, bronchial wall thickening, interlobular septal thickening, and crazy-paving pattern. Significant results of trend tests are shown in the table below. g Percentages during each stage of pleural effusion, lymphadenopathy, honeycomb pattern, tree-in-bud and reversed halo sign. Significant results of trend tests are shown in the table below. GGO ground glass opacity; *P < 0.05; **P < 0.01

Similar articles

Cited by

References

    1. World Health Organization Coronavirus Disease (COVID-19) Dashboard. 2020. https://covid19.who.int/. Accessed 7 July 2020.
    1. Wu Z, McGoogan JM. Characteristics of and important lessons from the coronavirus disease 2019 (COVID-19) outbreak in China: summary of a report of 72314 cases from the Chinese Center for Disease Control and Prevention. JAMA. 2020;323(13):1239–42. - PubMed
    1. Ai T, Yang Z, Hou H, et al. Correlation of chest CT and RT-PCR testing in coronavirus disease 2019 (COVID-19) in China: a report of 1014 cases. Radiology. 2019;2020:200642. - PMC - PubMed
    1. Liang T, Liu Z, Wu CC, et al. Evolution of CT findings in patients with mild COVID-19 pneumonia. Eur Radiol. 2020;30(9):4865–73. - PMC - PubMed
    1. Wang YC, Luo H, Liu S, et al. Dynamic evolution of COVID-19 on chest computed tomography: experience from Jiangsu Province of China. Eur Radiol. 2020. 10.1007/s00330-020-06976-6. - PMC - PubMed

LinkOut - more resources