

Health System-Based Unhealthy Alcohol Use Screening and Treatment Comparing Demographically Matched Participants With and Without HIV
- PMID: 33067802
- PMCID: PMC7725961
- DOI: 10.1111/acer.14481
Health System-Based Unhealthy Alcohol Use Screening and Treatment Comparing Demographically Matched Participants With and Without HIV
Abstract
Background: Unhealthy alcohol use among persons living with HIV (PLWH) is linked to significant morbidity, and use of alcohol services may differ by HIV status. Our objective was to compare unhealthy alcohol use screening and treatment by HIV status in primary care.
Methods: Cohort study of adult (≥18 years) PLWH and HIV-uninfected participants frequency matched 20:1 to PLWH by age, sex, and race/ethnicity who were enrolled in a large integrated healthcare system in the United States, with information ascertained from an electronic health record. Outcomes included unhealthy alcohol screening, prevalence, provider-delivered brief interventions, and addiction specialty care visits. Other predictors included age, sex, race/ethnicity, neighborhood deprivation index, depression, smoking, substance use disorders, Charlson comorbidity index, prior outpatient visits, insurance type, and medical facility. Cox proportional hazards models were used to compute hazard ratios (HR) for the outcomes of time to unhealthy alcohol use screening and time to first addiction specialty visit. Poisson regression with robust standard errors was used to compute prevalence ratios (PR) for other outcomes.
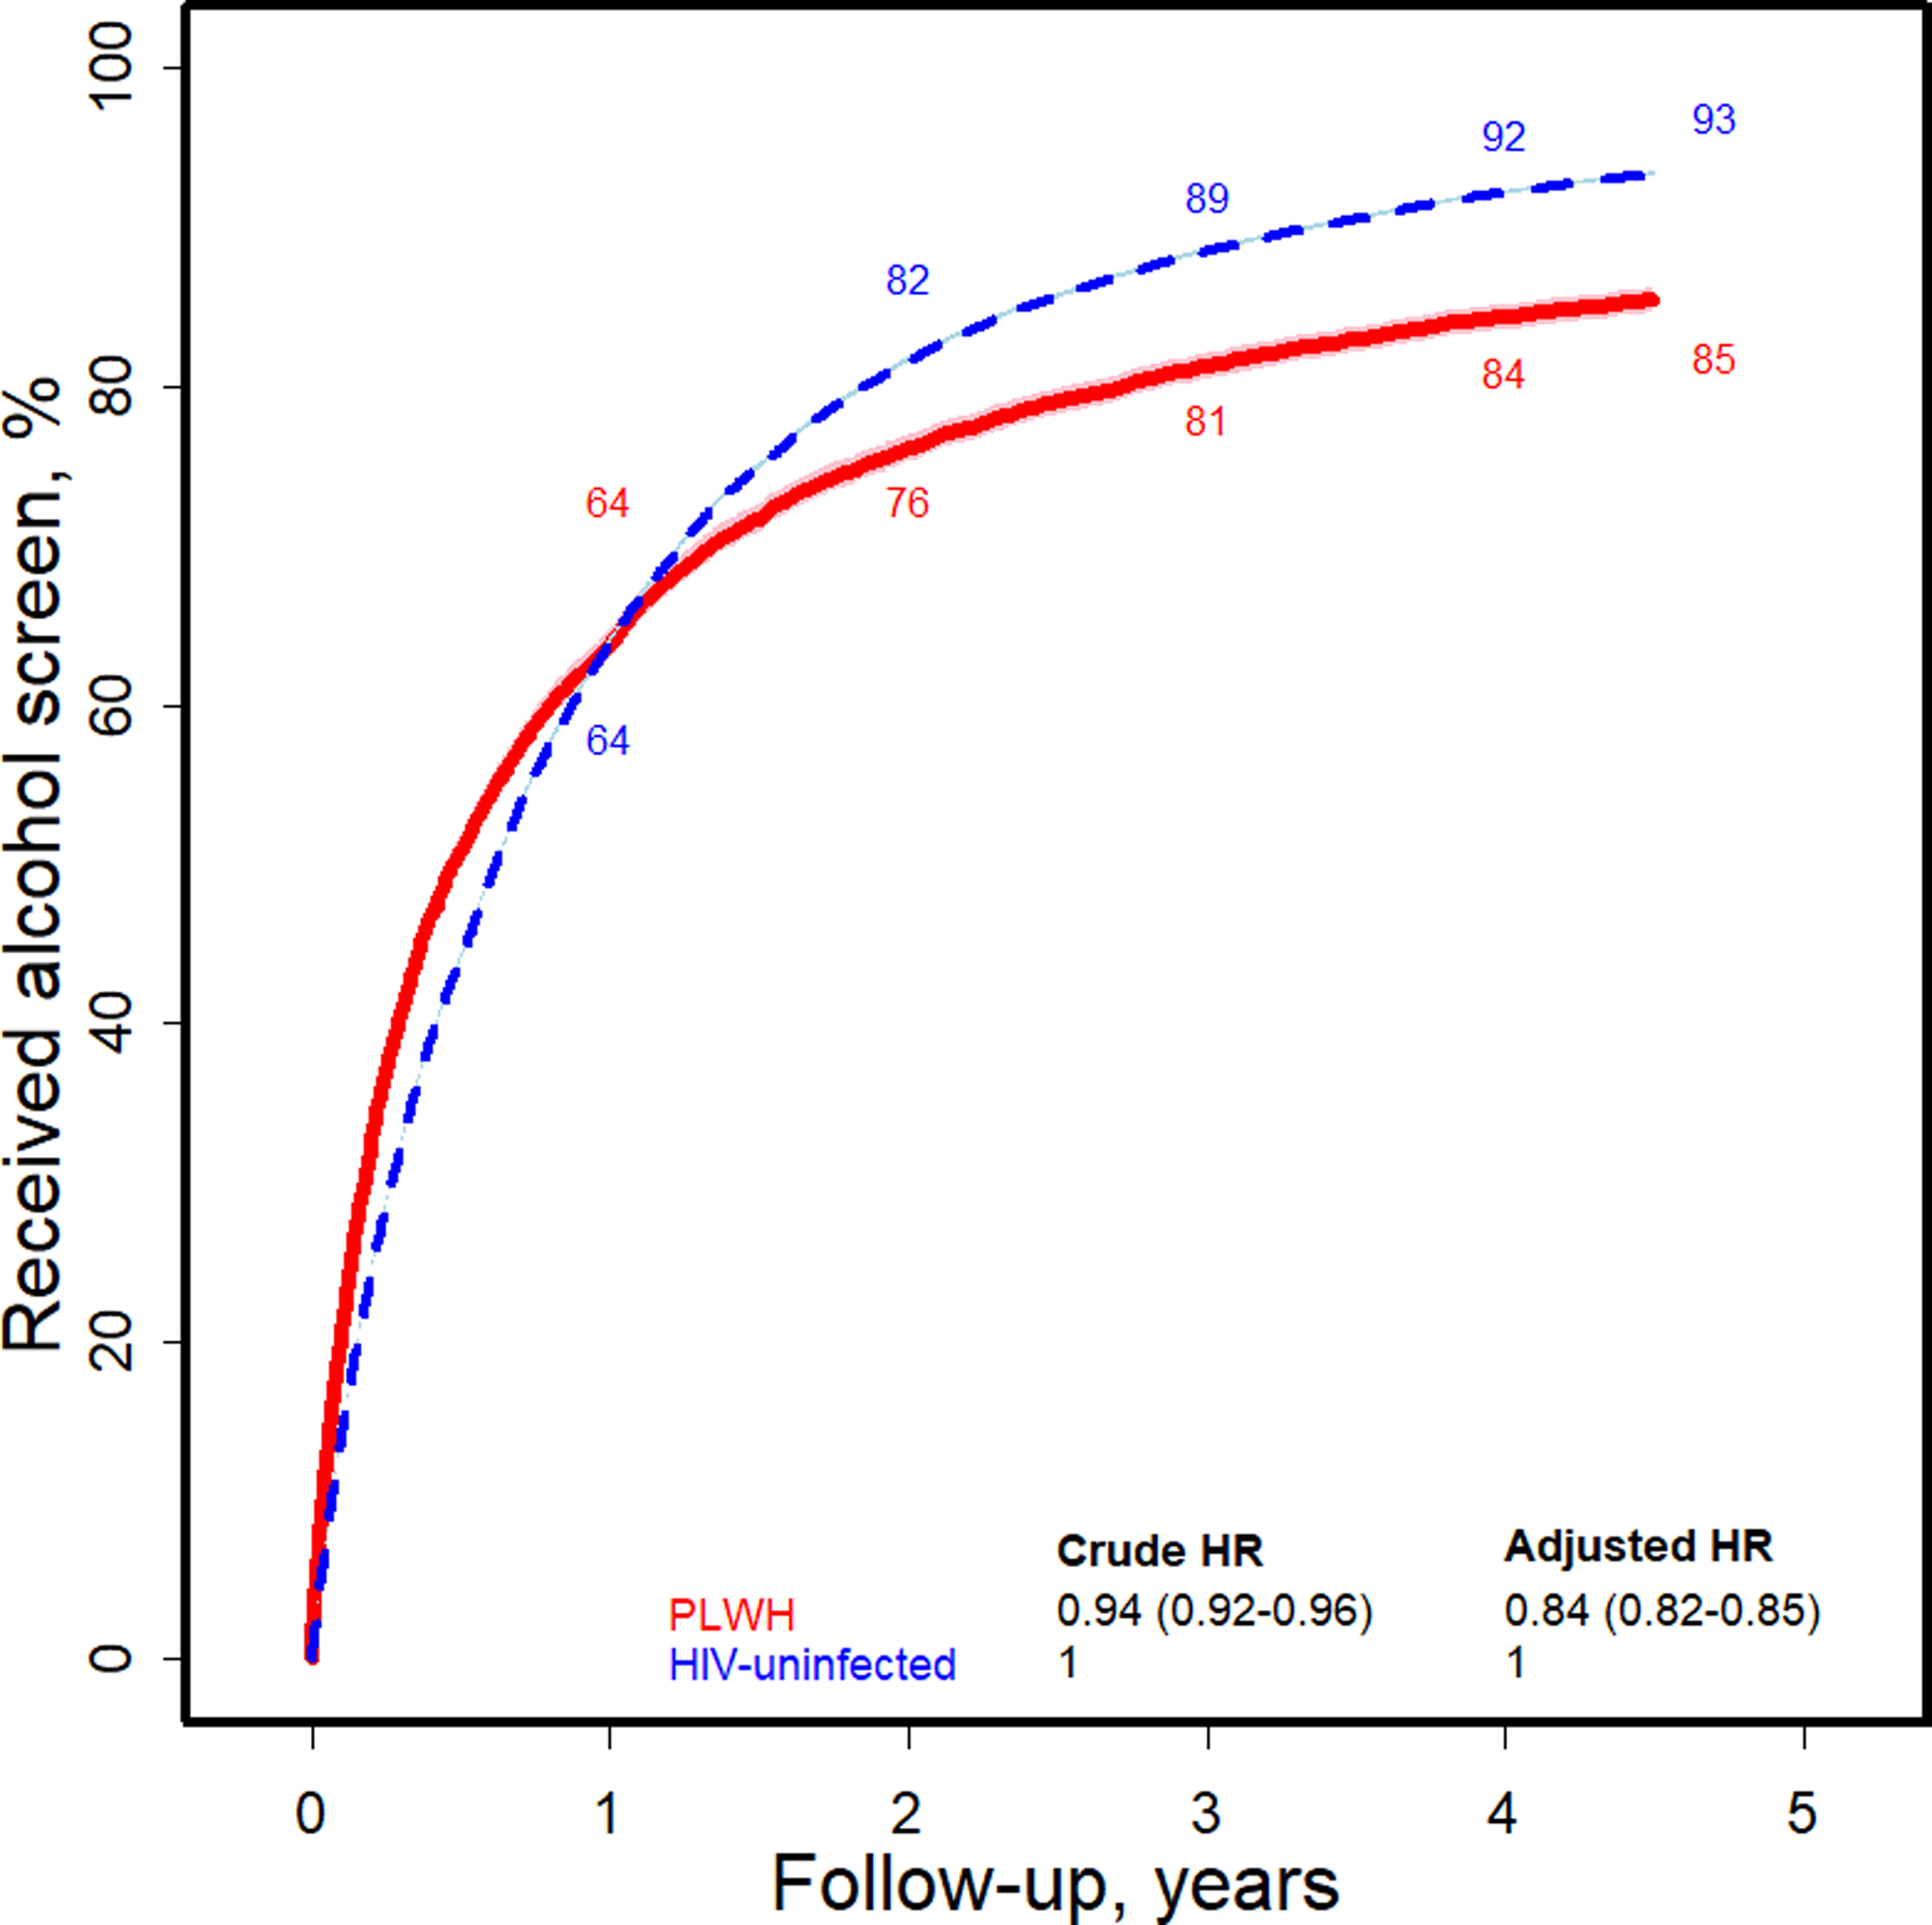
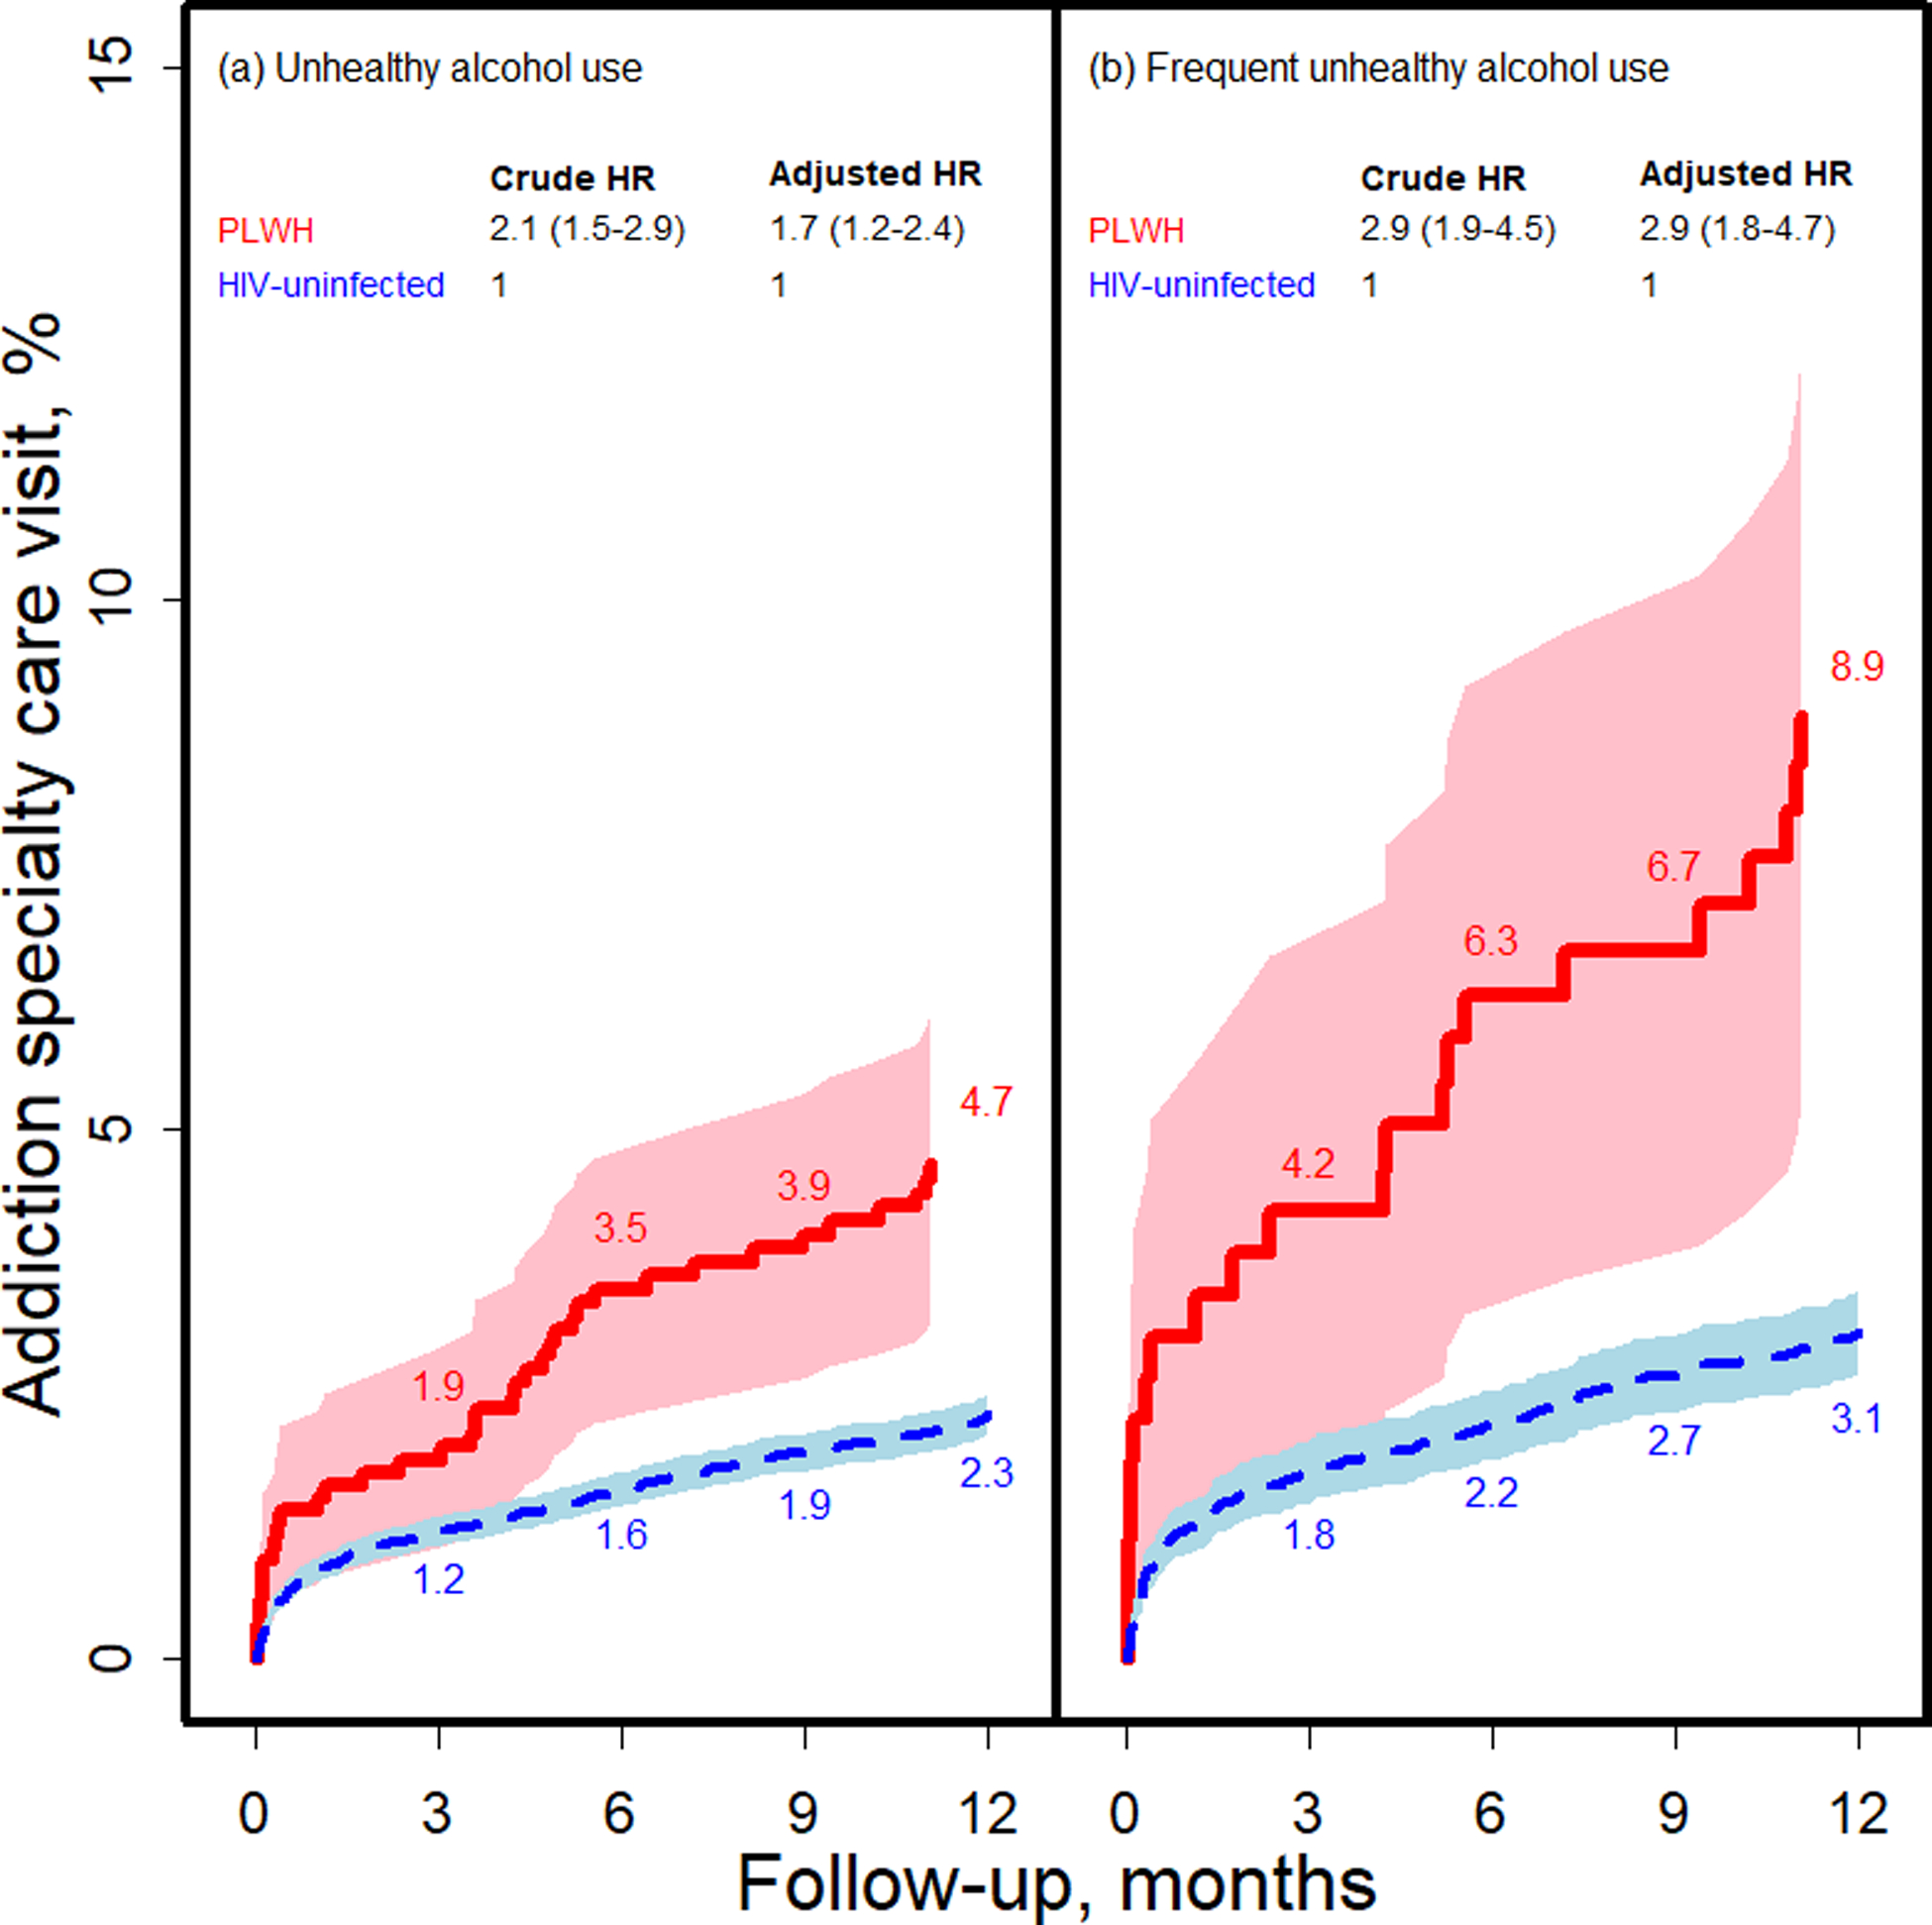
Results: 11,235 PLWH and 227,320 HIV-uninfected participants were included. By 4.5 years after baseline, most participants were screened for unhealthy alcohol use (85% of PLWH and 93% of HIV-uninfected), but with a lower rate among PLWH (adjusted HR 0.84, 95% CI 0.82 to 0.85). PLWH were less likely, compared with HIV-uninfected participants, to report unhealthy drinking among those screened (adjusted PR 0.74, 95% CI 0.69 to 0.79), and among those who screened positive, less likely to receive brief interventions (adjusted PR 0.82, 95% CI 0.75 to 0.90), but more likely (adjusted HR 1.7, 95% CI 1.2 to 2.4) to have an addiction specialty visit within 1 year.
Conclusions: Unhealthy alcohol use was lower in PLWH, but the treatment approach by HIV status differed. PLWH reporting unhealthy alcohol use received less brief interventions and more addiction specialty care than HIV-uninfected participants.
Keywords: Alcohol Use; Epidemiology; HIV; Primary Care; Substance Abuse.
© 2020 by the Research Society on Alcoholism.
Figures
References
-
- BONACINI M 2011. Alcohol use among patients with HIV infection. Ann Hepatol, 10, 502–7. - PubMed
-
- BRADLEY KA, WILLIAMS EC, ACHTMEYER CE, VOLPP B, COLLINS BJ & KIVLAHAN DR 2006. Implementation of evidence-based alcohol screening in the Veterans Health Administration. Am J Manag Care, 12, 597–606. - PubMed
Publication types
MeSH terms
Grants and funding
LinkOut - more resources
Full Text Sources
Medical
Research Materials
