. 2020 Dec;104(6):1698-1711.
doi: 10.1111/tpj.15031. Epub 2020 Nov 18.

Chromosome reciprocal translocations have accompanied subspecies evolution in bananas

Affiliations

Chromosome reciprocal translocations have accompanied subspecies evolution in bananas

Guillaume Martin et al. Plant J. 2020 Dec.

Abstract

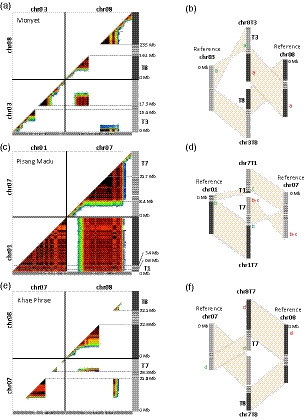
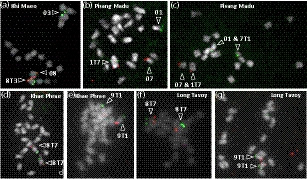
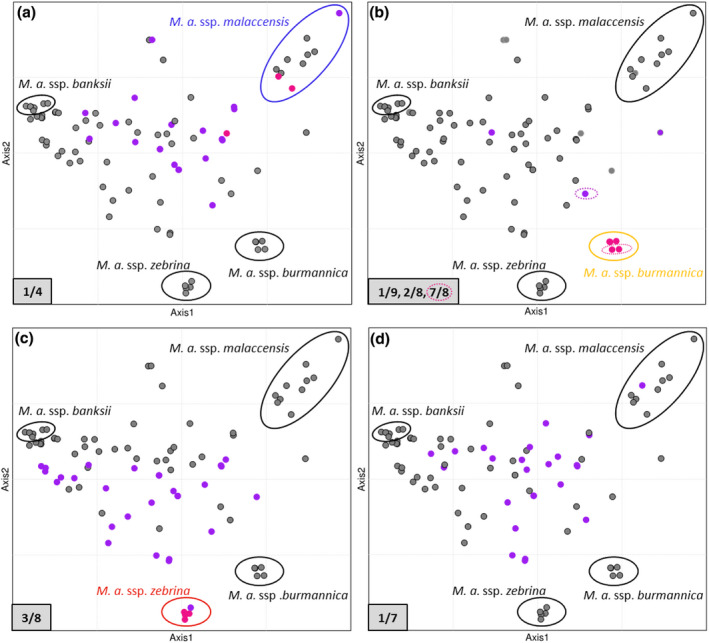
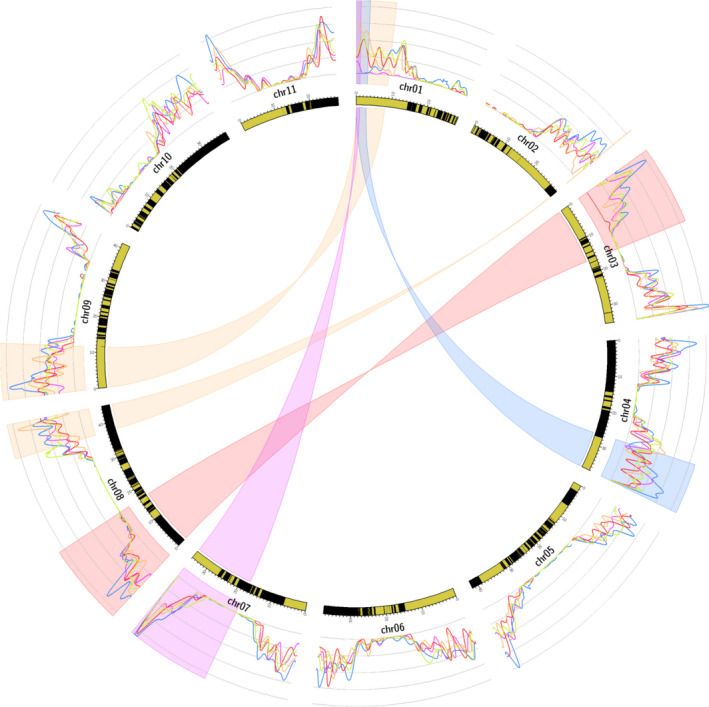
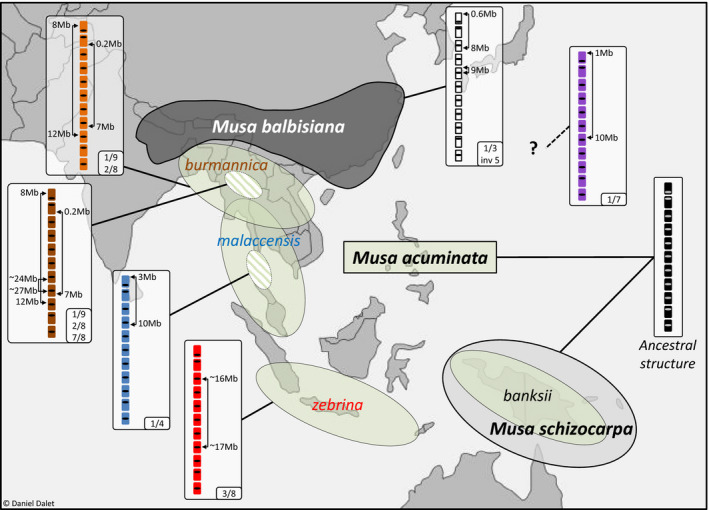
Chromosome rearrangements and the way that they impact genetic differentiation and speciation have long raised questions from evolutionary biologists. They are also a major concern for breeders because of their bearing on chromosome recombination. Banana is a major crop that derives from inter(sub)specific hybridizations between various once geographically isolated Musa species and subspecies. We sequenced 155 accessions, including banana cultivars and representatives of Musa diversity, and genotyped-by-sequencing 1059 individuals from 11 progenies. We precisely characterized six large reciprocal translocations and showed that they emerged in different (sub)species of Musa acuminata, the main contributor to currently cultivated bananas. Most diploid and triploid cultivars analyzed were structurally heterozygous for 1 to 4 M. acuminata translocations, highlighting their complex origin. We showed that all translocations induced a recombination reduction of variable intensity and extent depending on the translocations, involving only the breakpoint regions, a chromosome arm, or an entire chromosome. The translocated chromosomes were found preferentially transmitted in many cases. We explore and discuss the possible mechanisms involved in this preferential transmission and its impact on translocation colonization.

Keywords: Musa; chromosome segregation; genome evolution; reciprocal translocation; recombination.


Conflict of interest statement

The authors declare no conflict of interest.

Figures

Figure 1
Figure 1
Characterization of reciprocal translocations through genetic analysis. (a, c, e) Dot‐plots with pairwise marker genetic linkage in the analyzed accession along the 11 Musa acuminata reference chromosomes (V2). Marker linkage is represented by a color gradient from red (strong) to dark blue (weak). Gray boxed arrows at the bottom represent scaffolds from the V2M. acuminatareference sequence. (a) Monyet accession, PCMo population. (c) Pisang Madu accession, Magda population. (e) Khae Phrae, PMK population. (b, d, f) Schematic representation of the inferred chromosome structures. Gray hatched boxes indicate the translocation breakpoint regions. Different green and red lowercase letters refer to the position and color of detection of the bacterial artificial chromosomes (BACs) used for BAC‐fluorescence in situ hybridization in Figure 2.
Figure 2
Figure 2
Characterization of reciprocal translocations through cytogenetic analysis. Bacterial artificial chromosome (BAC)‐fluorescence in situ hybridization on chromosomes at metaphase. Accession names are indicated on the pictures: (a) Khi Maeo, (b and c) Pisang Madu, (d and e) Khae Phrae, (f and g) Long Tavoy. Chromosomes were counterstained using 4′‐6‐diamidino‐2‐phenylindole (shown in gray). Locations of the BAC on Musa acuminata reference and translocated chromosome structures are indicated in Figure 1; their names and precise positions are provided in Table S3. Arrows point to the detected reference and translocated chromosome structures.
Figure 3
Figure 3
Translocation distributions in diploid Musa acuminata germplasm. Factorial analysis was performed on 34 wild M. acuminata accessions with projection of 58 diploid cultivars and hybrids along the synthetic axes (the first two axes are represented). Accessions homozygous or heterozygous for a translocation are represented by pink and purple dots, respectively. (a) Translocation 1/4. (b) Translocations 1/9 and 2/8. Translocation 7/8 is indicated by hashed circles. (c) Translocation 3/8. (d) Translocation 1/7. Note that some dots are superposed; for more details, see Figure S3.
Figure 4
Figure 4
Circos representing the impact of translocations on recombination in structurally heterozygous accessions. Highlighted regions indicate the translocated chromosome segments for the 3/8 (red), 1/7 (purple), 1/4 (blue), and 1/9 and 2/8 (orange) translocations. The curves represent the average recombination rate for heterozygous parents for the 3/8 translocation (red), 1/7 translocation (purple), 1/4 translocation (blue), and 1/9 and 2/8 translocations (orange). The green curve represents structurally homozygous parents. The average recombination rate, calculated as the number of observed recombinations in 1‐Mb windows divided by the number of individuals with at least two markers in these regions, was obtained from the markers corrected matrix and by grouping all parents structurally heterozygous for the same structure. The inner circle represents theM.acuminatareference genome sequence V2, with black and yellow boxes representing the successive scaffolds.
Figure 5
Figure 5
Geographical distribution of the main Musa species and subspecies involved in cultivated bananas and the associated translocated chromosome structures. Areas indicate the geographical distribution of the main Musa species and subspecies according to Perrier et al. (2011). Boxes represent structural rearrangements found in these species and subspecies. Hatched circles indicate that translocations were identified in part of the subspecies but do not point to specific regions. The outline map was modified from http://www.histgeo.ac‐aix‐marseille.fr/ancien_site/carto.

References

    1. Baker, R.J. and Bickham, J.W. (1986) Speciation by monobrachial centric fusions. Proc. Natl. Acad. Sci. 83, 8245–8248. - PMC - PubMed
    1. Baurens, F.‐C. , Martin, G. , Hervouet, C. et al (2019) Recombination and Large Structural Variations Shape Interspecific Edible Bananas Genomes. Mol. Biol. Evol. 36, 97–111. - PMC - PubMed
    1. Belser, C. , Istace, B. , Denis, E. et al (2018) Chromosome‐scale assemblies of plant genomes using nanopore long reads and optical maps. Nat. Plants, 4, 879. - PubMed
    1. Birchler, J.A. (2013) Aneuploidy in plants and flies: the origin of studies of genomic imbalance. Semin. Cell Dev. Biol. 24, 315–319. - PubMed
    1. Britton‐Davidian, J. , Catalan, J. , da Ramalhinho, M. , Ganem, G. , Auffray, J.‐C. , Capela, R. , Biscoito, M. , Searle, J.B. and da Luz Mathias, M. (2000) Rapid chromosomal evolution in island mice. Nature, 403, 158. - PubMed

Publication types