

The Effect of Chronic Ethanol Exposure and Thiamine Deficiency on Myelin-related Genes in the Cortex and the Cerebellum
- PMID: 33067870
- PMCID: PMC7725981
- DOI: 10.1111/acer.14484
The Effect of Chronic Ethanol Exposure and Thiamine Deficiency on Myelin-related Genes in the Cortex and the Cerebellum
Abstract
Background: Long-term alcohol consumption has been linked to structural and functional brain abnormalities. Furthermore, with persistent exposure to ethanol (EtOH), nutrient deficiencies often develop. Thiamine deficiency is a key contributor to alcohol-related brain damage and is suspected to contribute to white matter pathology. The expression of genes encoding myelin proteins in several cortical brain regions is altered with EtOH exposure. However, there is limited research regarding the impact of thiamine deficiency on myelin dysfunction.
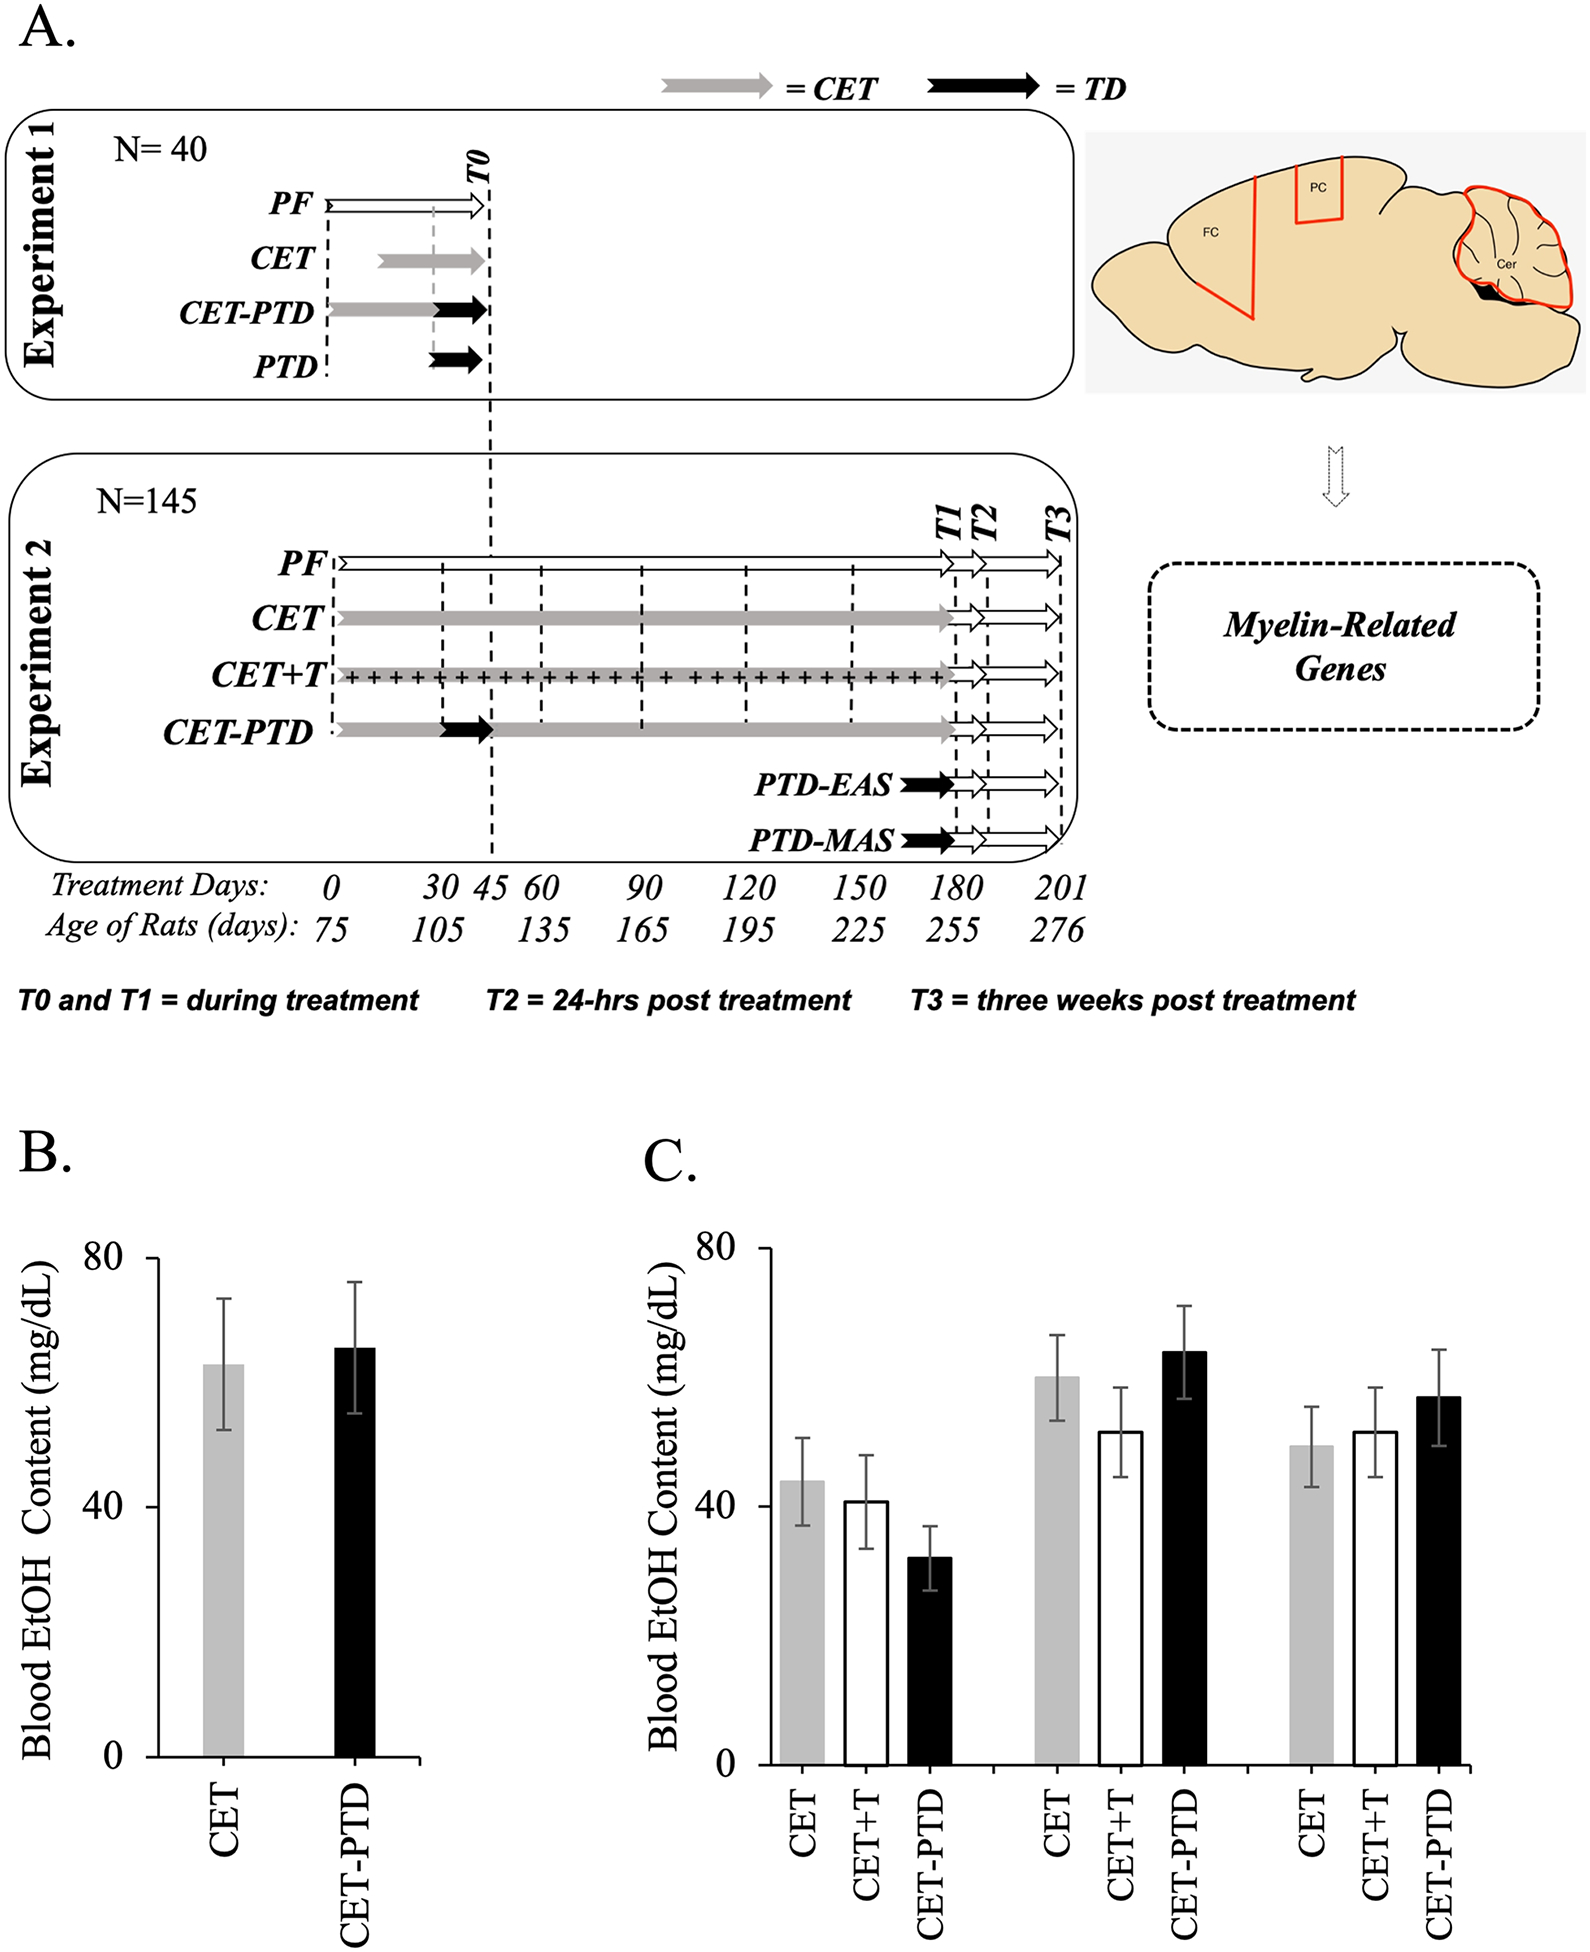
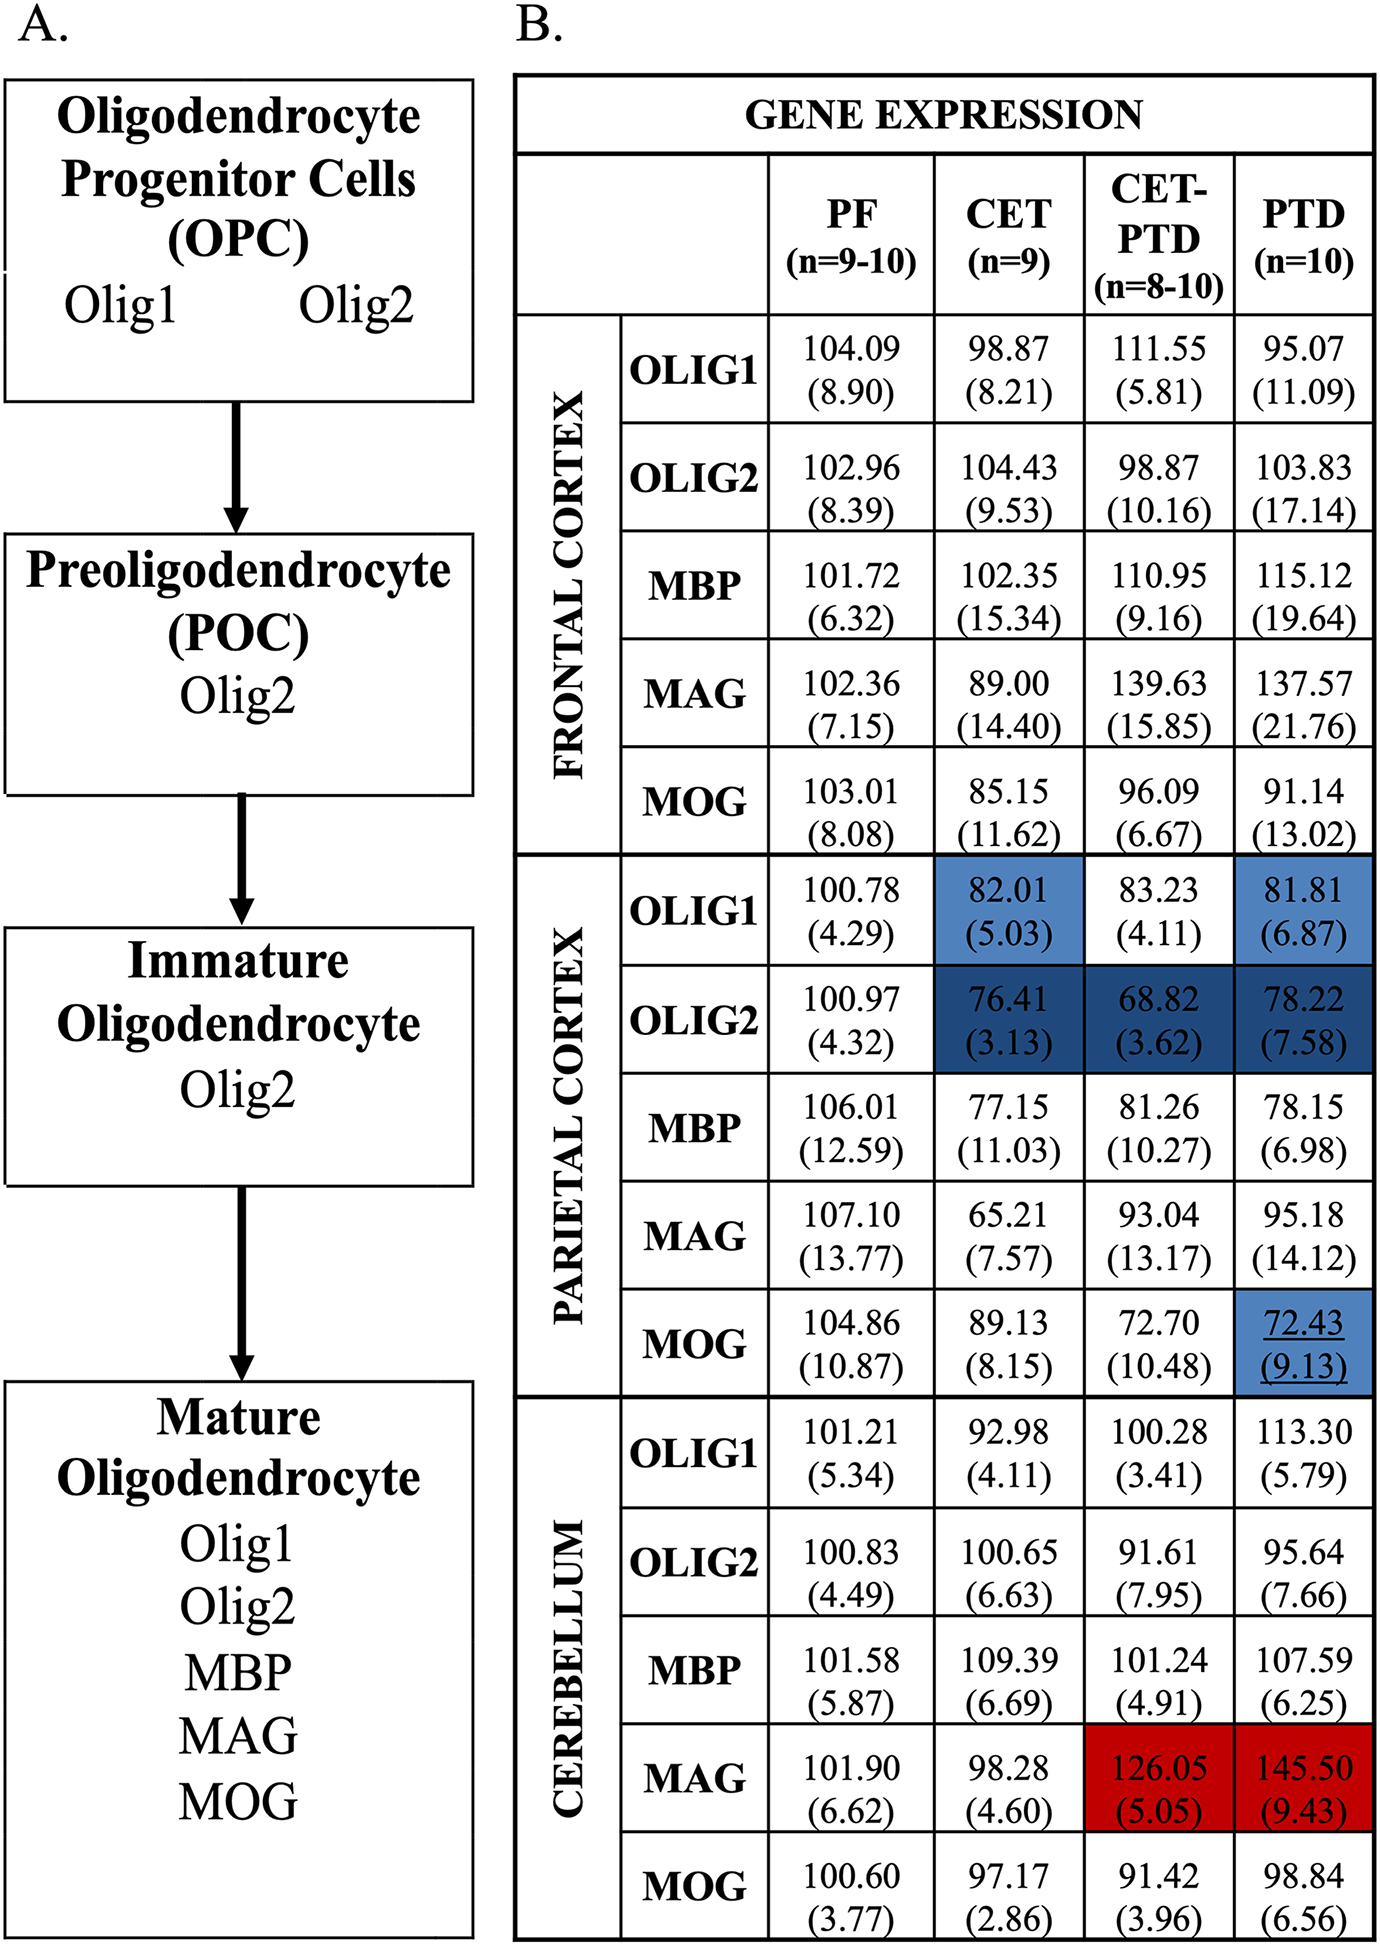
Methods: A rat model was used to assess the impact of moderate chronic EtOH exposure (CET; 20% EtOH in drinking water for 1 or 6 months), pyrithiamine-induced thiamine deficiency treatment (PTD), both conditions combined (CET-PTD), or CET with thiamine injections (CET + T) on myelin-related gene expression (Olig1, Olig2, MBP, MAG, and MOG) in the frontal and parietal cortices and the cerebellum.
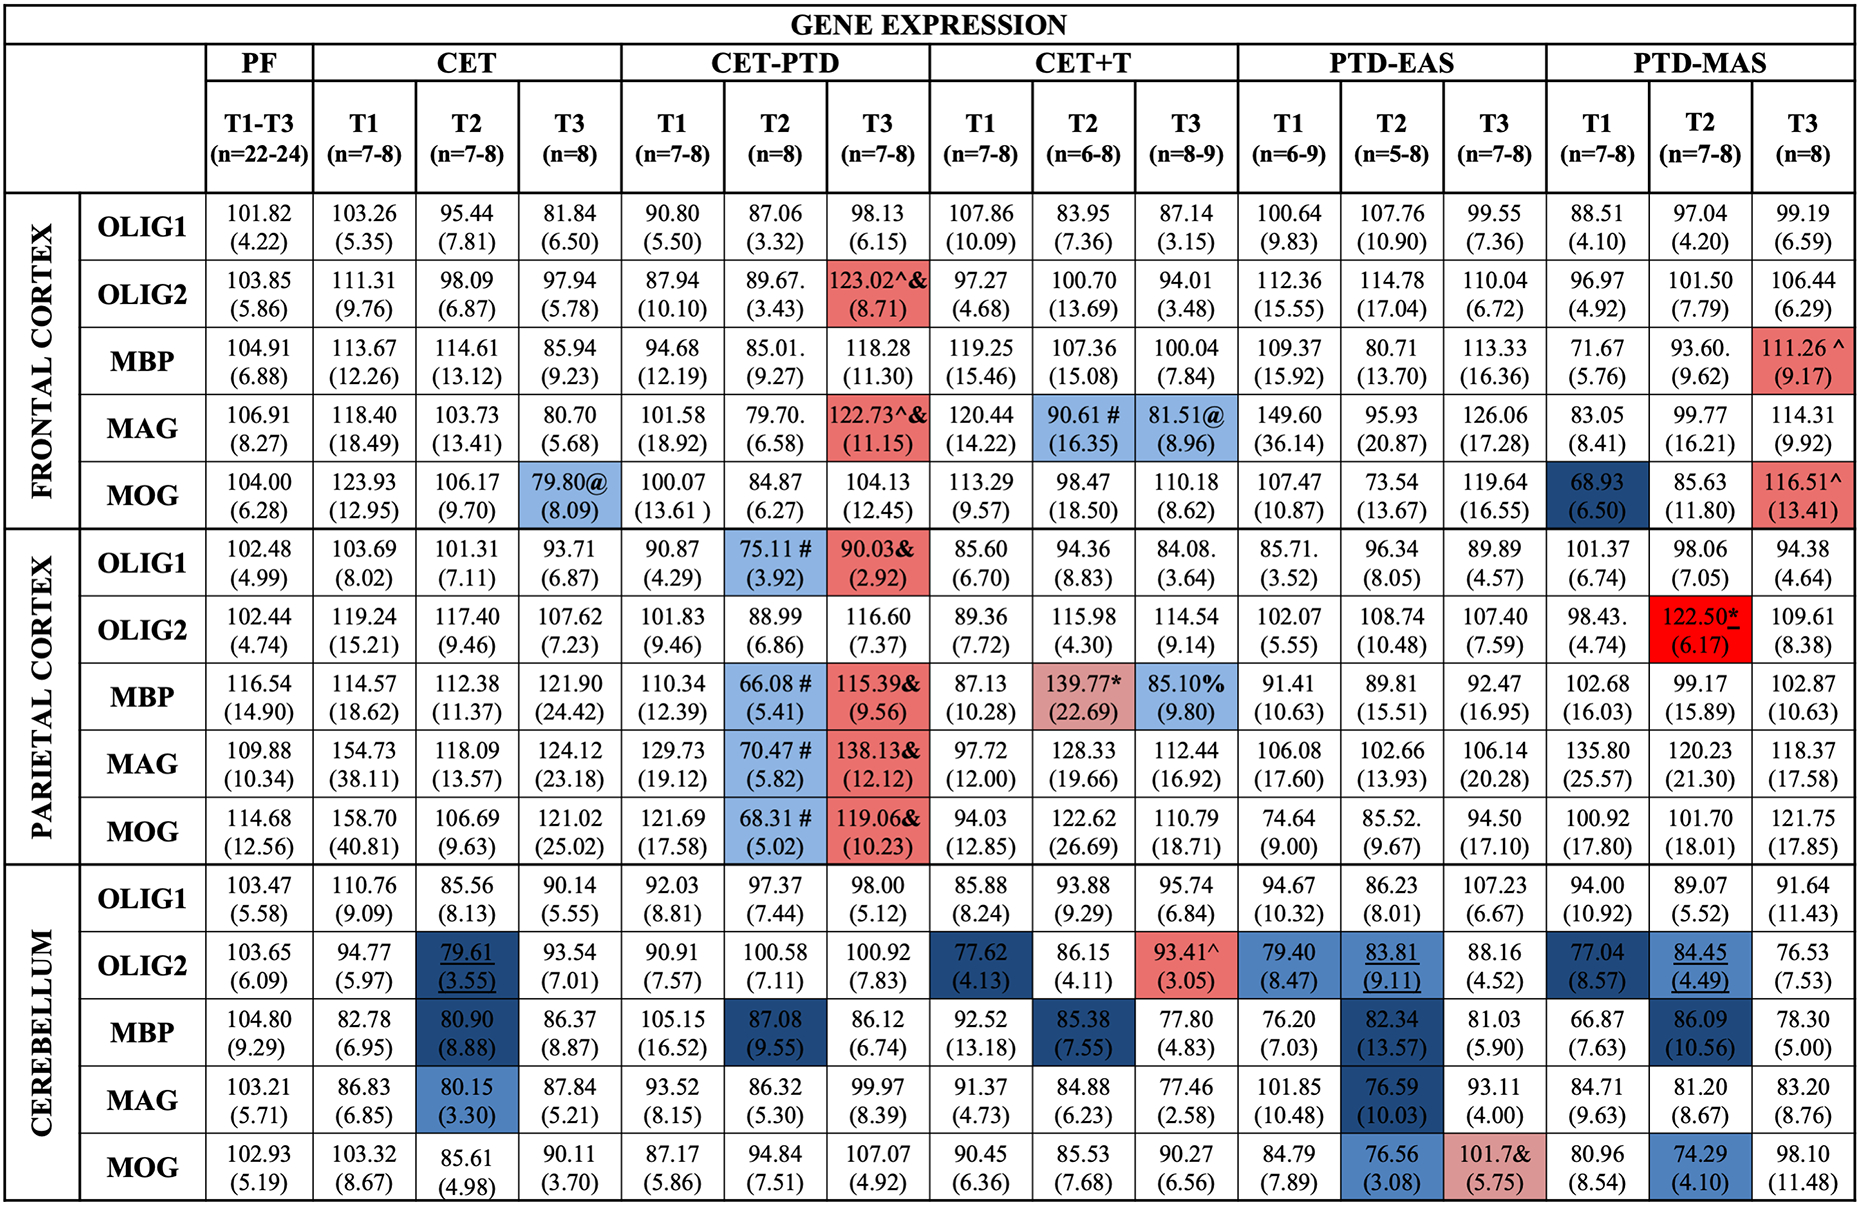
Results: The CET-PTD treatments caused the greatest suppression in myelin-related genes in the cortex. Specifically, the parietal cortex was the region that was most susceptible to PTD-CET-induced alterations in myelin-related genes. In addition, PTD treatment, with and without CET, caused minor fluctuations in the expression of several myelin-related genes in the frontal cortex. In contrast, CET alone and PTD alone suppressed several myelin-related genes in the cerebellum. Regardless of the region, there was significant recovery of myelin-related genes with extended abstinence and/or thiamine restoration.
Conclusion: Moderate chronic EtOH alone had a minor effect on the suppression of myelin-related genes in the cortex; however, when combined with thiamine deficiency, the reduction was amplified. There was a suppression of myelin-related genes following long-term EtOH and thiamine deficiency in the cerebellum. However, the suppression in the myelin-related genes mostly occurred 24 h after EtOH removal or following thiamine restoration; within 3 weeks of abstinence or thiamine recovery, gene expression rebounded.
Keywords: Alcohol; Cerebellum; Cortex; Thiamine Deficiency; White Matter.
© 2020 by the Research Society on Alcoholism.
Figures
Similar articles
-
A Pivotal Role for Thiamine Deficiency in the Expression of Neuroinflammation Markers in Models of Alcohol-Related Brain Damage.Alcohol Clin Exp Res. 2019 Mar;43(3):425-438. doi: 10.1111/acer.13946. Epub 2019 Jan 20. Alcohol Clin Exp Res. 2019. PMID: 30589435 Free PMC article.
-
Interactions between chronic ethanol consumption and thiamine deficiency on neural plasticity, spatial memory, and cognitive flexibility.Alcohol Clin Exp Res. 2015 Nov;39(11):2143-53. doi: 10.1111/acer.12859. Epub 2015 Sep 30. Alcohol Clin Exp Res. 2015. PMID: 26419807 Free PMC article.
-
Sex differences in cholinergic circuits and behavioral disruptions following chronic ethanol exposure with and without thiamine deficiency.Alcohol Clin Exp Res. 2021 May;45(5):1013-1027. doi: 10.1111/acer.14594. Epub 2021 Apr 3. Alcohol Clin Exp Res. 2021. PMID: 33690917 Free PMC article.
-
Aging with alcohol-related brain damage: Critical brain circuits associated with cognitive dysfunction.Int Rev Neurobiol. 2019;148:101-168. doi: 10.1016/bs.irn.2019.09.002. Epub 2019 Oct 17. Int Rev Neurobiol. 2019. PMID: 31733663 Free PMC article. Review.
-
Susceptibility of the cerebellum to thiamine deficiency.Cerebellum. 2006;5(1):55-63. doi: 10.1080/14734220600551707. Cerebellum. 2006. PMID: 16527765 Review.
Cited by
-
Thiamine and benfotiamine: Focus on their therapeutic potential.Heliyon. 2023 Nov 7;9(11):e21839. doi: 10.1016/j.heliyon.2023.e21839. eCollection 2023 Nov. Heliyon. 2023. PMID: 38034619 Free PMC article. Review.
-
Genome-wide transcriptomics of the amygdala reveals similar oligodendrocyte-related responses to acute and chronic alcohol drinking in female mice.Transl Psychiatry. 2022 Nov 12;12(1):476. doi: 10.1038/s41398-022-02231-2. Transl Psychiatry. 2022. PMID: 36371333 Free PMC article.
-
Follow-up of the re-evaluation of sulfur dioxide (E 220), sodium sulfite (E 221), sodium bisulfite (E 222), sodium metabisulfite (E 223), potassium metabisulfite (E 224), calcium sulfite (E 226), calcium bisulfite (E 227) and potassium bisulfite (E 228).EFSA J. 2022 Nov 24;20(11):e07594. doi: 10.2903/j.efsa.2022.7594. eCollection 2022 Nov. EFSA J. 2022. PMID: 36440381 Free PMC article.
-
Alcohol Toxicity in the Developing Cerebellum.Diagnostics (Basel). 2024 Jul 2;14(13):1415. doi: 10.3390/diagnostics14131415. Diagnostics (Basel). 2024. PMID: 39001305 Free PMC article.
-
Thiamine Deficiency and Neuroinflammation Are Important Contributors to Alcohol Use Disorder.Pathophysiology. 2025 Jul 4;32(3):34. doi: 10.3390/pathophysiology32030034. Pathophysiology. 2025. PMID: 40700076 Free PMC article. Review.
References
-
- Adams RD (1976) Nutritional cerebellar degeneration, in Handbook of Clinical Neurology, Vol. 28 (Metabolic and Deficiency Diseases of the Nervous System, Part II) (Vinken PJ, Bruyn GW eds), pp. 271–283. North-Holland Publ. Co., Amsterdam.
-
- Alfonso-Loeches S, Pascual M, Gómez-Pinedo U, Pascual-Lucas M, Renau-Piqueras J, Guerri C (2012) Toll-like receptor 4 participates in the myelin disruptions associated with chronic alcohol abuse. Glia 60:948–964. - PubMed
-
- Aloe L, Tirassa P (1992) The effect of long-term alcohol intake on brain NGF-target cells of aged rats. Alcohol 9:299–304. - PubMed
Publication types
MeSH terms
Substances
Grants and funding
LinkOut - more resources
Full Text Sources
Research Materials
Miscellaneous
