. 2021 May;112(5):1822-1838.
doi: 10.1111/cas.14703. Epub 2021 Mar 8.

Oncogenic KRAS-expressing organoids with biliary epithelial stem cell properties give rise to biliary tract cancer in mice

Affiliations

Oncogenic KRAS-expressing organoids with biliary epithelial stem cell properties give rise to biliary tract cancer in mice

Akiyoshi Kasuga et al. Cancer Sci. 2021 May.

Abstract

Biliary tract cancer (BTC) arises from biliary epithelial cells (BECs) and includes intrahepatic cholangiocarcinoma (IHCC), gallbladder cancer (GC), and extrahepatic cholangiocarcinoma (EHCC). Although frequent KRAS mutations and epigenetic changes at the INK4A/ARF locus have been identified, the molecular pathogenesis of BTC is unclear and the development of corresponding anticancer agents remains inadequate. We isolated epithelial cell adhesion molecule (EpCAM)-positive BECs from the mouse intrahepatic bile duct, gallbladder, and extrahepatic bile duct, and established organoids derived from these cells. Introduction of activated KRAS and homozygous deletion of Ink4a/Arf in the cells of each organoid type conferred the ability to form lethal metastatic adenocarcinoma with differentiated components and a pronounced desmoplastic reaction on cell transplantation into syngeneic mice, indicating that the manipulated cells correspond to BTC-initiating cells. The syngeneic mouse models recapitulate the pathological features of human IHCC, GC, and EHCC, and they should therefore prove useful for the investigation of BTC carcinogenesis and the development of new therapeutic strategies. Tumor cells isolated from primary tumors formed organoids in three-dimensional culture, and serial syngeneic transplantation of these cells revealed that their cancer stem cell properties were supported by organoid culture, but not by adherent culture. Adherent culture thus attenuated tumorigenic activity as well as the expression of both epithelial and stem cell markers, whereas the expression of epithelial-mesenchymal transition (EMT)-related transcription factor genes and mesenchymal cell markers was induced. Our data show that organoid culture is important for maintenance of epithelial cell characteristics, stemness, and tumorigenic activity of BTC-initiating cells.

Keywords: biliary tract cancer; cancer stem cell; cholangiocarcinoma; epithelial-mesenchymal transition; organoid culture.


Conflict of interest statement

The authors declare no conflict of interest.

Figures
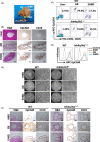
FIGURE 1
FIGURE 1
Isolation and organoid culture of mouse biliary epithelial cells (BECs). A, Representative gross morphology of the mouse liver, gall bladder (GB), extrahepatic bile duct (EHBD), and duodenum. The intrahepatic bile duct (IHBD) is located within the liver. B, H&E staining as well as IHC of EpCAM and CK19 in the mouse biliary tract (IHBD, GB, and EHBD). Scale bars, 100 μm. C, FACS of EpCAM+CD31CD45 cells from single‐cell digests of the liver (IHBD), GB, and EHBD of WT and Ink4a/Arf −/− mice. D, Organoids formed by cells isolated as in (C) were disrupted and subjected to flow cytometric analysis of EpCAM. Control represents staining with control IgG. E, Bright‐field images (low and high magnification) of organoid cultures of BECs from WT and Ink4a/Arf −/− mice. Scale bars, 100 μm. F, H&E staining and IHC of EpCAM and CK19 for BEC organoids of WT and Ink4a/Arf −/− mice. Scale bars, 100 μm
FIGURE 2
FIGURE 2
Establishment of mouse biliary epithelial cells (BECs) organoids expressing KRAS(G12V). A, Representative dot plots for flow cytometric analysis of GFP expression in BECs from Ink4a/Arf −/− mice infected with a retrovirus encoding KRAS(G12V) and GFP. B, Bright‐field and fluorescence images of organoid cultures of Ink4a/Arf −/− BECs infected with retroviruses encoding GFP alone or both KRAS(G12V) and GFP. Scale bars, 100 µm. C, H&E staining and IHC for EpCAM and CK19 in Ink4a/Arf −/− BEC organoids infected with GFP (control) or KRAS(G12V)‐GFP viruses. Scale bars, 100 μm. D, Immunoblot analysis of p16, GFP, and KRAS as well as of total and phosphorylated (p‐) forms of ERK and Akt in WT BECs and in Ink4a/Arf −/− BECs infected (or not) with GFP (control) or KRAS(G12V)‐GFP viruses. β‐Actin was examined as a loading control
FIGURE 3
FIGURE 3
Tumor formation by KRAS(G12V)–expressing Ink4a/Arf −/− biliary epithelial cells (BECs) in WT C57BL/6J mice. A, Macroscopic and microscopic appearance of tumors formed 4 wk after intrahepatic injection of KRAS(G12V)–expressing Ink4a/Arf −/− IHBD–, GB–, or EHBD–derived BECs (5 × 104 cells) in syngeneic WT mice. The light–emitting diode (LED) images reveal GFP fluorescence. For microscopic analysis, tumor sections were subjected to H&E staining as well as to IHC of GFP, CK19, α‐SMA, and phosphorylated (p‐) forms of ERK and Akt. Scale bars, 100 μm. B, C, H&E staining and IHC of GFP, CK19, and α‐SMA in tumors formed 4 wk after injection of KRAS(G12V)–expressing Ink4a/Arf −/− BECs (5 × 104 cells) either s.c. (B) or below the kidney capsule (C) in syngeneic WT mice. Scale bars, 100 µm. D, H&E staining and IHC of GFP, α‐SMA, and vimentin in tumors formed 3, 7, or 14 d after s.c. injection of KRAS(G12V)–expressing Ink4a/Arf −/− IHBD cells (1 × 104 cells) in syngeneic WT mice. Scale bars, 100 μm
FIGURE 4
FIGURE 4
Microenvironments in tumors formed by KRAS(G12V)–expressing Ink4a/Arf −/− biliary epithelial cells (BECs) in WT C57BL/6J mice. A, Masson trichrome staining as well as IHC of CD31, F4/80, CD4, CD8, and the cell proliferation marker Ki67 in tumors formed 4 wk after intrahepatic injection of KRAS(G12V)–expressing Ink4a/Arf −/− intrahepatic bile duct (IHBD)–derived BECs (5 × 104 cells) in WT C57BL/6J mice. Scale bars, 100 μm. B, Flow cytometric analysis of PD‐L1 expression in IHBD tumor‐initiating cells (TICs) before the inoculation (IHBD TIC) and in tumor–derived cells, which were isolated 4 wk after intrahepatic injection of the IHBD TICs (IHBD tumor). These cells were incubated with APC‐conjugated rat monoclonal antibodies to mouse PD‐L1 (red line). APC–conjugated rat IgG was used as isotype control antibody (black line). The expression of PD‐L1 in GFP–positive tumor cells and in GFP‐negative stromal cells is shown in lower panels. C, Flow cytometric analysis of PD‐L1 expression in cells derived from tumors isolated 4 wk after s.c. injection of IHBD, gallbladder (GB), or extrahepatic bile duct (EHBD) TICs (5 × 104 cells). The cells derived from IHBD, GB, or EHBD tumors were incubated with APC–conjugated rat monoclonal antibodies to mouse PD‐L1 (red, green, or blue line, respectively). The cells derived from IHBD tumors were incubated with isotype control antibody (APC–conjugated rat IgG, black line). The percentages of GFP–positive tumor cells and GFP‐negative stromal cells expressing PD‐L1 are also shown
FIGURE 5
FIGURE 5
High tumorigenic and metastatic capacity of KRAS(G12V)–expressing Ink4a/Arf −/− biliary epithelial cells (BECs). A, Time course for the volume of tumors formed after s.c. injection of KRAS(G12V)–expressing Ink4a/Arf −/− BECs (5 × 104 cells) in syngeneic WT mice (n = 5 for each group). Data are means ± SD. B, Kaplan‐Meier survival analysis for the mice in (A). C, Incidence of initial tumor formation and lung metastasis for the mice in (A). H&E staining and IHC for GFP in lung metastatic lesions formed 4 wk after s.c. cell injection are also shown. D, Incidence of initial tumor formation in mice injected s.c. with various numbers of Ink4a/Arf −/− BECs expressing either GFP alone or both KRAS(G12V) and GFP. E, Bright‐field (low and high magnification) and fluorescence images of organoids formed by individual KRAS(G12V)–expressing Ink4a/Arf −/− IHBD cells after single‐cell cloning. Scale bars, 100 μm. F, H&E staining of tumors formed 4 wk after s.c. injection of syngeneic WT mice with the single‐cell clones (5 × 104 cells) derived from organoid culture shown in E. Scale bars, 100 μm
FIGURE 6
FIGURE 6
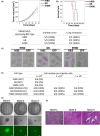
Cancer stem cell (CSC) properties are supported by organoid culture but not by adherent culture. A, Flow cytometric analysis for GFP expression and propidium iodide (PI) staining in cells derived from primary tumors formed 6 wk after s.c. injection of KRAS(G12V)–expressing Ink4a/Arf −/− biliary epithelial cells (BECs) (5 × 104 cells) in syngeneic WT mice. The percentages of GFP+PI cells for each primary tumor are shown. B, H&E staining and IHC of GFP and CK19 for secondary organoids derived from GFP–positive cells isolated from tumors as in (A). Scale bars, 100 μm. C, H&E staining and IHC of GFP and CK19 for tumors formed 4 wk after s.c. transplantation of secondary TICs (5 × 104) that had been maintained in organoid culture as in (B). Scale bars, 100 µm. D, Incidence of tumor formation in WT C57BL/6J mice injected s.c. with the indicated numbers of secondary TICs that had been maintained in organoid or adherent culture. E, Flow cytometric analysis of EpCAM, CD133, and Sca‐1 expression in primary and secondary TICs maintained in organoid or adherent culture. F, Heat map of biliary tract CSC marker gene expression as determined by microarray analysis of IHBD, GB, and EHBD cells as in (E).
FIGURE 7
FIGURE 7
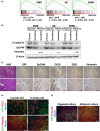
EMT–related gene expression in biliary tract cancer (BTC) models. A, GSEA of microarray data for the EMT gene set in secondary tumor–initiating cells (TICs) that had been maintained in adherent or organoid culture. NES, normalized enrichment score; FDR, false discovery rate. B, Immunoblot analysis of E‐cadherin, EpCAM, and vimentin in whole lysates of cells as in Figure 6E. C, H&E staining as well as IHC of GFP, EpCAM, CK19, ZEB1, and vimentin in primary tumors formed by IHBD clone 1 (5 × 104 cells) at 6 wk after s.c. injection in syngeneic WT hosts. The boxed regions in the upper panels are shown at higher magnification in the lower panels. Scale bars, 100 µm. D, Immunofluorescence analysis of GFP and either CK19 or vimentin in primary tumors formed by IHBD clone 1 (5 × 104 cells) at 3 or 6 wk after s.c. injection in syngeneic WT hosts. Nuclei were stained with Hoechst 33342 (blue). Scale bars, 100 µm. E, Immunofluorescence analysis of GFP and vimentin in secondary tumors formed 4 wk after s.c. implantation in new recipients of IHBD clone 1 cells (5 × 104 cells) derived from 6‐wk‐old primary tumors as in (D) and then maintained in organoid or adherent culture for 4 wk before transplantation. Nuclei were stained with Hoechst 33342 (blue). Scale bars, 100 µm
FIGURE 8
FIGURE 8
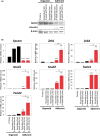
Expression of epithelial‐mesenchymal transition (EMT)–related genes in primary and secondary tumor–initiating cells (TICs) from a single‐cell clone (IHBD clone 1). A, Immunoblot analysis of EpCAM and vimentin in whole lysates of primary TICs maintained in organoid culture as well as of secondary TICs maintained in organoid or adherent culture. The secondary TICs were derived from tumors formed 3 or 6 wk after s.c. injection of KRAS(G12V)–expressing Ink4a/Arf −/− IHBD clone 1 (5 × 104 cells) into syngeneic WT hosts. B, RT and real‐time PCR analysis of Epcam, Zeb1, Zeb2, Snail1, Snail2, Twist1, and Twist2 mRNAs in cells as in (A). The data were normalized by the amount of Gapdh mRNA, are expressed relative to the corresponding value for primary TICs, and are means ± SD of triplicate experiments. *P < .05, **P < .01, ***P < .001 vs primary TICs or for the indicated comparisons (Student paired t test)

References

    1. Jemal A, Bray F, Center MM, Ferlay J, Ward E, Forman D. Global cancer statistics. CA Cancer J Clin. 2011;61(2):69‐90. - PubMed
    1. Patel T. Worldwide trends in mortality from biliary tract malignancies. BMC Cancer. 2002;2:10. - PMC - PubMed
    1. Valle J, Wasan H, Palmer DH, et al. Cisplatin plus gemcitabine versus gemcitabine for biliary tract cancer. N Engl J Med. 2010;362:1273‐1281. - PubMed
    1. Nakamura H, Arai Y, Totoki Y, et al. Genomic spectra of biliary tract cancer. Nat Genet. 2015;47:1003‐1010. - PubMed
    1. Tannapfel A, Benicke M, Katalinic A, et al. Frequency of p16(INK4A) alterations and K‐ras mutations in intrahepatic cholangiocarcinoma of the liver. Gut. 2000;47:721‐727. - PMC - PubMed

MeSH terms

Substances