. 2021 Jan;64(1):129-141.
doi: 10.1007/s00125-020-05292-4. Epub 2020 Oct 17.

Adipocyte-specific deletion of Tcf7l2 induces dysregulated lipid metabolism and impairs glucose tolerance in mice

Affiliations

Adipocyte-specific deletion of Tcf7l2 induces dysregulated lipid metabolism and impairs glucose tolerance in mice

Marie-Sophie Nguyen-Tu et al. Diabetologia. 2021 Jan.

Abstract

Aims/hypothesis: Transcription factor 7-like 2 (TCF7L2) is a downstream effector of the Wnt/β-catenin signalling pathway implicated in type 2 diabetes risk through genome-wide association studies. Although its expression is critical for adipocyte development, the potential roles of changes in adipose tissue TCF7L2 levels in diabetes risk are poorly defined. Here, we investigated whether forced changes in Tcf7l2 expression in adipocytes affect whole body glucose or lipid metabolism and crosstalk between disease-relevant tissues.

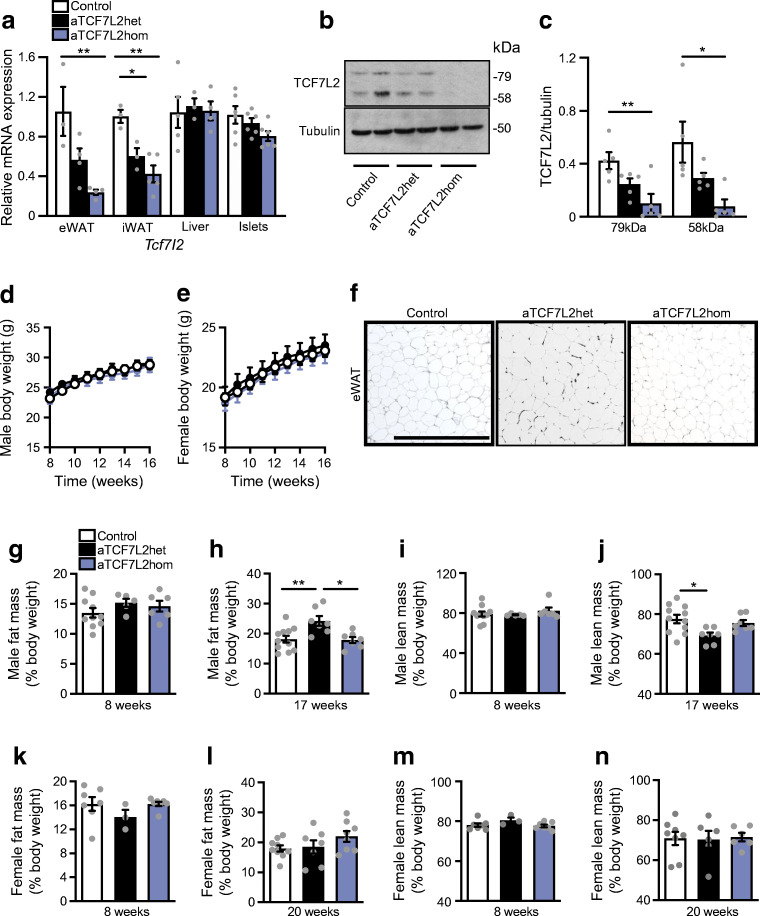
Methods: Tcf7l2 was selectively ablated in mature adipocytes in C57BL/6J mice using Cre recombinase under Adipoq promoter control to recombine Tcf7l2 alleles floxed at exon 1 (referred to as aTCF7L2 mice). aTCF7L2 mice were fed normal chow or a high-fat diet for 12 weeks. Glucose and insulin sensitivity, as well as beta cell function, were assessed in vivo and in vitro. Levels of circulating NEFA, selected hormones and adipokines were measured using standard assays.

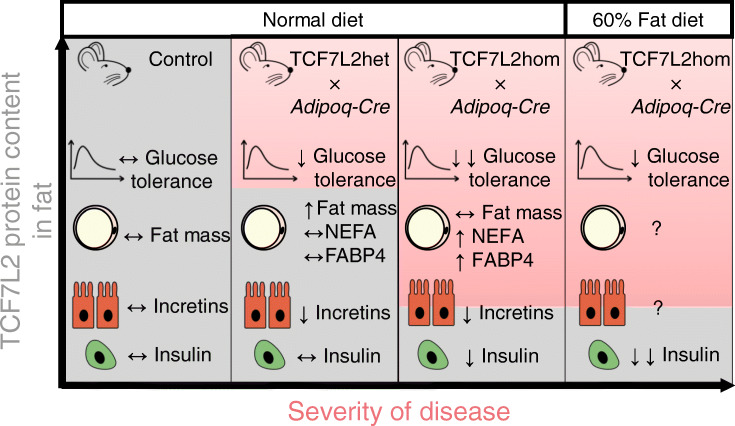
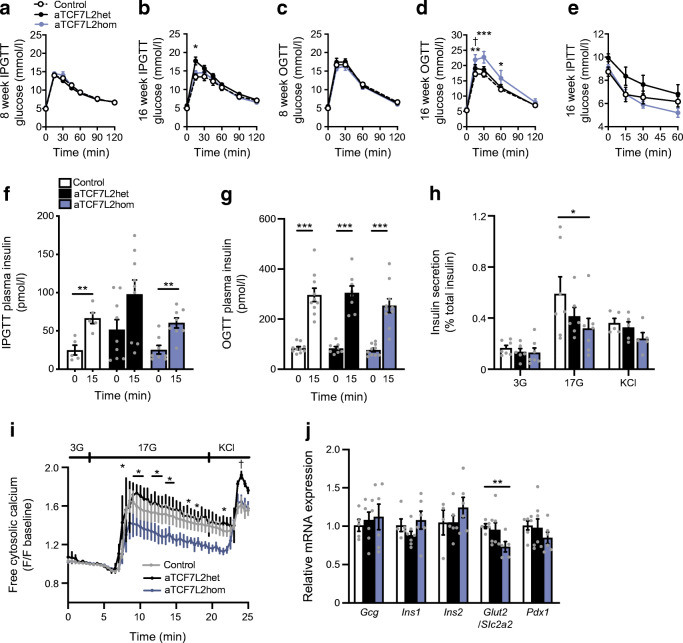
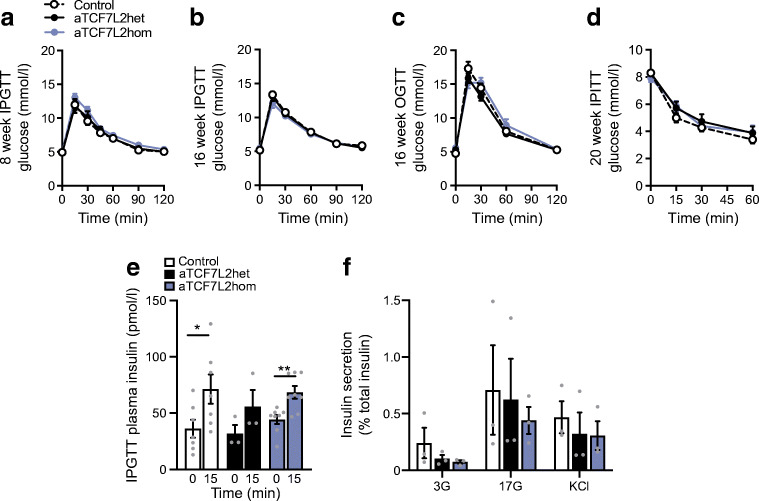
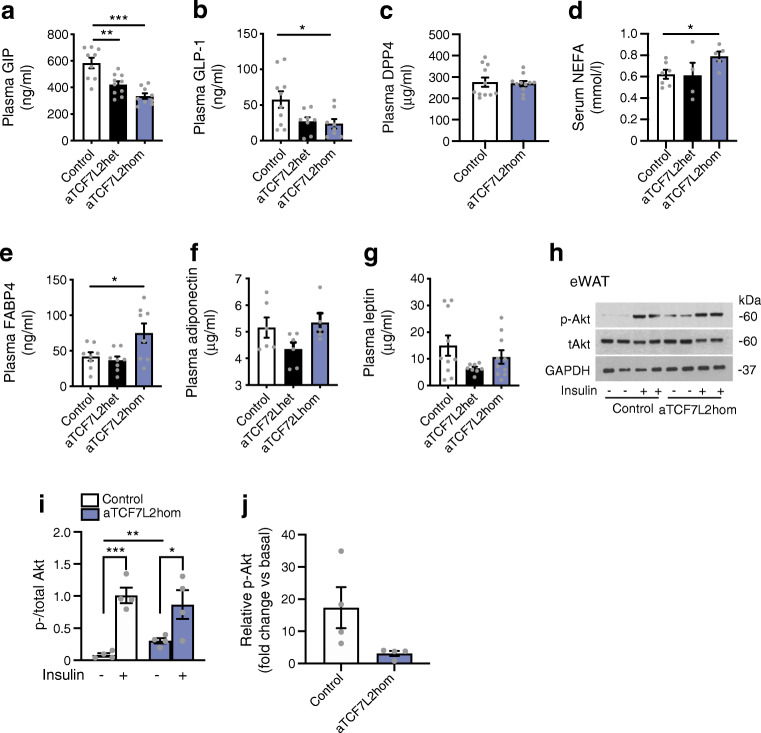
Results: Reduced TCF7L2 expression in adipocytes altered glucose tolerance and insulin secretion in male but not in female mice. Thus, on a normal chow diet, male heterozygote knockout mice (aTCF7L2het) exhibited impaired glucose tolerance at 16 weeks (p = 0.03) and increased fat mass (1.4 ± 0.1-fold, p = 0.007) but no changes in insulin secretion. In contrast, male homozygote knockout (aTCF7L2hom) mice displayed normal body weight but impaired oral glucose tolerance at 16 weeks (p = 0.0001). These changes were mechanistically associated with impaired in vitro glucose-stimulated insulin secretion (decreased 0.5 ± 0.1-fold vs control mice, p = 0.02) and decreased levels of the incretins glucagon-like peptide-1 and glucose-dependent insulinotropic polypeptide (0.6 ± 0.1-fold and 0.4 ± 0.1-fold vs control mice, p = 0.04 and p < 0.0001, respectively). Circulating levels of plasma NEFA and fatty acid binding protein 4 were increased by 1.3 ± 0.1-fold and 1.8 ± 0.3-fold vs control mice (p = 0.03 and p = 0.05, respectively). Following exposure to a high-fat diet for 12 weeks, male aTCF7L2hom mice exhibited reduced in vivo glucose-stimulated insulin secretion (0.5 ± 0.1-fold vs control mice, p = 0.02).

Conclusions/interpretation: Loss of Tcf7l2 gene expression selectively in adipocytes leads to a sexually dimorphic phenotype, with impairments not only in adipocytes, but also in pancreatic islet and enteroendocrine cells in male mice only. Our findings suggest novel roles for adipokines and incretins in the effects of diabetes-associated variants in TCF7L2, and further illuminate the roles of TCF7L2 in glucose homeostasis and diabetes risk. Graphical abstract.

Keywords: Adipocyte; Beta cell; Fatty acid; Incretin; Insulin; Mouse; TCF7L2; Type 2 diabetes.


Figures

None
Graphical abstract
Fig. 1
Fig. 1
Effects of adipocyte-selective Tcf7l2 deletion on body weight and fat mass in male and female mice on an NC diet. (a) Tcf7l2 mRNA expression by quantitative RT-PCR in eWAT, iWAT, liver and isolated islets with Gapdh, Actb or Ppia used as internal normalisation control genes (n = 3–6 mice/genotype). One-way ANOVA with Tukey’s post hoc test, **p < 0.01 aTCF7L2hom and *p < 0.05 aTCF7L2het vs control, respectively. (b) Representative western blot of TCF7L2 protein expression in eWAT. (c) Densitometry quantification of TCF7L2 expression by western blotting in eWAT (n = 5 mice/genotype). One-way ANOVA with Tukey’s post hoc test, **p < 0.01 and *p < 0.05 aTCF7L2hom vs control. (d) Body weight in male and (e) female mice on an NC (males: n = 10 control mice, n = 9 aTCF7L2het mice, n = 6 aTCF7L2hom mice; females: n = 13 control mice, n = 7 aTCF7L2het mice, n = 7 aTCF7L2hom mice). (f) H&E staining of eWAT from mice on an NC. Scale bar, 100 μm. (g) Fat mass in 8-week-old males (n = 10 control mice, n = 5 aTCF7L2het mice, n = 6 aTCF7L2hom mice), (h) in 17-week-old males (n = 11 control mice, n = 6 aTCF7L2het mice, n = 7 aTCF7L2hom mice). One-way ANOVA with Tukey’s post hoc test, **p < 0.01 aTCF7L2het vs control and *p < 0.05 aTCF7L2hom vs aTCF7L2het. (i) Lean mass in 8-week-old males (n = 10 control mice, n = 5 aTCF7L2het mice, n = 6 aTCF7L2hom mice) and (j) in 17-week-old males (n = 11 control mice, n = 6 aTCF7L2het mice, n = 7 aTCF7L2hom mice). One-way ANOVA with Tukey’s post hoc test, *p < 0.05 aTCF7L2het vs control. (k) Fat mass in 8-week-old females (n = 7 control mice, n = 3 aTCF7L2het mice, n = 7 aTCF7L2hom mice) and (l) in 20-week-old females (n = 9 control mice, n = 7 aTCF7L2het mice, n = 8 aTCF7L2hom mice). (m) Lean mass in 8-week-old females (n = 7 control mice, n = 3 aTCF7L2het mice, n = 7 aTCF7L2hom mice) and (n) in 20-week-old females (n = 9 control mice, n = 7 aTCF7L2het mice, n = 8 aTCF7L2hom mice). Data shown as mean ± SEM
Fig. 2
Fig. 2
Effects of adipocyte-selective Tcf7l2 deletion on glucose tolerance and beta cell function in male mice maintained on an NC diet. (a) IPGTT in 8-week-old male mice (n = 10 control mice, n = 10 aTCF7L2het mice, n = 9 aTCF7L2hom mice) maintained on an NC, and (b) in 16-week-old male mice (n = 10 control mice, n = 10 aTCF7L2het mice, n = 9 aTCF7L2hom mice). *p < 0.05 aTCF7L2het vs control group by two-way ANOVA with Tukey’s post hoc test. (c) OGTT in 8-week-old male mice (n = 10 control mice, n = 6 aTCF7L2het mice, n = 6 aTCF7L2hom mice), and (d) 16-week-old male mice (n = 10 control mice, n = 6 aTCF7L2het mice, n = 6 aTCF7L2hom mice). ***p < 0.001, **p < 0.01, *p < 0.05 aTCF7L2hom vs control and †p < 0.05 aTCF7L2hom vs aTCF7L2het by two-way ANOVA with Tukey’s post hoc test. (e) IPITT in 16-week-old mice (n = 10 control mice, n = 10 aTCF7L2het mice, n = 10 aTCF7L2hom mice). (f) Plasma insulin levels after i.p. injection of glucose (3 g/kg) in 16-week-old male mice (n = 5 control mice, n = 9 aTCF7L2het mice, n = 8 aTCF7L2hom mice). **p < 0.01 15 min vs 0 min condition by unpaired Student’s t test. (g) Insulin plasma levels after oral administration of glucose (3 g/kg) in 16-week-old male mice (n = 10 control mice, n = 7 aTCF7L2het mice, n = 9 aTCF7L2hom mice). ***p < 0.001 15 min vs 0 min condition by unpaired Student’s t test. (h) Insulin secretion by isolated islets from 17-week-old male mice (n = 5–7 mice/genotype). *p < 0.05 aTCF7L2hom vs control by two-way ANOVA with Tukey’s post hoc test. (i) Measurement of dynamic changes in intracellular calcium concentrations in isolated islets from 17-week-old male mice in response to perfusion of glucose (3 mmol/l, 3G; 17 mmol/l, 17G) and KCl (30 mmol/l) and represented as fold change of fluorescence intensity (F) compared with basal state at low glucose (n = 3 mice/genotype). *p < 0.05 aTCF7L2het vs aTCF7L2hom, †p < 0.05 aTCF7L2het vs control by two-way ANOVA with Tukey’s post hoc test. (j) mRNA expression profiling by quantitative RT-PCR of key pancreatic islet markers in isolated islets from 17-week-old male mice; each dot represents data from one mouse. **p < 0.01 aTCF7L2hom vs control by two-way ANOVA with Tukey’s post hoc test. Data are shown as mean ± SEM
Fig. 3
Fig. 3
Effects of adipocyte-selective Tcf7l2 deletion on glucose tolerance and beta cell function in female mice maintained on an NC. (a) IPGTT in 8-week-old female mice maintained on an NC (n = 10 control mice, n = 10 aTCF7L2het mice, n = 8 aTCF7L2hom mice) and (b) in 16-week-old female mice (n = 10 control mice, n = 10 aTCF7L2het mice, n = 8 aTCF7L2hom mice). (c) OGTT in 16-week-old female mice (n = 6 control mice, n = 9 aTCF7L2het mice, n = 4 aTCF7L2hom mice). (d) IPITT in 20-week-old female mice (n = 10 control mice, n = 7 aTCF7L2het mice, n = 5 aTCF7L2hom mice). (e) Insulin plasma levels after glucose injection (3 g/kg) in 20-week-old female mice on an NC (n = 7 control mice, n = 3 aTCF7L2het mice, n = 8 aTCF7L2hom mice); *p < 0.05, **p < 0.01 15 min vs 0 min condition by unpaired Student’s t test. (f) Insulin secretion on isolated islets from 20-week-old female mice during static incubation with 3 mmol/l glucose (3G), 17 mmol/l glucose (17G) and 30 mmol/l KCl, (n = 3 mice/genotype). Data are shown as mean ± SEM
Fig. 4
Fig. 4
NEFA and incretin levels depend on adipocyte Tcf7l2 expression. (a) GIP plasma levels in the fed state. ***p < 0.001 aTCF7L2homo vs control and **p < 0.01 aTCF7L2het vs control by one-way ANOVA with Tukey’s post hoc test. (b) GLP-1 plasma levels in the fed state. *p < 0.05 aTCF7L2hom vs control by one-way ANOVA with Tukey’s post hoc test. (c) DPP4 plasma levels. (d) NEFA serum levels. *p < 0.05 aTCF7L2hom vs control by one-way ANOVA with Tukey’s post hoc test. (e) FABP4 plasma levels. *p < 0.05 aTCF7L2hom vs control by one-way ANOVA with Tukey’s post hoc test. (f) Adiponectin plasma levels. (g) Leptin plasma levels. (h) Representative western blot of phosphorylated and total Akt from eWAT homogenates harvested from male mice 10 min after i.p. injection of sterile PBS (− insulin) or 1 U/kg of insulin (+ insulin) (n = 4 mice/genotype). (i) Densitometry analysis of n = 4 mice per genotype ***p < 0.001 insulin (+) vs insulin (−) condition in control by unpaired Student’s t test, **p < 0.01 insulin (−) in aTCF7L2hom vs insulin (−) control by unpaired Student’s t test, *p < 0.05 insulin (+) vs insulin (−) condition in aTCF7L2hom by unpaired Student’s t test. (j) Fold change of phosphorylated Akt expression after insulin stimulation over basal (− insulin). p = 0.07 aTCF7L2hom vs control by unpaired Student’s t test. Data shown as mean ± SEM
Fig. 5
Fig. 5
Effects of HFD on adipocyte-selective deletion of Tcf7l2. (a) Body weight in male mice during HFD feeding (n = 6 mice/genotype). (b) IPGTT in male mice after 9 weeks of HFD (n = 6 mice/genotype). **p = 0.003 aTCF7L2hom vs control by two-way ANOVA followed by Bonferroni post hoc test. (c) AUC corresponding to (b). (d) OGTT in male mice after 12 weeks of HFD (n = 4 control mice, n = 3 aTCF7L2hom mice). (e) AUC corresponding to (d). (f) IPITT in male mice after 12 weeks of HFD (n = 3 mice/genotype). (g) Insulin plasma levels after i.p. injection of glucose (2 g/kg) in male mice following 12 weeks of HFD (n = 4 control mice, n = 3 aTCF7L2hom mice). (h) Insulin plasma levels after oral administration of glucose (2 g/kg) in male mice following 12 weeks of HFD (n = 4 control mice, n = 3 aTCF7L2hom mice). *p < 0.05 aTCF7L2hom vs control at 15 min condition by unpaired Student’s t test. (i) Insulin secretion on isolated islets from male mice after 12 weeks of HFD during static incubation of glucose (3 mmol/l, 3G; 17 mmol/l, 17G), a combination of 17 mmol/l glucose and 20 nmol/l GLP-1 (17G+GLP-1) and KCl (30 mmol/l), (n = 3 mice/genotype). Data shown as mean ± SEM

References

    1. Jin T, Liu L. The Wnt signaling pathway effector TCF7L2 and type 2 diabetes mellitus. Mol Endocrinol. 2008;22(11):2383–2392. doi: 10.1210/me.2008-0135. - DOI - PubMed
    1. da Silva Xavier G, Mondragon A, Sun G, et al. Abnormal glucose tolerance and insulin secretion in pancreas-specific Tcf7l2-null mice. Diabetologia. 2012;55(10):2667–2676. doi: 10.1007/s00125-012-2600-7. - DOI - PMC - PubMed
    1. Mitchell RK, Mondragon A, Chen L, et al. Selective disruption of Tcf7l2 in the pancreatic beta cell impairs secretory function and lowers beta cell mass. Hum Mol Genet. 2015;24(5):1390–1399. doi: 10.1093/hmg/ddu553. - DOI - PMC - PubMed
    1. Boj SF, van Es JH, Huch M, et al. Diabetes risk gene and Wnt effector Tcf7l2/TCF4 controls hepatic response to perinatal and adult metabolic demand. Cell. 2012;151(7):1595–1607. doi: 10.1016/j.cell.2012.10.053. - DOI - PubMed
    1. Oh KJ, Park J, Kim SS, Oh H, Choi CS, Koo SH. TCF7L2 modulates glucose homeostasis by regulating CREB- and FoxO1-dependent transcriptional pathway in the liver. PLoS Genet. 2012;8(9):e1002986. doi: 10.1371/journal.pgen.1002986. - DOI - PMC - PubMed

Publication types

MeSH terms