. 2020 Nov;19(11):e13235.
doi: 10.1111/acel.13235. Epub 2020 Oct 17.

Targeting miR-124/Ferroportin signaling ameliorated neuronal cell death through inhibiting apoptosis and ferroptosis in aged intracerebral hemorrhage murine model

Affiliations

Targeting miR-124/Ferroportin signaling ameliorated neuronal cell death through inhibiting apoptosis and ferroptosis in aged intracerebral hemorrhage murine model

Wen-Dai Bao et al. Aging Cell. 2020 Nov.

Erratum in

Abstract

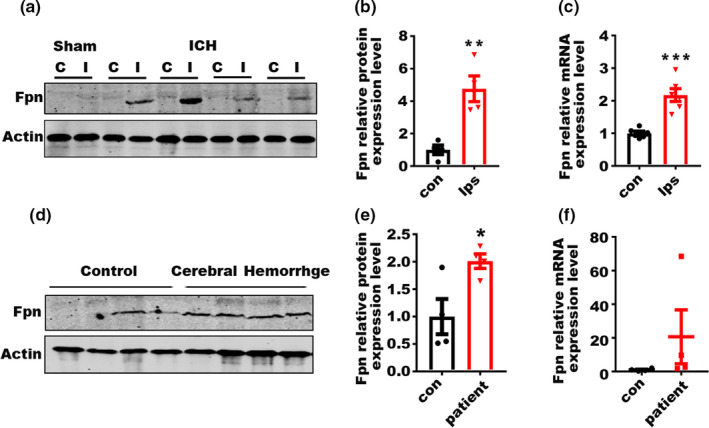
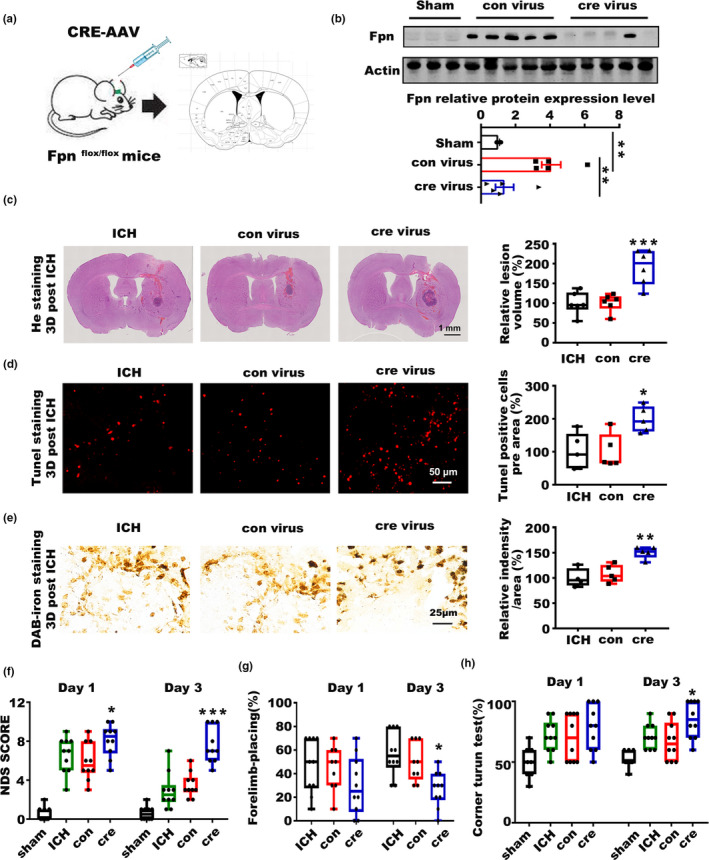
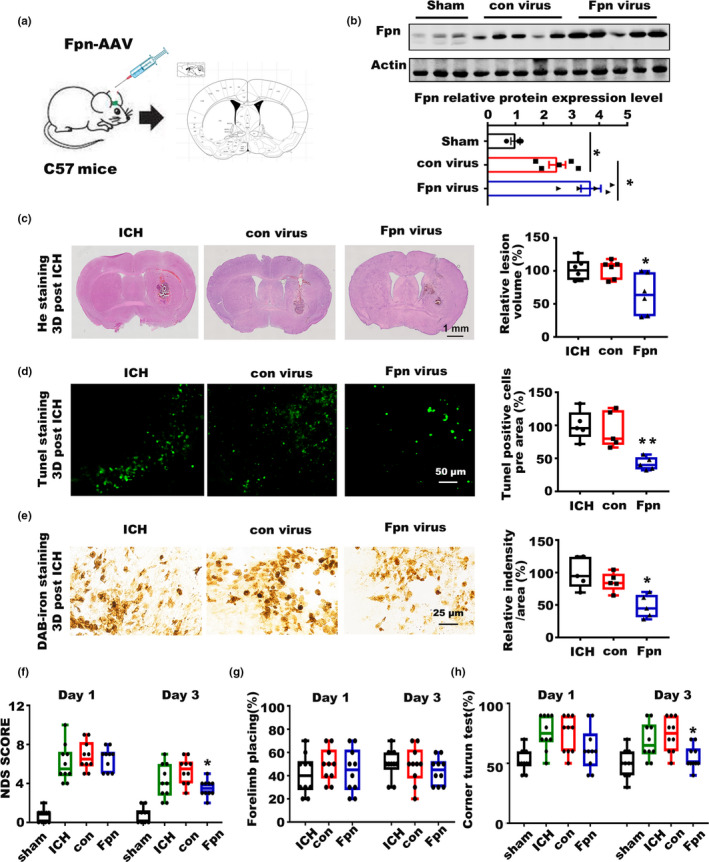
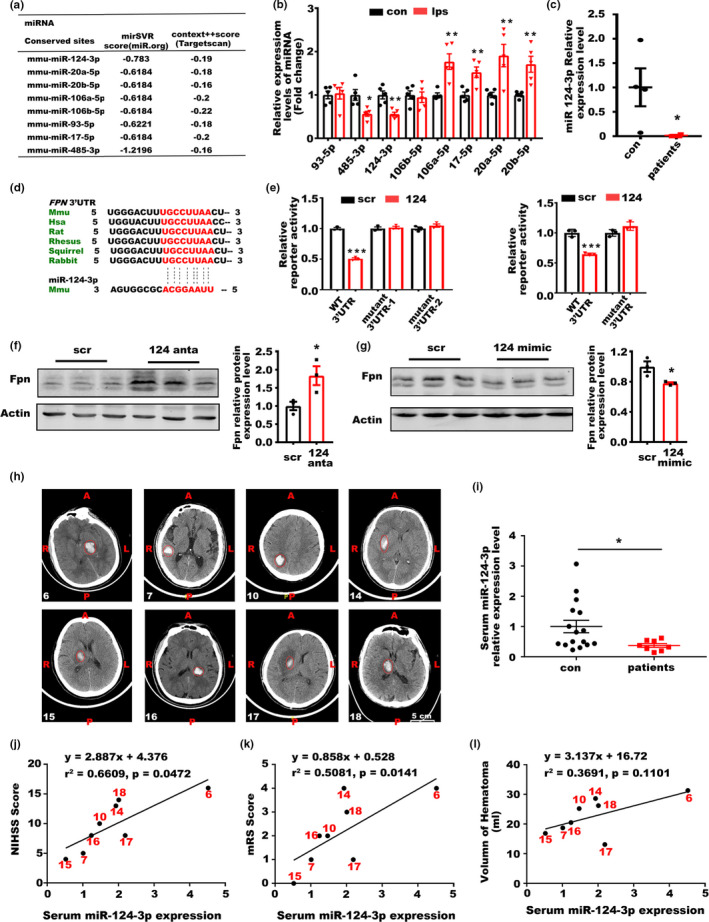
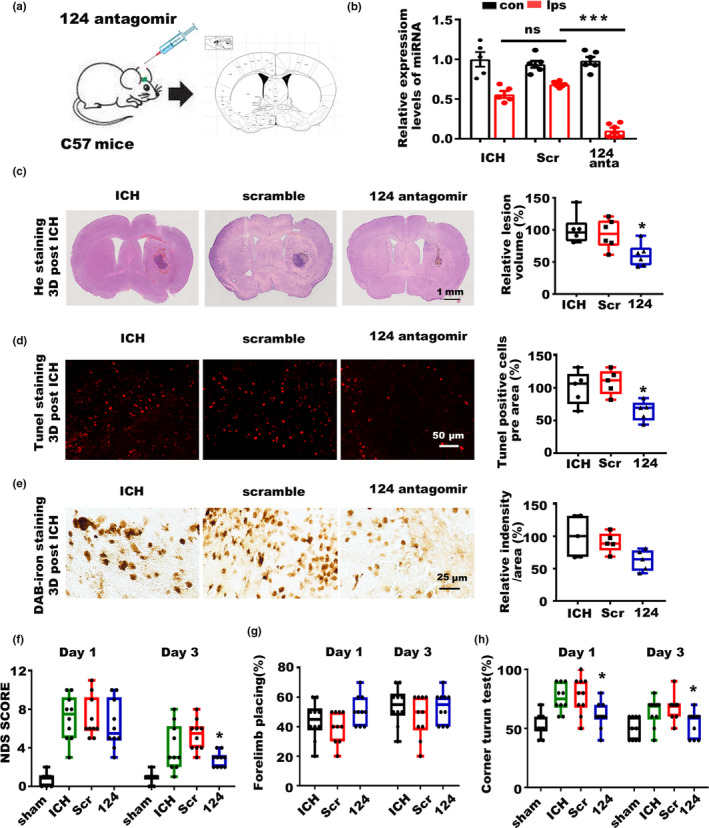
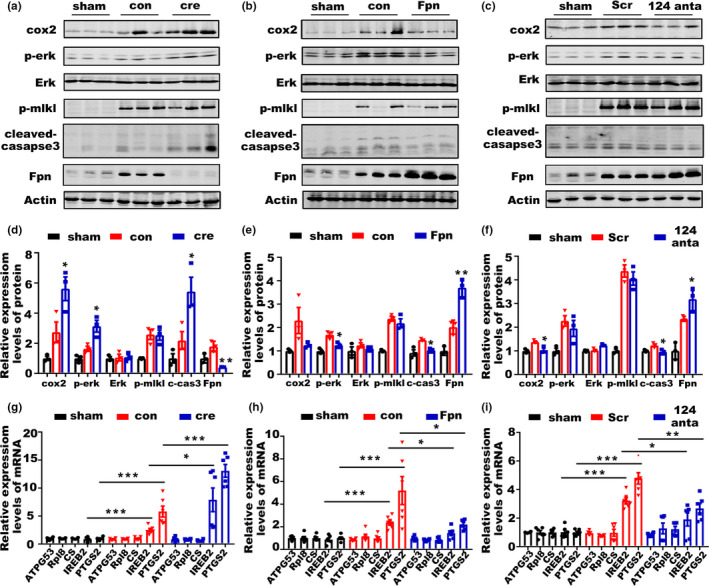
Incidence of intracerebral hemorrhage (ICH) and brain iron accumulation increases with age. Excess iron accumulation in brain tissues post-ICH induces oxidative stress and neuronal damage. However, the mechanisms underlying iron deregulation in ICH, especially in the aged ICH model have not been well elucidated. Ferroportin1 (Fpn) is the only identified nonheme iron exporter in mammals to date. In our study, we reported that Fpn was significantly upregulated in perihematomal brain tissues of both aged ICH patients and mouse model. Fpn deficiency induced by injecting an adeno-associated virus (AAV) overexpressing cre recombinase into aged Fpn-floxed mice significantly worsened the symptoms post-ICH, including hematoma volume, cell apoptosis, iron accumulation, and neurologic dysfunction. Meanwhile, aged mice pretreated with a virus overexpressing Fpn showed significant improvement of these symptoms. Additionally, based on prediction of website tools, expression level of potential miRNAs in ICH tissues and results of luciferase reporter assays, miR-124 was identified to regulate Fpn expression post-ICH. Higher serum miR-124 levels were correlated with poor neurologic scores of aged ICH patients. Administration of miR-124 antagomir enhanced Fpn expression and attenuated iron accumulation in aged mice model. Both apoptosis and ferroptosis, but not necroptosis, were regulated by miR-124/Fpn signaling manipulation. Our study demonstrated the critical role of miR-124/Fpn signaling in iron metabolism and neuronal death post-ICH in aged murine model. Thus, Fpn upregulation or miR-124 inhibition might be promising therapeutic approachs for this disease.

Keywords: Fpn; apoptosis; ferroptosis; intracerebral hemorrhage; iron; miR-124.


Conflict of interest statement

The authors have declared that no conflict of interest exists.

Figures

Figure 1
Figure 1
Fpn is upregulated in aged mouse and patient ICH tissues. (a) Protein level of Fpn in the perihematomal brain tissues of the aged ICH mouse model and sham control (20‐month‐old). C, contralateral side; I, ipsilateral side. (b) Quantification for (a), fold change of protein level of Fpn between the contralateral side (con) and ipsilateral side (ips) post‐ICH. (c) mRNA level of Fpn in the tissues of the ICH mouse model. Con, contralateral side; Ips, ipsilateral side (n = 6). β‐Actin was used as an internal control, and the results are shown as the fold change of the control. (d) Protein level of Fpn in the perihematomal brain tissues from ICH patients (n = 4) and controls (n = 4). (e) Quantification of (d). (f) mRNA level of Fpn in the tissues from ICH patients (n = 4) and controls (con) (n = 4). β‐Actin was used as an internal control, and the results are shown as the fold change of the control. The data are shown as the mean ± SEM of at least 3 independent experiments. Statistical analyses were carried out using multiple t test. *p < 0.05; **p < 0.01; ***p < 0.001
Figure 2
Figure 2
Fpn deficiency worsens the symptoms of ICH. (a) Cartoon outline of the (cre virus) stereotactic injection procedure in aged Fpn‐floxed mice (20‐month‐old). (b) Protein level of Fpn in the brain tissues of the ICH model mice injected with the cre‐expression AAV (cre virus) or control virus (con virus) compared to sham control mice (Sham), the quantitative data were listed below. (c) Brain sections were stained with hematoxylin and eosin (left), and the lesion volume was calculated (right). The results are shown as the fold change (%) of the controls. ICH, mice without any virus injection before the ICH model was generated. Con, mice with con virus injection one month before the ICH model was generated. Cre, mice with cre virus injection one month before the ICH model was generated (n = 6). (d) Sections were subjected to TUNEL staining (left), quantification is shown (right), and the results are shown as the fold change (%) of the control (n = 5). (e) Perls' staining (left) and quantification of the staining intensity of cells (right) and the results are shown as the fold change (%) of the control. (f) Neurologic deficit score, (g) Forelimb placing capacity, and (h) corner turn test for all these mice post‐ICH (n = 9–10, per group). The results are shown as box‐and‐whisker plots (the middle horizontal line within the box represents the median, the boxes extend from the 25th to the 75th percentile, and the whiskers represent 95% confidence intervals). Statistical analyses were carried out using one‐way and two‐way ANOVA. *p < 0.05; **p < 0.01; ***p < 0.001
Figure 3
Figure 3
Overexpression of Fpn alleviated the symptoms of ICH. (a) Cartoon outline of the procedure for the stereotactic injection of the AAV overexpressing Fpn in aged C57 mice (20‐month‐old). (b) Protein level of Fpn in the brain tissues of ICH model mice injected with Fpn‐expressing AAV (Fpn virus) or control virus (con virus) compared to that in sham control mice, the quantitative data were listed below. (c) Brain sections were stained with hematoxylin and eosin (left), and lesion volume was calculated (right). The results are shown as the fold change (%) of the controls. ICH, mice without virus injection before the ICH model was generated. Con, mice with con virus injection before the ICH model was generated. Fpn, mice injected with Fpn virus before the ICH model was generated (n = 6). (d) Sections were subjected to TUNEL staining (left), and quantification is shown (right). The results are shown as the fold change (%) of the controls (n = 5). (e) Perls' staining (left) and quantification of the staining intensity of the cells (right). The results are shown as the fold change (%) of the controls (n = 5). (f) Neurologic deficit score, (g) Forelimb placing score, and (h) corner turn test for all the mice after ICH (n = 10, per group). Statistical analyses were carried out using one‐way and two‐way ANOVA. *p < 0.05; **p < 0.01; ***p < 0.001
Figure 4
Figure 4
miR‐124 could inhibit Fpn expression post‐ICH. (a) Diagram of the scores of potential microRNAs targeting Fpn predicted by miR.org and Targetscan. (b) Relative level of potential microRNAs in the perihematomal brain tissues of mice post‐ICH compared to the paired contralateral side tissues, the results are shown as the fold change. (c) Expression levels of miR‐124 in the tissues of ICH patients (n = 4) and controls (n = 4). U6 was used as an internal control, and the results are shown as the fold change of the control. (d) Potential target sites in the 3′UTR of Fpn by miR‐124 across different mammals. (e) 293 T cells were cotransfected with plasmids expressing miR‐124 and reporter plasmids with the WT or mutated (mutant) 3′UTR of mice (left) and human (right) Fpn. Relative luciferase activity was assessed. Paired empty and reporter plasmids expressing the 3′UTR of Fpn were cotransfected as controls, and the results are shown as the fold change of the controls. (f) Protein levels of Fpn in primary neurons transfected with antagomirs and (g) mimics of miR‐124 compared to relative scrambles. (h) MRI pictures of the patients used for analysis, the corresponding serial numbers of the patients are listed in the lower left corner of each picture. (i) Relative level of miR‐124 in the serum from ICH patients (n = 8) and control individuals (con) (n = 16) (≥65 years old, average age ≥70). The results are shown as the fold change of the control. (j) Correlation analysis between the serum miR‐124 level and the NIHSS score, (k) mRS score (l) and hematoma volume of the patients (n = 8). Statistical analyses were carried out using two‐way ANOVA and t test. *p < 0.05; **p < 0.01; ***p < 0.001
Figure 5
Figure 5
Inhibition of miR‐124 alleviated the symptoms of ICH. (a) Cartoon outline of the stereotactic injection of the antagomir targeting miR‐124 in aged C57 mice (20‐month‐old). (b) miR‐124 levels in the brain tissues of ICH model mice between the contralateral side (con) and ipsilateral side (ips) injected with miR‐124 antagomir (124 anta), scrambled control (Scr), and blank control (ICH). (c) Brain sections were stained with hematoxylin and eosin (left), and lesion volume was calculated (right). The results are shown as the fold change (%) of the controls. ICH, mice without injection before ICH induction. Scr, mice with scrambled antagomir injection before ICH induction. 124, mice with miR‐124 antagomir injection before ICH induction (n = 6). (d) Sections were subjected to TUNEL staining (left), and quantification is shown (right). The results are shown as the fold change (%) of the controls (n = 5). (e) Perls' staining (left) and quantification of the staining intensity of the cells (right). The results are shown as the fold change (%) of the controls (n = 5). (f) Neurologic deficit score, (g) Forelimb placing score, and (h) corner turn test for all these mice after ICH (n = 10, per group). Statistical analyses were carried out using one‐way and two‐way ANOVA. *p < 0.05; **p < 0.01; ***p < 0.001
Figure 6
Figure 6
miR‐124/Fpn signaling mediated the outcome of ICH through apoptosis and ferroptosis. (a) Protein levels of cox2, p‐Erk 1/2, Erk 1/2, p‐mlkl, cleaved‐caspase3, and Fpn in the perihematomal brain tissues of post‐ICH mice preinjected with cre‐AAV (cre) or con virus (con) compared to sham control mice (sham). (b) Protein levels of cox2, p‐Erk 1/2, Erk 1/2, p‐mlkl, cleaved‐caspase3, and Fpn in the perihematomal brain tissues of post‐ICH mice preinjected with fpn‐AAV (Fpn) or con virus (con) compared to sham control mice (sham). (c) Protein levels of cox2, p‐Erk 1/2, Erk 1/2, p‐mlkl, cleaved‐caspase3, and Fpn in the perihematomal brain tissues of post‐ICH mice preinjected with miR‐124 antagomir (124) or scrambled control (con) compared to sham control mice (sham). (d) The quantification for the protein levels of cox2, p‐Erk 1/2, Erk 1/2, p‐mlkl, cleaved‐caspase3, and Fpn in the perihematomal brain tissues of mice after ICH in figure a (n = 3) (e) figure b (n = 3), (f) and figure c (n = 3). (g) Relative mRNA levels of ATPG53, Rpl8, CS, IREB2, and PTGS2 in the brain tissues of post‐ICH mice preinjected with cre‐AAV (cre) or con virus (con) compared to those of sham control mice (sham), (h) in the brain tissues of post‐ICH mice preinjected with fpn‐AAV (Fpn) or con virus (con) compared to sham control mice (sham), (i) and in the brain tissues of post‐ICH mice preinjected with miR‐124 antagomir (124) or scrambled control (con) compared to sham control mice (sham) (n = 6). Statistical analyses were carried out using two‐way ANOVA and multiple t test. *p < 0.05; **p < 0.01; ***p < 0.001

References

    1. Betel, D. , Koppal, A. , Agius, P. , Sander, C. , & Leslie, C. (2010). Comprehensive modeling of microRNA targets predicts functional non‐conserved and non‐canonical sites. Genome Biology, 11(8), R90 10.1186/gb-2010-11-8-r90 - DOI - PMC - PubMed
    1. Boserup, M. W. , Lichota, J. , Haile, D. , & Moos, T. (2011). Heterogenous distribution of ferroportin‐containing neurons in mouse brain. BioMetals, 24(2), 357–375. 10.1007/s10534-010-9405-2 - DOI - PubMed
    1. Caldeira, C. , Cunha, C. , Vaz, A. R. , Falcao, A. S. , Barateiro, A. , Seixas, E. , … Brites, D. (2017). Key Aging‐Associated Alterations in Primary Microglia Response to Beta‐Amyloid Stimulation. Frontiers in Aging Neuroscience, 9, 277 10.3389/fnagi.2017.00277 - DOI - PMC - PubMed
    1. Chang, C. F. , Cho, S. , & Wang, J. (2014). (‐)‐Epicatechin protects hemorrhagic brain via synergistic Nrf2 pathways. Annals of Clinical and Translational Neurology, 1(4), 258–271. 10.1002/acn3.54 - DOI - PMC - PubMed
    1. Chen, C.‐W. , Chen, T.‐Y. , Tsai, K.‐L. , Lin, C.‐L. , Yokoyama, K. K. , Lee, W.‐S. , … Hsu, C. (2012). Inhibition of autophagy as a therapeutic strategy of iron‐induced brain injury after hemorrhage. Autophagy, 8(10), 1510–1520. 10.4161/auto.21289 - DOI - PubMed

Publication types

LinkOut - more resources