. 2020 Nov 5;80(3):525-540.e9.
doi: 10.1016/j.molcel.2020.09.022. Epub 2020 Oct 16.

Characterization of Metabolic Patterns in Mouse Oocytes during Meiotic Maturation

Affiliations

Characterization of Metabolic Patterns in Mouse Oocytes during Meiotic Maturation

Ling Li et al. Mol Cell. .

Abstract

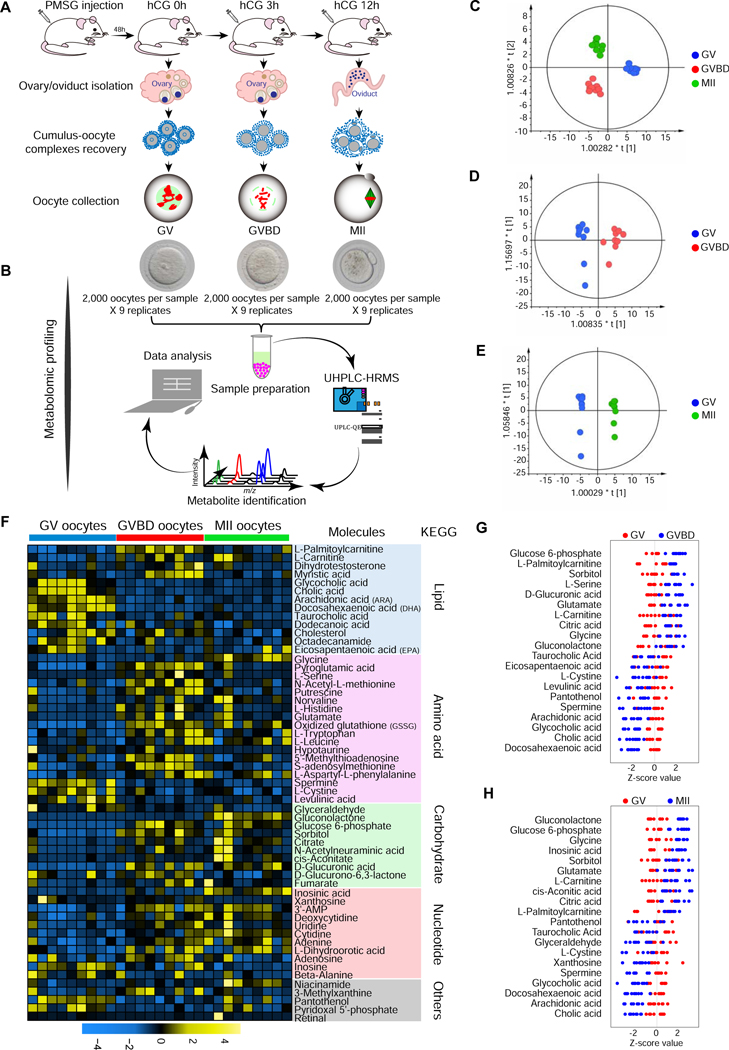
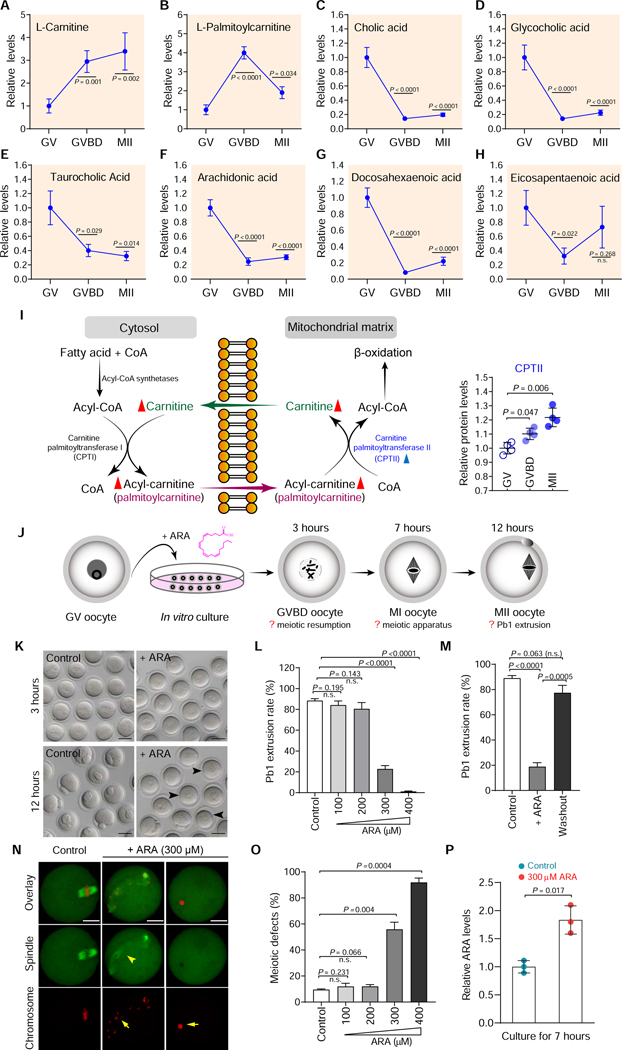
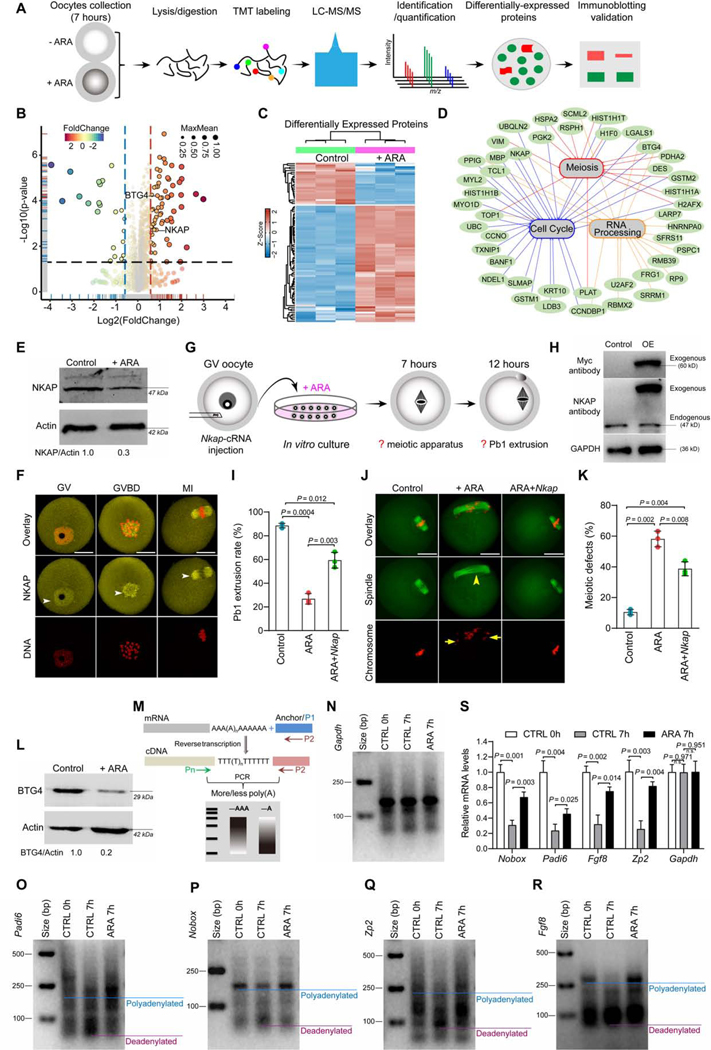
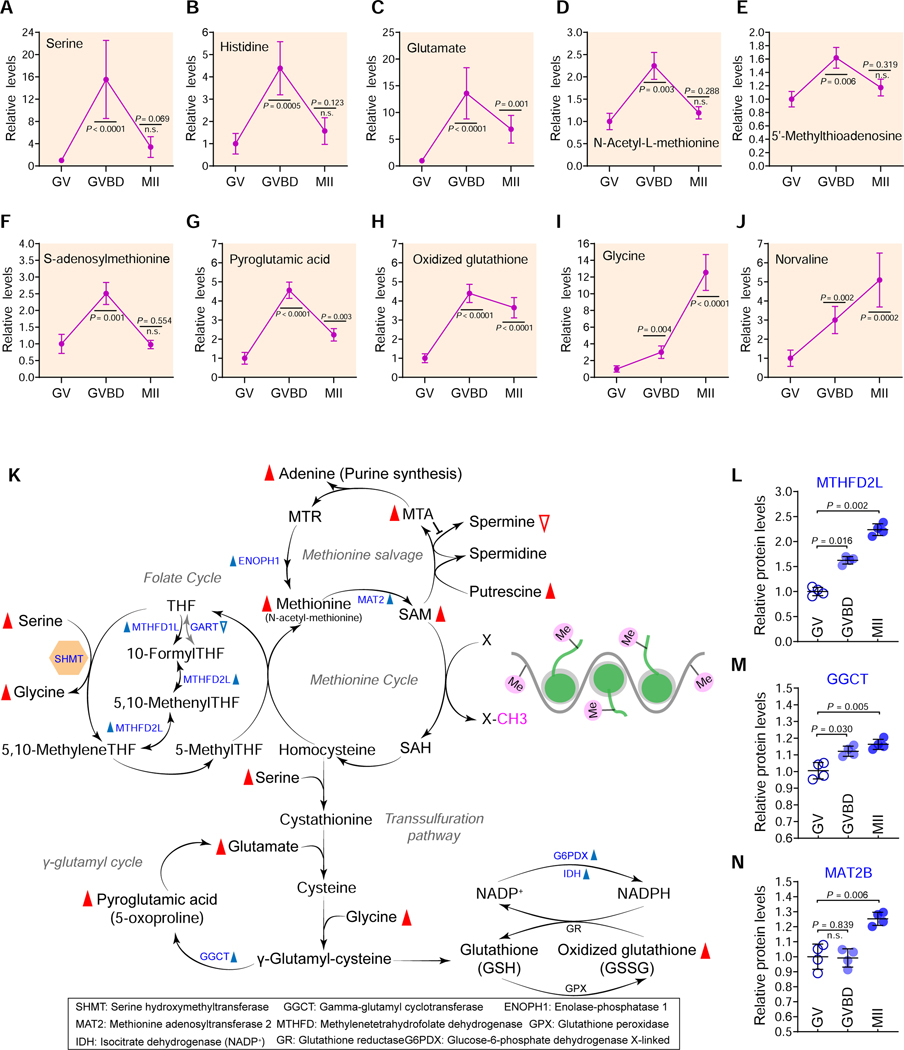
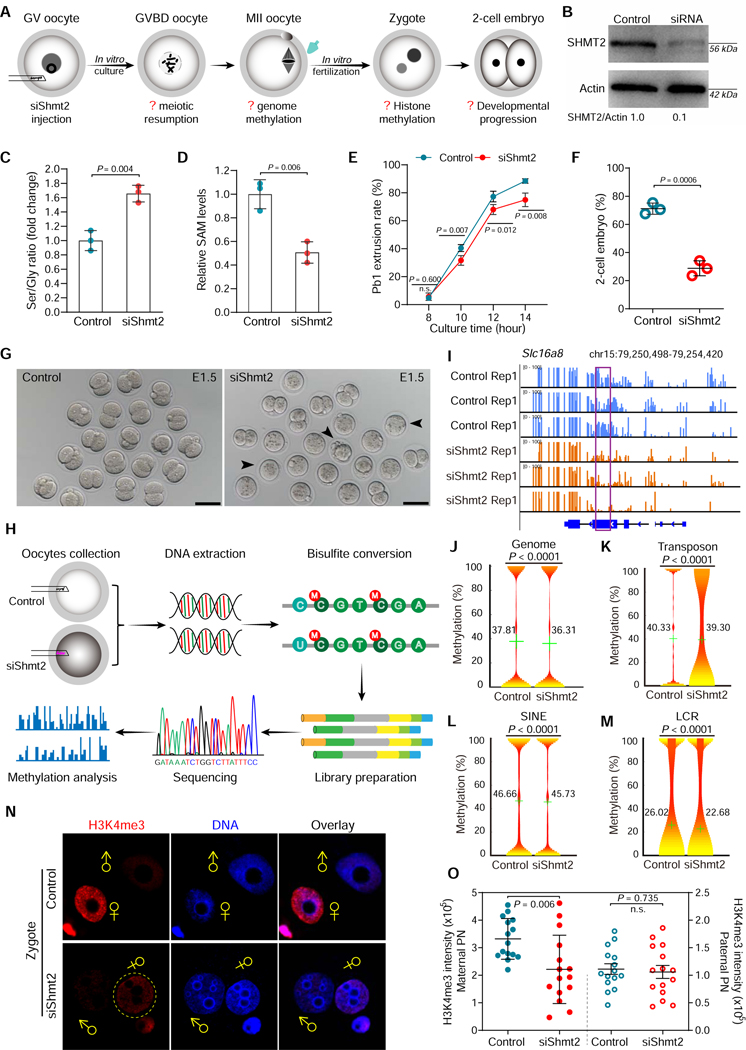
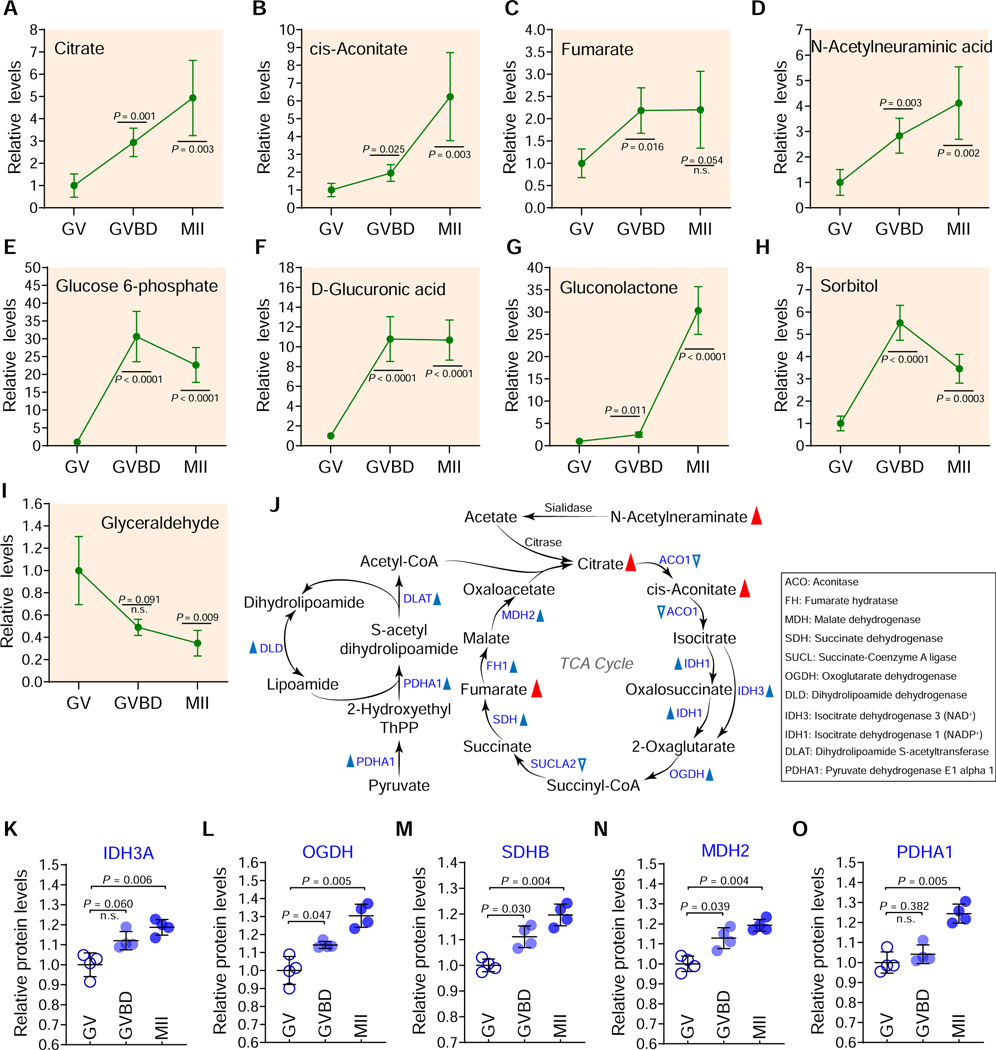
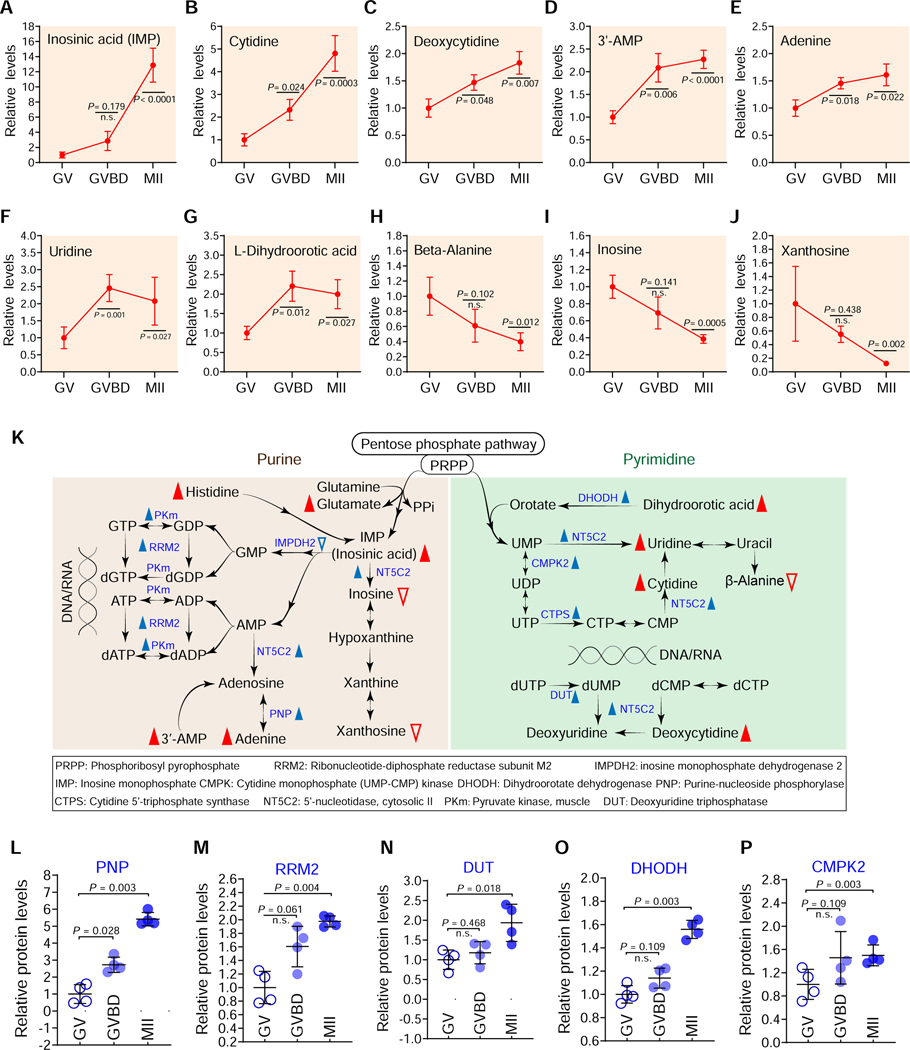
Well-balanced and timed metabolism is essential for making a high-quality egg. However, the metabolic framework that supports oocyte development remains poorly understood. Here, we obtained the temporal metabolome profiles of mouse oocytes during in vivo maturation by isolating large number of cells at key stages. In parallel, quantitative proteomic analyses were conducted to bolster the metabolomic data, synergistically depicting the global metabolic patterns in oocytes. In particular, we discovered the metabolic features during meiotic maturation, such as the fall in polyunsaturated fatty acids (PUFAs) level and the active serine-glycine-one-carbon (SGOC) pathway. Using functional approaches, we further identified the key targets mediating the action of PUFA arachidonic acid (ARA) on meiotic maturation and demonstrated the control of epigenetic marks in maturing oocytes by SGOC network. Our data serve as a broad resource on the dynamics occurring in metabolome and proteome during oocyte maturation.

Keywords: embryo; epigenetics; metabolism; oocyte; proteomics.


Conflict of interest statement

Declaration of Interests The authors declare no competing interests.

Figures

Figure 1
Figure 1. Metabolomic profiling of mouse oocyte maturation.
(A) Illustration of in vivo isolation of mouse oocytes at GV, GVBD, and MII stage. (B) Schematic overview of the workflow for metabolome profiling in oocytes. (C-E) OPLS-DA score plot separating GV, GVBD, and MII oocyte samples (Ellipse: Hotelling’s T2 99%; C: R2X(cum)=0.607, Q2X(cum)=0.832; D: R2X(cum)=0.52, Q2X(cum)=0.848; E: R2X(cum)=0.584, Q2X(cum)=0.943). (F) Heat map showing the dynamics of 57 differential metabolites during oocyte maturation, classified by metabolic pathways. (G) Z-score plot of 20 representative metabolites from (F) compared between GV and GVBD oocytes (meiotic resumption). (H) Z-score plot of 20 representative metabolites from (F) compared between GV and MII oocytes (meiotic maturation). Each point represents one metabolite in one sample, colored by stage type. See also Table S1.
Figure 2
Figure 2. Metabolic features of lipid during oocyte maturation.
(A-H) Relative levels of metabolites related to lipid metabolism in oocytes at different stages. (I) Schematic diagram of carnitine transport system and fatty acid oxidation in the mitochondria. Metabolites increased in maturing oocytes are indicated by red filled triangles, and metabolic enzymes upregulated during maturation are denoted by blue filled triangles. Relative abundance of CPTII protein in oocytes at different stages is shown. (J) Schematic presentation of the experimental protocol to examine the effects of ARA supplementation on oocyte maturation. (K) Bright-field images of control and ARA-treated oocytes. Arrowheads point to oocytes that fail to extrude a polar body. Scale bars, 50 μm. (L) Quantitative analysis of Pb1 extrusion in control and ARA-treated oocytes. (M) Quantitative analysis of Pb1 extrusion in oocytes after ARA washout. (N) Representative confocal images of control and ARA-treated oocytes stained with α-tubulin antibody to visualize the spindle (green) and with propidium iodide to visualize chromosomes (red). Spindle disorganization and chromosome misalignment are indicated by arrowheads and arrows, respectively. Scale bars, 25 μm. (O) Quantification of control and ARA-treated oocytes with abnormal spindle/chromosomes. (P) Relative ARA levels in control and ARA-treated oocytes. Data are expressed as mean percentage ± SD from three independent experiments in which at least 100 oocytes were analyzed for each group. Student’s t test was used for statistical analysis in all panels, comparing to GV or control. n.s., not significant. See also Figures S3-S7.
Figure 3
Figure 3. Identification of factors mediating the effects of ARA on oocyte maturation.
(A) Overview of the proteomic workflow for identifying differential protein accumulation. (B) Volcano plot showing the relative abundance of proteins. (C) Heat map of the differentially accumulated proteins between control and ARA-treated oocytes. (D) Gene ontology network enrichment analysis of the proteins with differential accumulation. (E) Western blot analysis of NKAP expression validated the proteomic results (200 oocytes per lane). (F) Cellular distribution of NKAP in oocytes at GV, GVBD and MI stages. Arrowheads point to NKAP signals. Scale bars, 25 μm. (G) Schematic presentation of the experimental protocol to check whether NKAP overexpression could suppress the defective phenotypes of ARA-treated oocytes. (H) Immunoblotting showing the overexpression (OE) of exogenous NKAP protein in oocytes. (I) Incidence of Pb1 extrusion in indicated oocytes. (J) Representative examples of meiotic spindle and chromosomes in indicated oocytes. Spindle disorganization and chromosome misalignment are indicated by arrowheads and arrows, respectively. Scale bars, 25 μm. (K) Quantitative analysis of meiotic defects in indicated oocytes. At least 100 oocytes for each group were analyzed, and the experiments were conducted three times. (L) Western blot analysis of BTG4 expression validated the proteomic results (200 oocytes per lane). (M) Diagram showing the strategy of the mRNA poly(A) tail (PAT) assay. P1, anchor primer; P2, P1-antisense primer; Pn, gene-specific primer. (N-R) PAT assay showing changes in the poly(A)-tail length for the indicated transcripts in control and ARA-treated oocytes. (S) Relative abundance of the indicated transcripts in control and ARA-treated oocytes, determined by real-time RT-PCR. Error bars, SD. Student’s t test was used for statistical analysis in all panels. n.s., not significant. See also Figure S8 and Table S3.
Figure 4
Figure 4. Metabolic changes in amino acids during oocyte maturation.
Relative levels of metabolites related to amino acid metabolism in oocytes at different stages. (K) Schematic diagram of SGOC network during oocyte maturation, derived from metabolomics and proteomics. Metabolites increased and decreased in maturing oocytes are indicated by red filled and empty triangles, respectively. The blue filled and empty triangles denote the metabolic enzymes that were upregulated and downregulated, respectively. (L-N) Relative abundance of the representative enzymes (MTHFD2L, GGCT and MAT2B) involved in the folate/methionine cycle and the transsulfuration pathway. Error bars, SD. Student’s t test was used for statistical analysis in all panels, comparing to GV. n.s., not significant. See also Figure S9.
Figure 5
Figure 5. SHMT2 depletion impairs the epigenetic landscape in oocytes.
(A) Schematic presentation of the Shmt2 knockdown experiments. (B) Depletion of endogenous SHMT2 protein was verified by western blot analysis (200 oocytes per lane). (C) Serine-to-Glycine ratio in control (n=300) and siShmt2 (n=300) oocytes. (D) Relative levels of SAM in control (n=300) and siShmt2 (n=300) oocytes. (E) Quantitative analysis of Pb1 extrusion in control (n=102) and siShmt2 (n=105) oocytes. (F) Percentages of control (n=85) and siShmt2 (n=92) oocytes-derived embryos that develop to 2-cell stage during in vitro culture. (G) Bright-field images of E1.5 embryos derived from control and siShmt2 oocytes. Scale bars, 100 μm. (H) Flow chart illustrating the BS-Seq procedure for genome-wide methylation analysis. MII oocytes were collected and the DNA was bisulfite converted, followed by library preparation and high-throughput sequencing. (I) Graphical representation of the methylation pattern at Slc16a8 in control and siShmt2 oocytes. The highlighted region by purple box was chosen to show the significant hypomethylation in this locus following Shmt2 ablation. (J-M) Violin plots showing the methylation levels for distinct genomic features in control and siShmt2 oocytes. Mean methylation levels are indicated by the numerical value and green cross. (N) Images of control and siShmt2 zygotes co-stained with anti-H3K4me3 antibody (red) and Hoechst 33342 (blue). ♂and♀indicate paternal (PN) and maternal (MN) pronucleus, respectively. PB, polar body. (O) Quantification of H3K4me3 fluorescence shown in (N). Each data point represents a zygote (n = 15 for each group). Error bars, SD. Student’s t test was used for statistical analysis in all panels except for J-M, comparing to control. n.s., not significant. See also Figure S10.
Figure 6
Figure 6. Carbohydrate metabolism during oocyte maturation.
(A-I) Relative levels of metabolites related to carbohydrate metabolism in oocytes at different stages. (J) Schematic diagram of TCA cycle and pyruvate oxidation during oocyte maturation, derived from metabolomics and proteomics. Metabolites increased in maturing oocytes are indicated by red filled triangles. The blue filled and empty triangles denote metabolic enzymes that were upregulated and downregulated, respectively. (K-O) Relative abundance of the representative enzymes (IDH3A, OGDH, SDHB, MDH2, and PDHA1) involved in TCA cycle and pyruvate oxidation. Error bars, SD. Student’s t test was used for statistical analysis in all panels, comparing to GV. n.s., not significant. See also Figures S11-S12.
Figure 7
Figure 7. Nucleotide metabolism during oocyte maturation.
Relative levels of metabolites related to nucleotide metabolism in oocytes at different stages. (K) Schematic diagram of purine and pyrimidine metabolism during oocyte maturation, derived from metabolomics and proteomics. Metabolites increased and decreased in maturing oocytes are indicated by red filled and empty triangles, respectively. The blue filled and empty triangles denote metabolic enzymes that were upregulated and downregulated, respectively. (L-P) Relative abundance of the representative enzymes (PNP, PRM2, DUT, DHODH and CMPK2) involved in purine and pyrimidine metabolism. Error bars, SD. Student’s t test was used for statistical analysis in all panels, comparing to GV. n.s., not significant. See also Figures S14-S16.

References

    1. Biggers JD, Whittingham DG, and Donahue RP (1967). The Pattern of Energy Metabolism in the Mouse Oocyte and Zygote. Proc Natl Acad Sci U S A 58, 560–567. - PMC - PubMed
    1. Bodden C, Hannan AJ, and Reichelt AC (2020). Diet-Induced Modification of the Sperm Epigenome Programs Metabolism and Behavior. Trends Endocrinol Metab 31, 131–149. - PubMed
    1. Broughton DE, and Moley KH (2017). Obesity and Female Infertility: Potential Mediators of Obesity’s Impact. Fertil Steril 107, 840–847. - PubMed
    1. Brunet S, Pahlavan G, Taylor S, and Maro B (2003). Functionality of the Spindle Checkpoint During the First Meiotic Division of Mammalian Oocytes. Reproduction 126, 443–450. - PubMed
    1. Burgute BD, Peche VS, Steckelberg AL, Glockner G, Gassen B, Gehring NH, and Noegel AA (2014). Nkap Is a Novel Rs-Related Protein That Interacts with Rna and Rna Binding Proteins. Nucleic Acids Res 42, 3177–3193. - PMC - PubMed

Publication types