

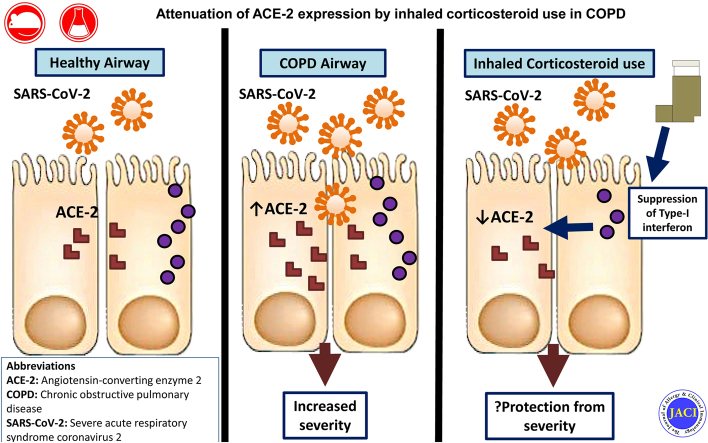
Inhaled corticosteroids downregulate the SARS-CoV-2 receptor ACE2 in COPD through suppression of type I interferon
- PMID: 33068560
- PMCID: PMC7558236
- DOI: 10.1016/j.jaci.2020.09.034
Inhaled corticosteroids downregulate the SARS-CoV-2 receptor ACE2 in COPD through suppression of type I interferon
Abstract
Background: The mechanisms underlying altered susceptibility and propensity to severe Coronavirus disease 2019 (COVID-19) disease in at-risk groups such as patients with chronic obstructive pulmonary disease (COPD) are poorly understood. Inhaled corticosteroids (ICSs) are widely used in COPD, but the extent to which these therapies protect or expose patients to risk of severe COVID-19 is unknown.
Objective: The aim of this study was to evaluate the effect of ICSs following pulmonary expression of the SARS-CoV-2 viral entry receptor angiotensin-converting enzyme-2 (ACE2).
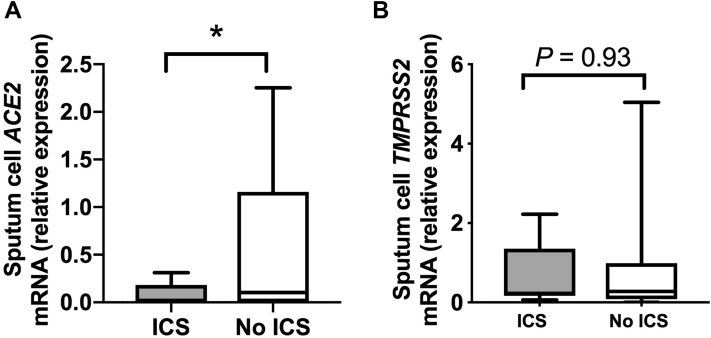
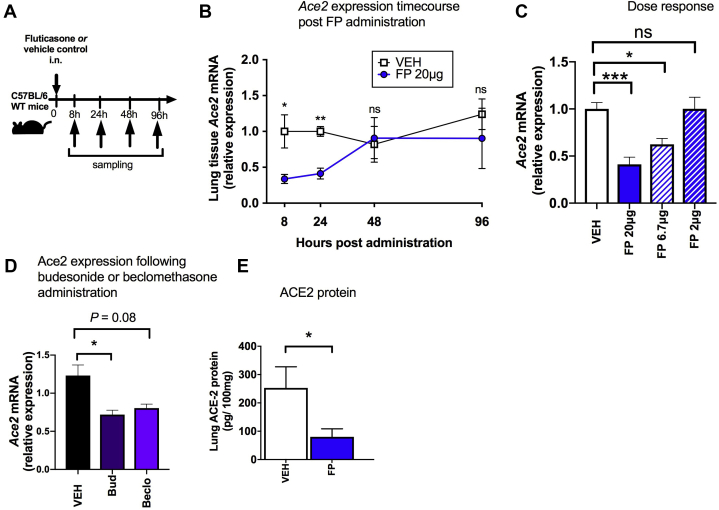
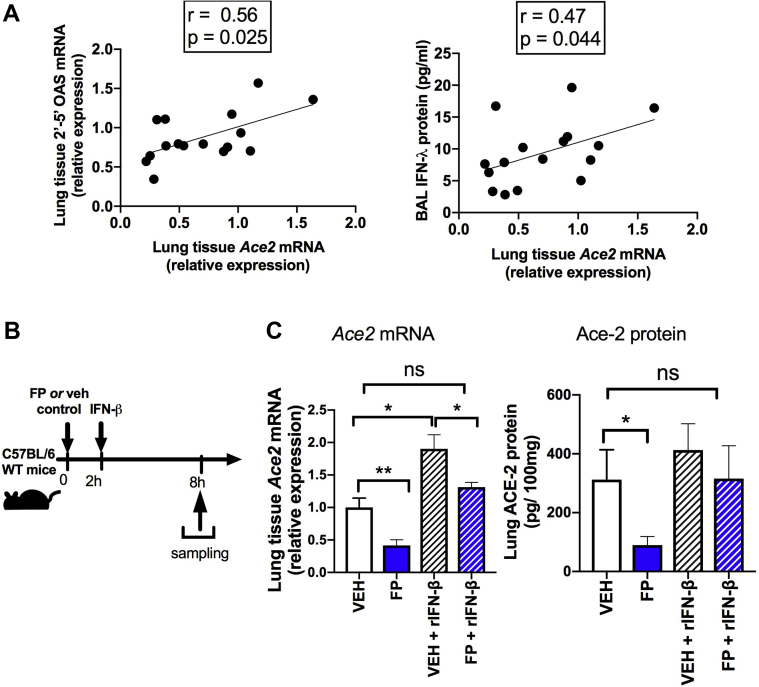
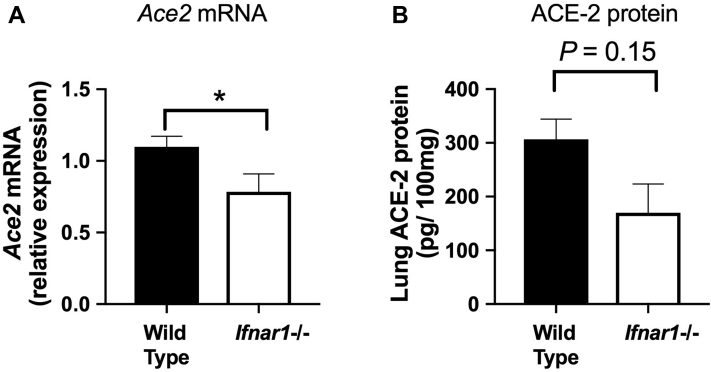
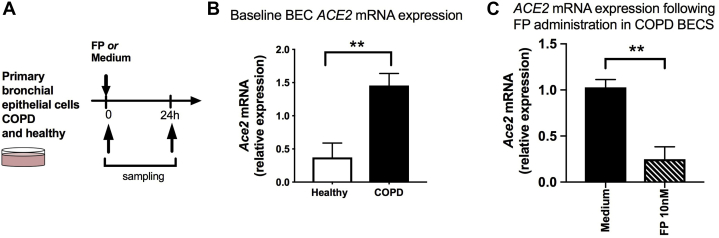
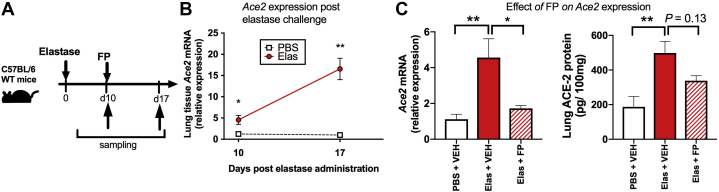
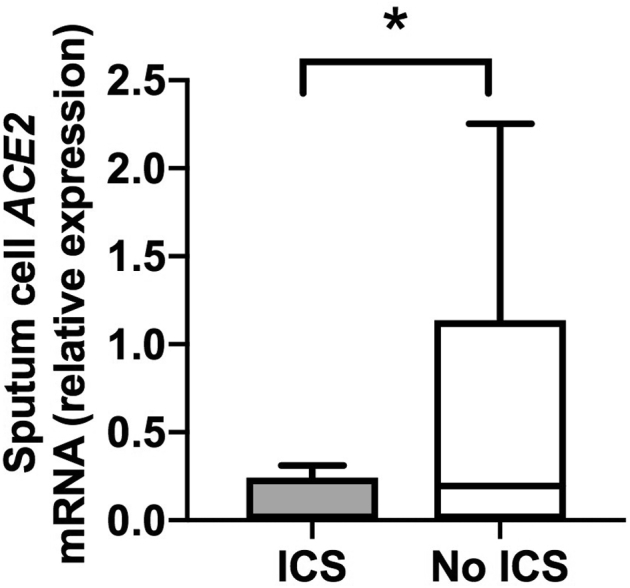
Methods: We evaluated the effect of ICS administration on pulmonary ACE2 expression in vitro in human airway epithelial cell cultures and in vivo in mouse models of ICS administration. Mice deficient in the type I IFN-α/β receptor (Ifnar1-/-) and administration of exogenous IFN-β were used to study the functional role of type-I interferon signaling in ACE2 expression. We compared sputum ACE2 expression in patients with COPD stratified according to use or nonuse of ICS.
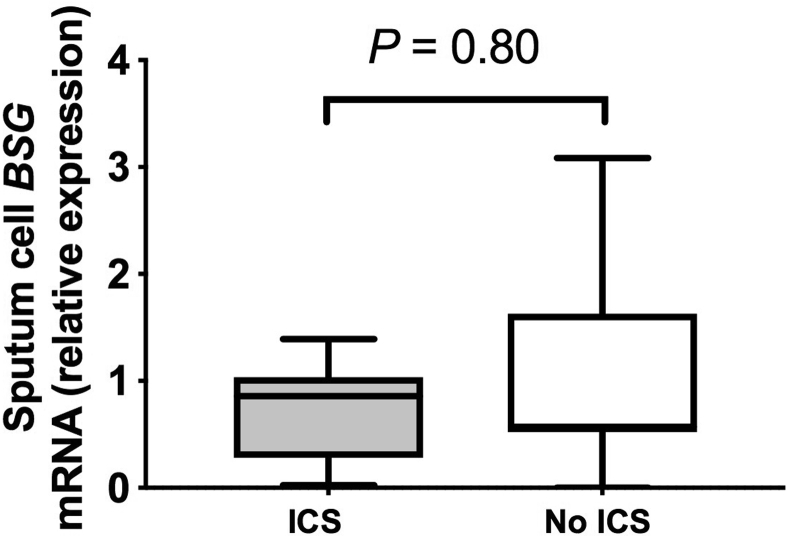
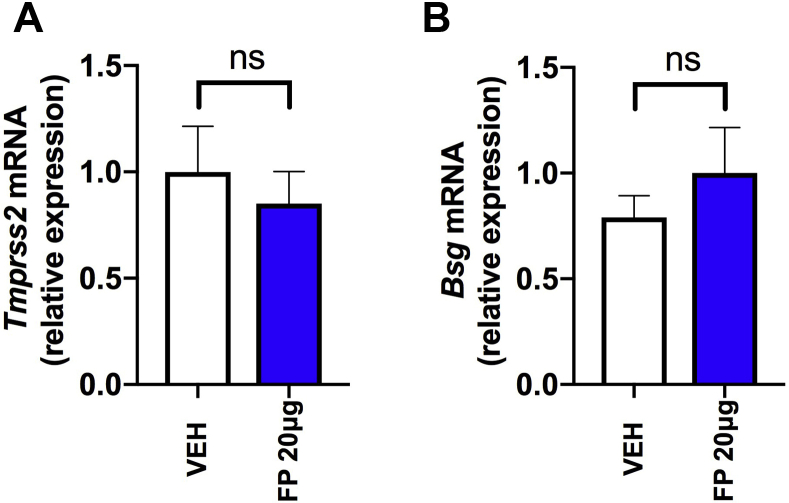
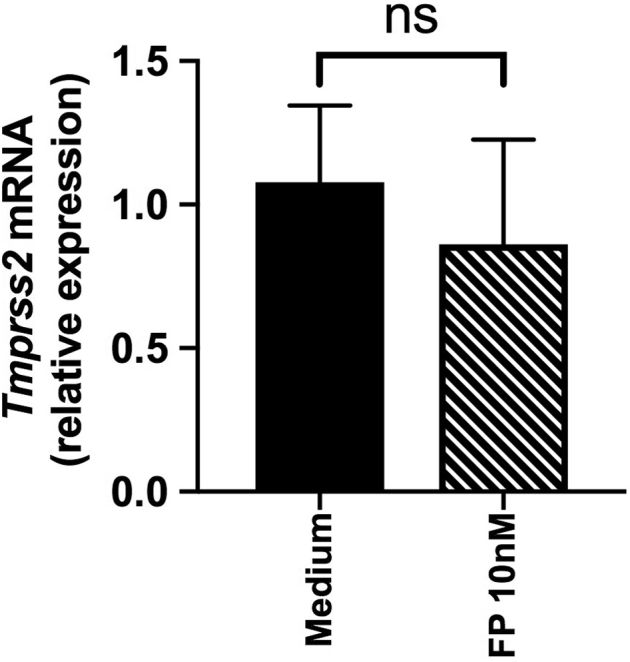
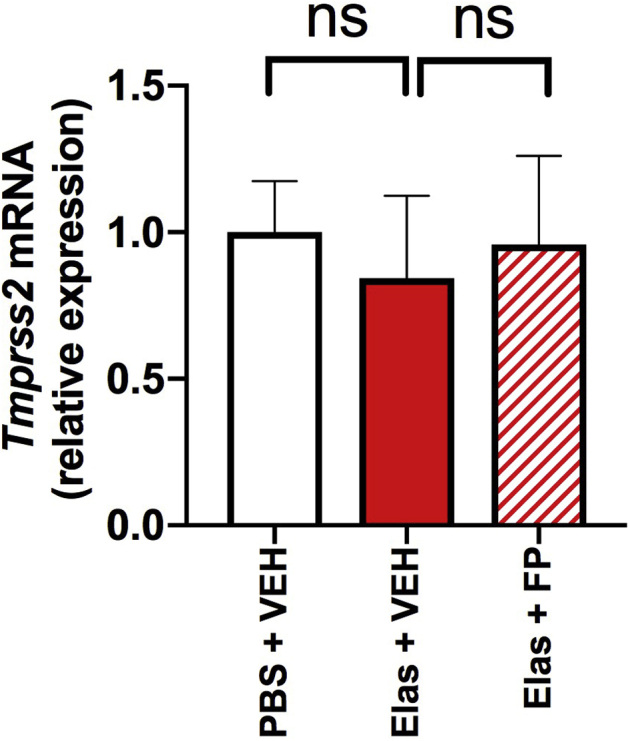
Results: ICS administration attenuated ACE2 expression in mice, an effect that was reversed by exogenous IFN-β administration, and Ifnar1-/- mice had reduced ACE2 expression, indicating that type I interferon contributes mechanistically to this effect. ICS administration attenuated expression of ACE2 in airway epithelial cell cultures from patients with COPD and in mice with elastase-induced COPD-like changes. Compared with ICS nonusers, patients with COPD who were taking ICSs also had reduced sputum expression of ACE2.
Conclusion: ICS therapies in COPD reduce expression of the SARS-CoV-2 entry receptor ACE2. This effect may thus contribute to altered susceptibility to COVID-19 in patients with COPD.
Keywords: COPD; COVID-19; inhaled corticosteroids; viral infection.
Copyright © 2020 The Authors. Published by Elsevier Inc. All rights reserved.
Figures
Comment in
-
Inhaled corticosteroids and angiotensin-converting enzyme-2 in COPD.J Allergy Clin Immunol. 2021 Mar;147(3):1117. doi: 10.1016/j.jaci.2020.11.018. Epub 2020 Dec 30. J Allergy Clin Immunol. 2021. PMID: 33388167 Free PMC article. No abstract available.
-
Reply.J Allergy Clin Immunol. 2021 Mar;147(3):1117-1118. doi: 10.1016/j.jaci.2020.11.019. Epub 2020 Dec 30. J Allergy Clin Immunol. 2021. PMID: 33388170 Free PMC article. No abstract available.
References
-
- Public Health England COVID-19: guidance on social distancing for everyone in the UK. https://www.gov.uk/government/publications/covid-19-guidance-on-social-d... Available at: Accessed July 7, 2020.
MeSH terms
Substances
LinkOut - more resources
Full Text Sources
Other Literature Sources
Medical
Molecular Biology Databases
Miscellaneous
