. 2020 Dec 15:409:115284.
doi: 10.1016/j.taap.2020.115284. Epub 2020 Oct 15.

Biological effects of inhaled hydraulic fracturing sand dust. IV. Pulmonary effects

Affiliations

Biological effects of inhaled hydraulic fracturing sand dust. IV. Pulmonary effects

Kristen A Russ et al. Toxicol Appl Pharmacol. .

Abstract

Hydraulic fracturing creates fissures in subterranean rock to increase the flow and retrieval of natural gas. Sand ("proppant") in fracking fluid injected into the well bore maintains fissure patency. Fracking sand dust (FSD) is generated during manipulation of sand to prepare the fracking fluid. Containing respirable crystalline silica, FSD could pose hazards similar to those found in work sites where silica inhalation induces lung disease such as silicosis. This study was performed to evaluate the possible toxic effects following inhalation of a FSD (FSD 8) in the lung and airways. Rats were exposed (6 h/d × 4 d) to 10 or 30 mg/m3 of a FSD collected at a gas well, and measurements were performed 1, 7, 27 and, in one series of experiments, 90 d post-exposure. The following ventilatory and non-ventilatory parameters were measured in vivo and/or in vitro: 1) lung mechanics (respiratory system resistance and elastance, tissue damping, tissue elastance, Newtonian resistance and hysteresivity); 2) airway reactivity to inhaled methacholine (MCh); airway epithelium integrity (isolated, perfused trachea); airway efferent motor nerve activity (electric field stimulation in vitro); airway smooth muscle contractility; ion transport in intact and cultured epithelium; airway effector and sensory nerves; tracheal particle deposition; and neurogenic inflammation/vascular permeability. FSD 8 was without large effect on most parameters, and was not pro-inflammatory, as judged histologically and in cultured epithelial cells, but increased reactivity to inhaled MCh at some post-exposure time points and affected Na+ transport in airway epithelial cells.

Keywords: Fracking sand dust; Hydraulic fracturing; Lung; Pulmonary toxicity.


Conflict of interest statement

Conflict of Interest Statement

The authors declare that they have no conflicts of interest in relation to this publication.

Figures

Fig. 1.
Fig. 1.
Schematic diagram of the FSD inhalation exposure system. Abbreviations: MFC, mass flow controller; APS, aerosol particle sizer; SMPS, scanning mobility particle sizer; MOUDI, microorifice uniform deposit impactor; TEM, transmission electron microscope; SEM, scanning electron microscope.
Fig. 2.
Fig. 2.
FSD 8 mass concentrations in the exposure chamber during generation of 10 and 30 mg/m3 aerosols. After reaching 95% of the desired concentrations the levels of FSD were constant over the 6-h period used for exposing animals.
Fig. 3.
Fig. 3.
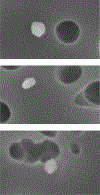
Representative FSD 8 and MIN-U-SIL particles showing small particles adherent to larger particles on comparably sized particles.
Fig. 4.
Fig. 4.
Representative FSD 8 particles of approximately 100 nm diameter.
Fig. 5.
Fig. 5.
Size distribution of FSD 8 particles measured optically. The sizes indicated are those of the particles’ major axis.
Fig. 6.
Fig. 6.
Aerodynamic mass size distribution of FSD 8 determined with MOUDI. The mass geometric mean±standard error was 1.75±2.4 μm.
Fig. 7.
Fig. 7.
SMPS estimated aerodynamic FSD 8 particle diameter count size distribution. The count geometric mean±standard error was 227±1.7 nm.
Fig. 8.
Fig. 8.
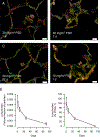
FSD 8 clearance rates from the lung. A, Enhanced dark-field image of the alveolar region at 1 d post-exposure after 30 mg/m3 FSD 8 exposure. B, Enhanced dark-field image of the alveolar region at 7 d post-exposure after 30 mg/m3 FSD 8 exposure. C, Enhanced dark-field image of the alveolar region at 27 d post-exposure after 30 mg/m3 FSD 8 exposure. D, Enhanced dark-field image of the alveolar region at 1 d post-exposure after 10 mg/m3 FSD 8 exposure. E, Lung burden of FSD 8 based on the 30 mg/m3 FSD 8 exposure in terms of volume fraction of particles and percentage measured on day 1.
Fig. 9.
Fig. 9.
A, Enhanced dark-field image of unstained tracheal wall from filtered air-exposed rats showing the epithelium and mucus layer. A layer of preserved mucus (large arrow) can be seen above the epithelial cells. In different regions, the mucus is intermixed with cilia (small arrow) and the domes of club cells. Bar = 5 μ. B, Enhanced dark-field image of unstained tracheal wall showing FSD 8 particles in mucus at 1 d following exposure to 30 mg/m3 FSD 8. The image demonstrates one large cluster of FSD 8 particles and two smaller FSD 8 particles above the epithelium of the trachea (white arrows). No significant particles were associated with the epithelium at post-exposure days 7 or 27. Bar = 10 μ.
Fig. 10.
Fig. 10.
Effect of inhalation of 10 mg/m3 and 30 mg/m3 FSD 8 on respiratory system resistance (left panel) and respiratory system elastance (right panel) 1, 7 and 27 d post-exposure. n = 8 animals per group per time point. FSD 8 had no effect on these parameters. Additional parameters (Newtonian resistance, hysteresivity, tissue damping, and tissue elastance) are presented in Figs. S3 and S4.
Fig. 11.
Fig. 11.
Effect of inhalation of 10 and 30 mg/m3 FSD 8 on basal RL and Cdyn 1, 7 and 27 d post-exposure. n values were as follows: for 10 mg/m3, contol, n = 7, 6 and 8, and FSD 8, n = 6, 7, and 8, respectively, for 1, 7 and 27 d post-exposure periods; for 30 mg/m3, control, n = 12, 8 and 5, and FSD 8, n = 8, 8, and 7, respectively, for 1, 7 and 27 d post-exposure periods. FSD 8 had no effect on these parameters.
Fig. 12.
Fig. 12.
Effect of inhalation of 10 and 30 mg/m3 FSD 8 on RL responses to inhaled MCh aerosol 1, 7 and 27 d post-exposure. n values were as follows: for 10 mg/m3, contol, n = 7, 6 and 8, and FSD 8, n = 6, 7, and 8, respectively, for 1, 7 and 27 d post-exposure periods; for 30 mg/m3, control, n = 12, 8 and 5, and FSD 8, n = 8, 8, and 7, respectively, for 1, 7 and 27 d post-exposure periods. These results depict changes in RL from basal values in response to MCh (Fig. 12). *P < 0.05, air-breathing controls vs. FSD 8-exposed. The raw data from which these results were normalized is presented in Fig. S5.
Fig. 13.
Fig. 13.
Effect of inhalation of 10 and 30 mg/m3 FSD 8 on Cdyn responses to inhaled MCh aerosol 1, 7 and 27 d post-exposure. n values were as follows: for 10 mg/m3, contol, n = 7, 6 and 8, and FSD 8, n = 6, 7, and 8, respectively, for 1, 7 and 27 d post-exposure periods; for 30 mg/m3, control, n = 12, 8 and 5, and FSD 8, n = 8, 8, and 7, respectively, for 1, 7 and 27 d post-exposure periods. *P < 0.05, air-breathing controls vs. FSD 8-exposed. These results depict changes in Cdyn from basal values in response to MCh (Fig. 12). The raw data from which these results were normalized is presented in Fig. S6.
Fig. 14.
Fig. 14.
Reactivity of the isolated, perfused trachea preparation to MCh applied to the EL and IL baths, 1, 7 and 27 d following exposure to 10 (left six panels) and 30 mg/m3 (right six panels) FSD 8. In this figure, the responses to MCh are plotted in terms of the maximum contractile response for the EL curve and the IL curve. In each cluster, the panels in the left column depict concentration-response curves obtained following the cumulative additions of MCh to the EL bath; the panels in the right column depict concentration-response curves obtained following the cumulative additions of MCh to the IL bath. For each FSD 8 dose and post-exposure time point the EL and IL curves were both obtained from each trachea. n values were as follows: for 10 mg/m3, EL curves, n = 8, 4 and 6, and IL curves, n = 5, 5, and 5, respectively, for 1, 7 and 27 d post-exposure periods; for 30 mg/m3, EL curves, n = 5, 6 and 5, and IL curves, n = 5, 6, and 5, respectively, for 1, 7 and 27 d post-exposure periods. *P < 0.05, air-breathing controls vs. FSD 8-exposed.
Fig. 15.
Fig. 15.
Reactivity of the isolated, perfused trachea preparation to MCh applied to the IL bath, 1, 7 and 27 d following exposure to 10 (upper row) and 30 mg/m3 (lower row) FSD 8. In this figure the responses to MCh are normalzed in terms of the maximum contractile response obtained during the addition of MCh to the IL bath. Refer to the legend of Fig. 15 for n values. *P < 0.05, air-breathing controls vs. FSD 8-exposed.
Fig. 16.
Fig. 16.
Frequency-response curves from tracheal strips 1, 7 and 27 d following inhalation of 10 mg/m3 FSD 8 (upper row or panels) or 30 mg/m3 FSD 8 (lower row of panels). n = 8 per group per time point except for 10 mg/m3 FSD 8 at 7 d post-exposure for which n = 7. *P < 0.05, air-breathing controls vs. FSD 8-exposed.
Fig. 17.
Fig. 17.
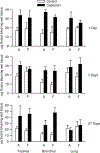
Effect of inhalation of 30 mg/m3 FSD 8 on Evans blue dye extravasation in trachea, bronchi and lung in response to capsaicin, 1, 7 and 27 d after exposure. A, air-breathing controls; F, FSD 8-exposed animals. n = 6 for all groups and time points except air + capsaicin day 1 post-exposure and FSD 8 no capsaicin day 27 post-exposure, for which n = 5.
Fig. 18.
Fig. 18.
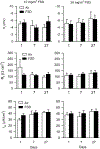
Basal Vt, Rt and Isc values of tracheal epithelium from animals exposed to 10 mg/m3 FSD 8 (left column) or 30 mg/m3 FSD 8 (right column) or filtered air at 1, 7 and 27 d after exposure. n values were as follows: for 10 mg/m3, contol, n = 8, 8 and 5, and FSD 8, n = 8, 7, and 6, respectively, for 1, 7 and 27 d post-exposure periods; for 30 mg/m3, control, n = 8, 8 and 8, and FSD 8, n = 8, 7, and 8, respectively, for 1, 7 and 27 d post-exposure periods.
Fig. 19.
Fig. 19.
Effect of inhalation of 30 mg/m3 FSD 8 on responses of tracheal epithelium to ion transport inhibitors 1 day (left column), 7 d (middle column) and 27 d (right column) post-exposure. The Figure depicts the effects of FSD 8 exposure on bioelectric responses of the epithelium to amiloride added to the apical chamber, NPPB added to the apical chamber, and ouabain added to the basolateral chamber. The data are normalized with respect to basal values shown in Fig. 19, and are expressed in terms of responses as % change from basal values. Fig. S9 depicts the raw data from which the normalized data were derived. n values were as follows: for 10 mg/m3, contol, n = 8, 8 and 5, and FSD 8, n = 8, 7, and 6, respectively, for 1, 7 and 27 d post-exposure periods; for 30 mg/m3, control, n = 8, 8 and 8, and FSD 8, n = 8, 7, and 8, respectively, for 1, 7 and 27 d post-exposure periods. *P < 0.05, air-breathing controls vs. FSD 8-exposed.
Fig. 20.
Fig. 20.
Basal Vt, Rt and Isc values of NHBE cells exposed to 0.0001, 0.001, 0.01, 0.1, and 1 mg/insert FSD 8 (n = 8). FSD 8 induced effects on Vt at 0.1 mg/insert and on Rt at 0.0001, 0.001, and 0.1 mg/insert. No changes were observed in Isc. *P < 0.05, medium vs. FSD 8-exposed NHBE cells.
Fig. 21.
Fig. 21.
Effect of FSD 8 on LDH release into the apical medium following an 18-h incubation of NHBE cells with FSD 8. There were no effects of FSD 8 on LDH release at any FSD 8 concentration. LDH was not released into the basolateral medium of control or FSD 8-exposed cells. n = 8, 8, 8, 8, 7, 8 for control, 0.0001, 0.001, 0.01, 0.1, and 1 mg/insert, respectively.
Fig. 22.
Fig. 22.
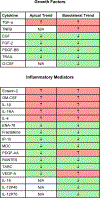
Effect of FSD 8 on cytokine presence in apical or basolateral medium following an 18-h incubation of NHBE cells with FSD 8. Linear regression was utilized to determine the trend as either increasing or decreasing across the concentrations of FSD 8 (control, 0.0001, 0.001, 0.01, 0.1, and 1 mg/insert FSD 8). n = 3 for all exposure groups.

References

    1. Anderson SE, Shane H, Long C, Marrocco A, Lukomska E, Roberts JR, Marshall N, and Fedan JS, 2020. Biological effects of inhaled hydraulic fracturing sand dust. VIII. Immunotoxicity. Toxicol Appl Pharmacol (Manuscript submitted to this journal as a tandem paper to accompany this manuscript.) - PMC - PubMed
    1. Bartoszewski R, Matalon S, Collawn JF, 2017. Ion channels of the lung and their role in disease pathogenesis. Am J Physiol Lung Cell Mol Physiol 313, L859–L872. - PMC - PubMed
    1. Castranova V, Porter D, Millecchia L, Ma JY, Hubbs AF, Teass A, 2002. Effect of inhaled crystalline silica in a rat model: time course of pulmonary reactions. Mol Cell Biochem 234–235, 177–184. - PubMed
    1. Claesson-Welsh L, 2016. VEGF receptor signal transduction – A brief update. Vacsul Pharmacol. 86, 14–17. doi: 10.1016/j.vph.2016.05.011 - DOI - PubMed
    1. Dai J, Gilks B, Price K, Churg A, 1998. Mineral dusts directly induce epithelial and interstitial fibrogenic mediators and matrix components in the airway wall. Am J Respir Crit Care Med 158, 1907–1913. - PubMed

Publication types