. 2020 Dec 15:409:115282.
doi: 10.1016/j.taap.2020.115282. Epub 2020 Oct 15.

Biological effects of inhaled hydraulic fracturing sand dust. II. Particle characterization and pulmonary effects 30 d following intratracheal instillation

Affiliations

Biological effects of inhaled hydraulic fracturing sand dust. II. Particle characterization and pulmonary effects 30 d following intratracheal instillation

Jeffrey S Fedan et al. Toxicol Appl Pharmacol. .

Abstract

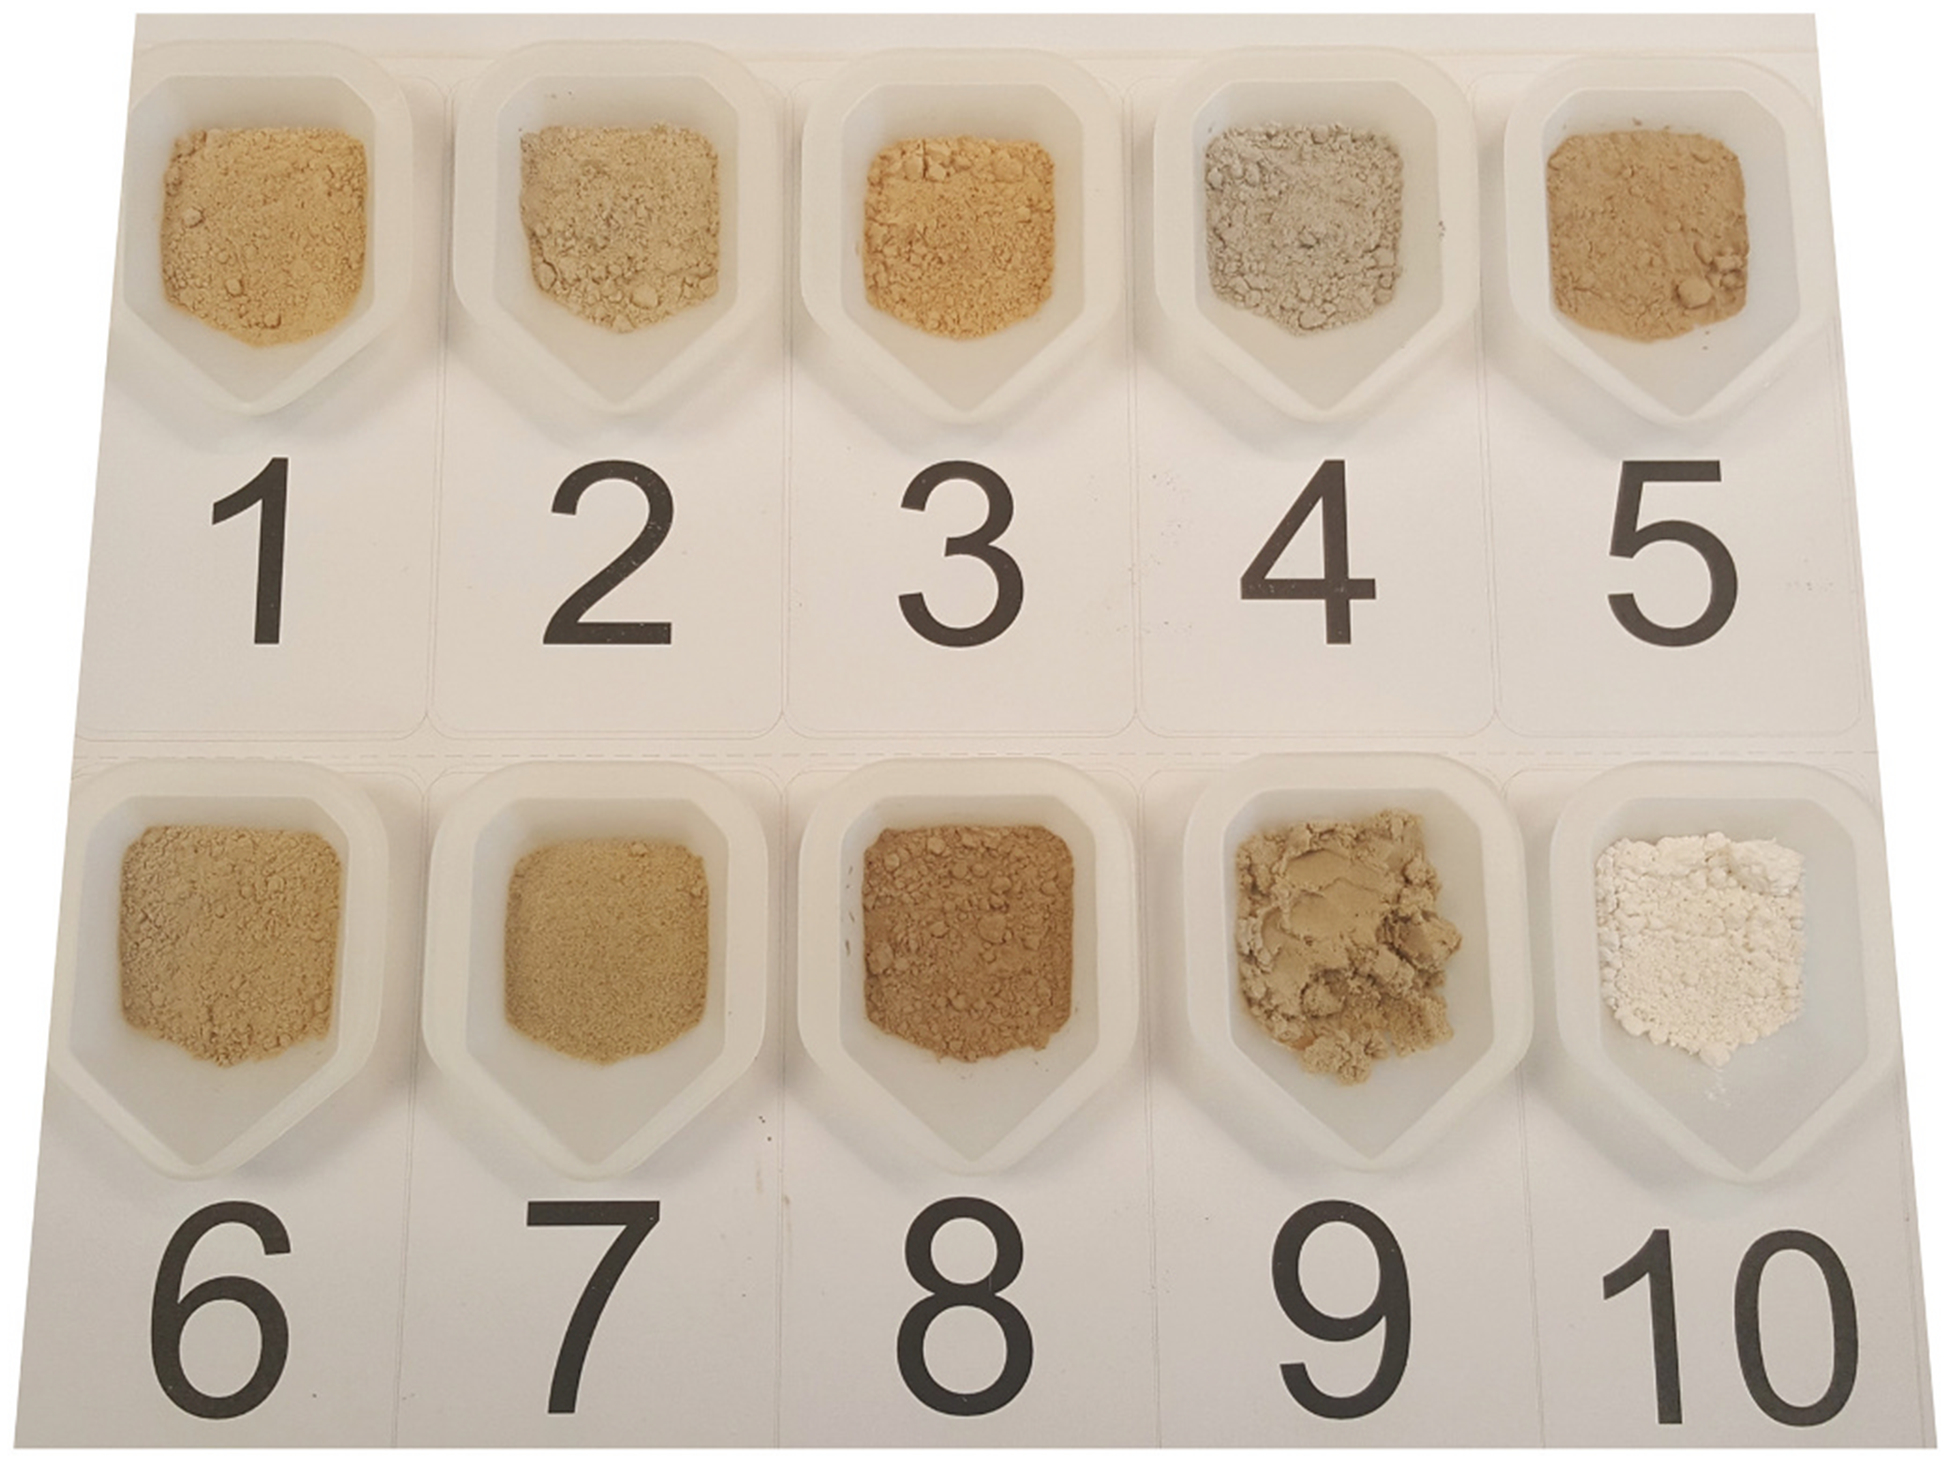
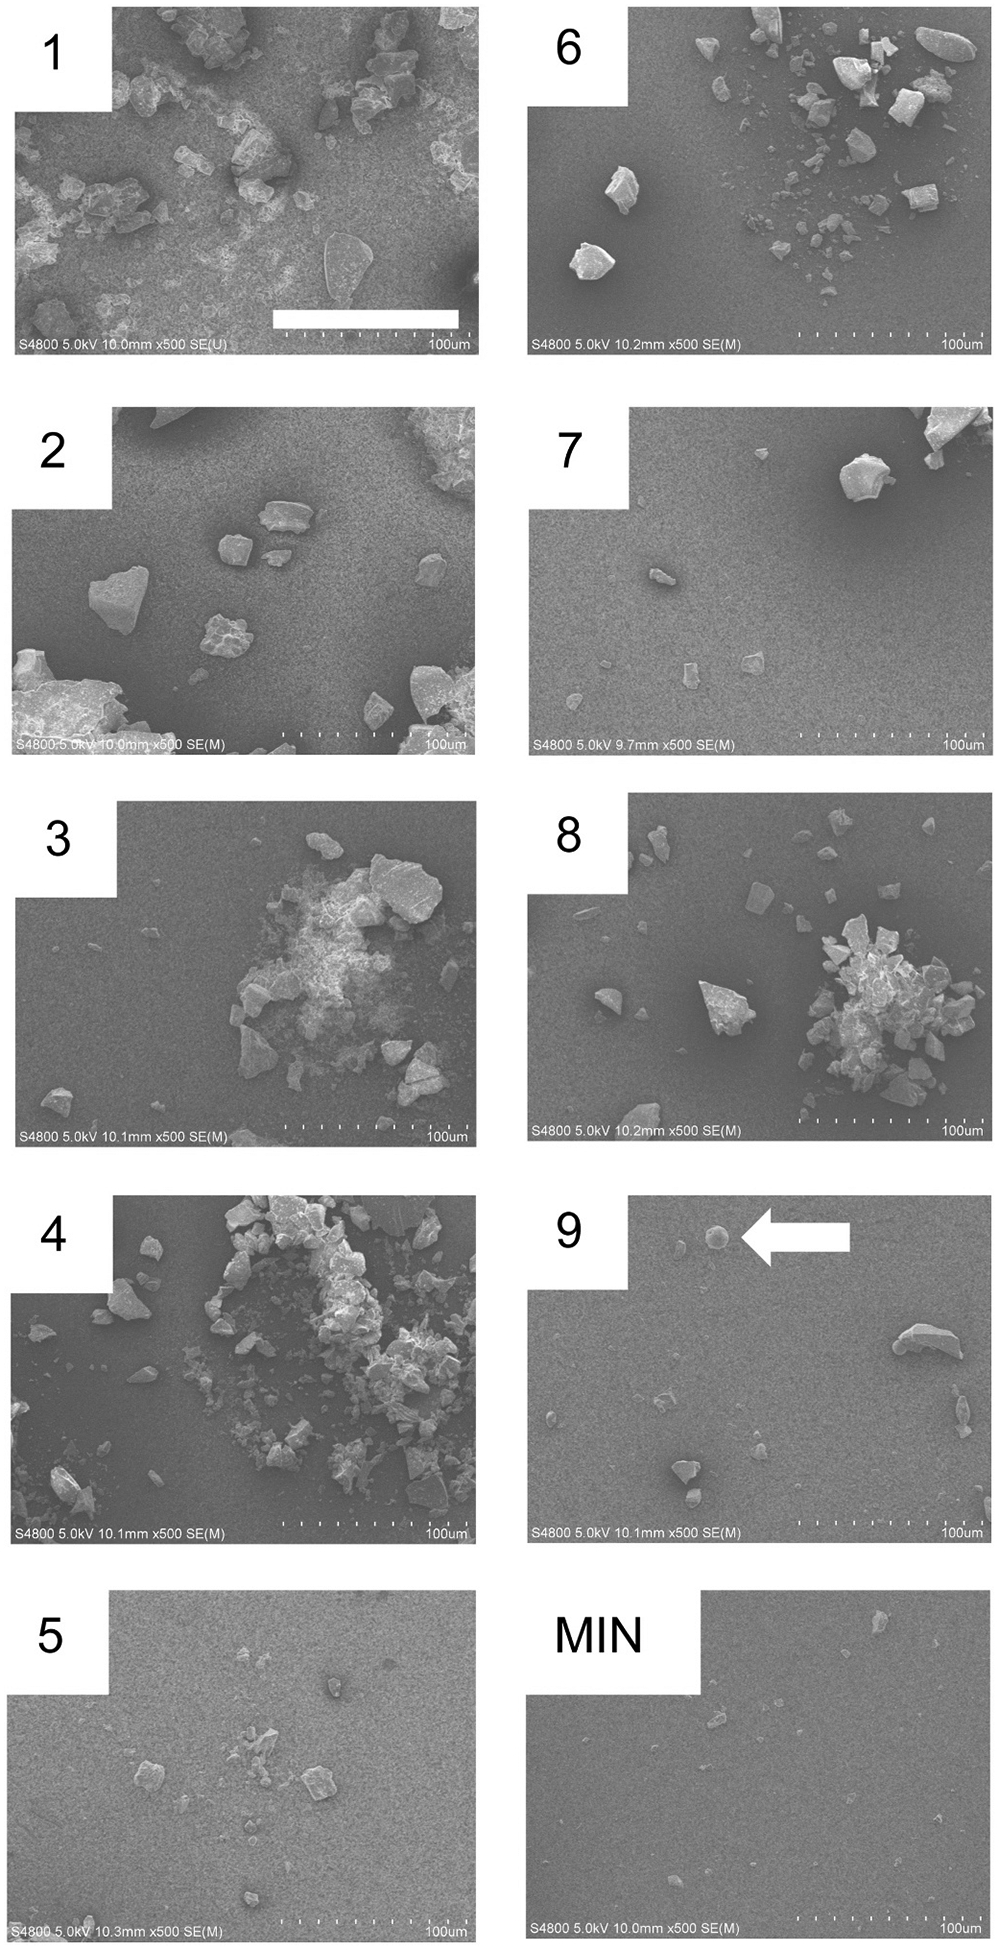
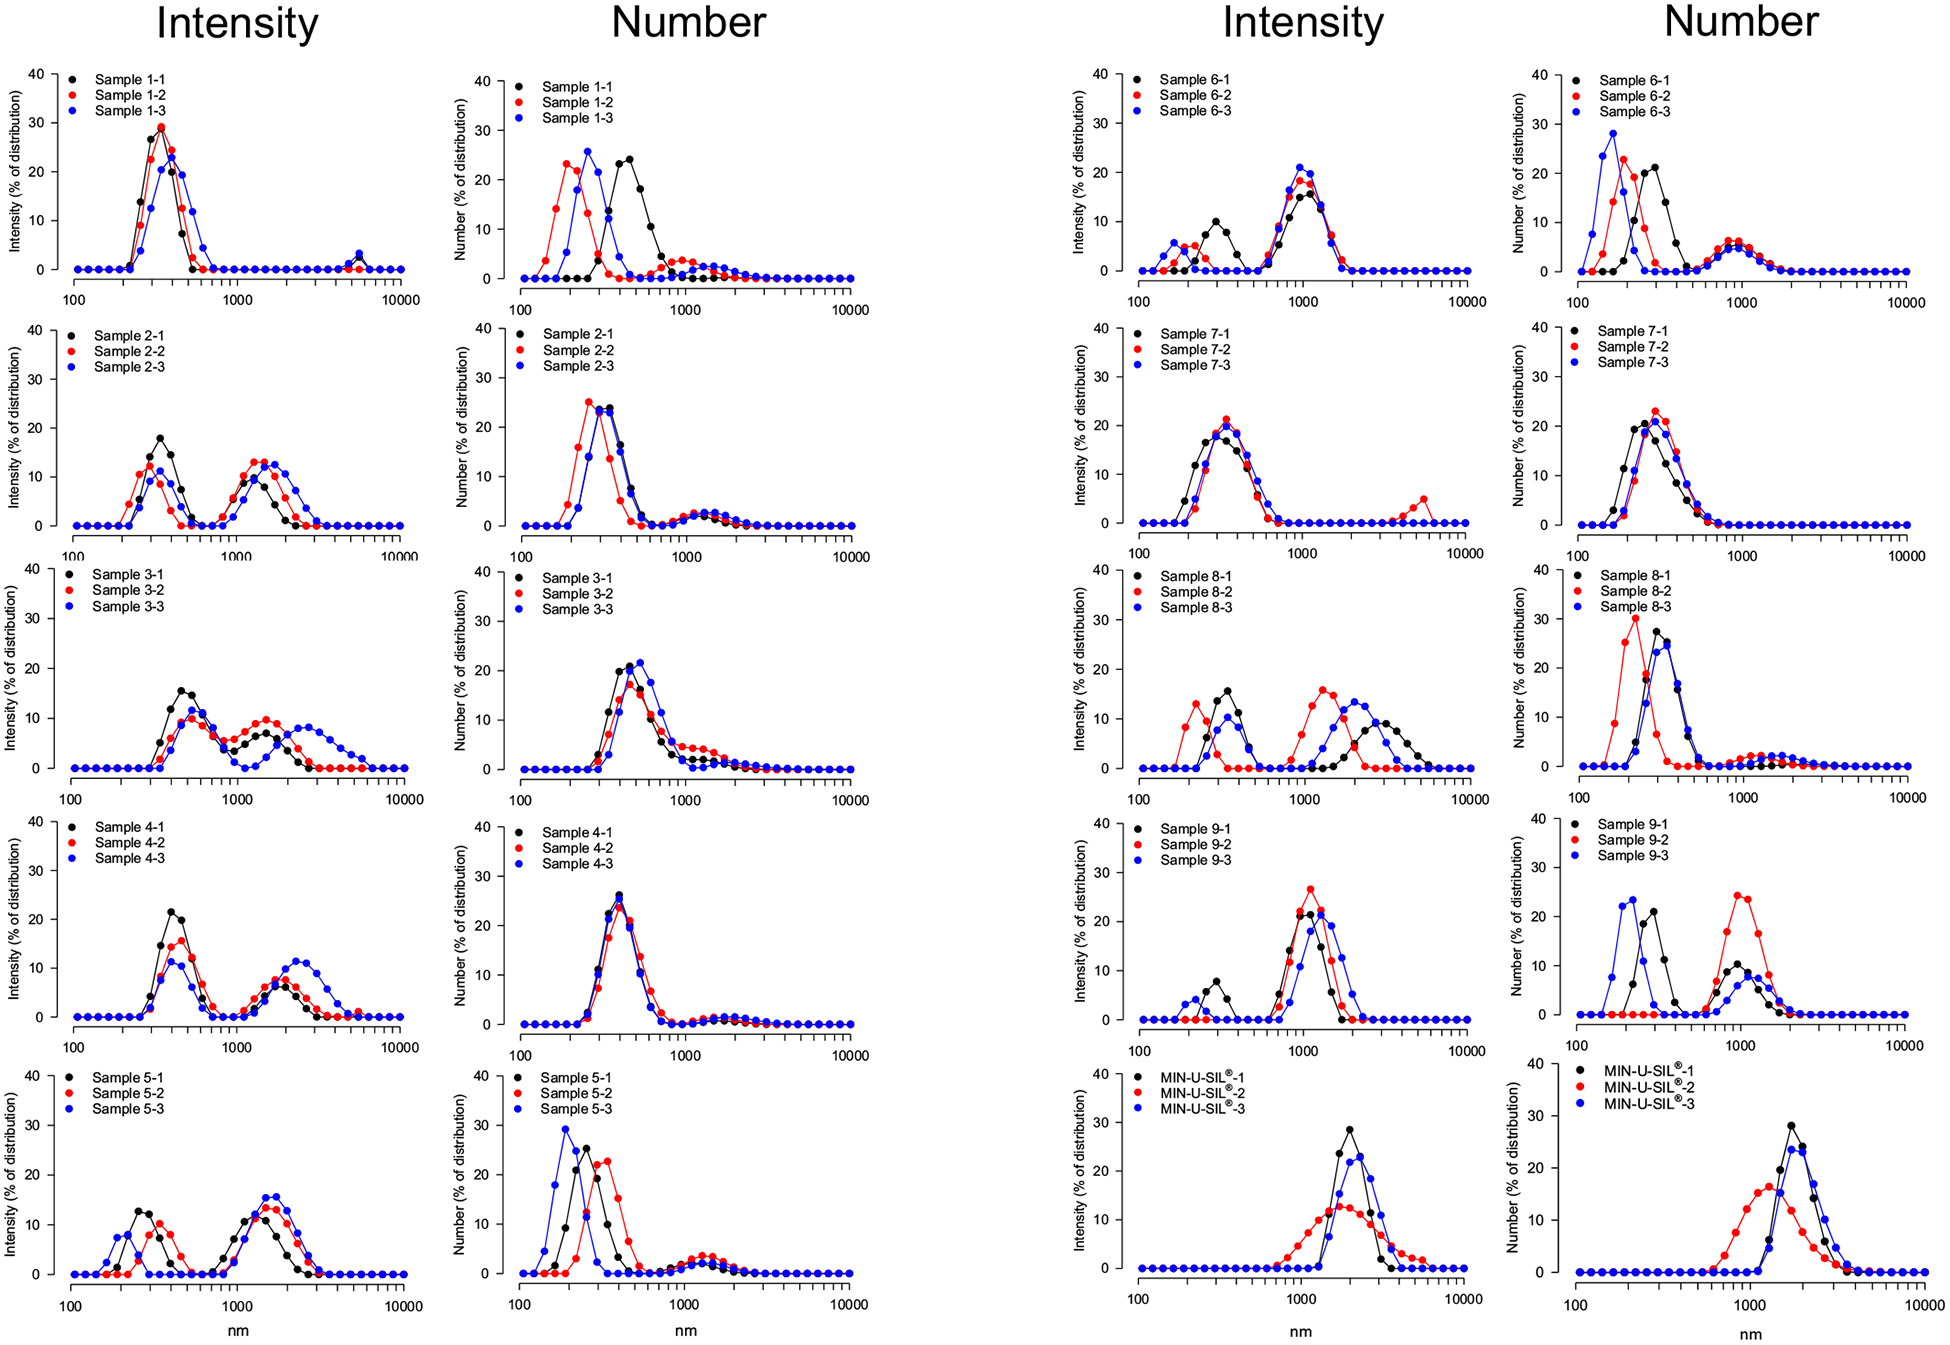
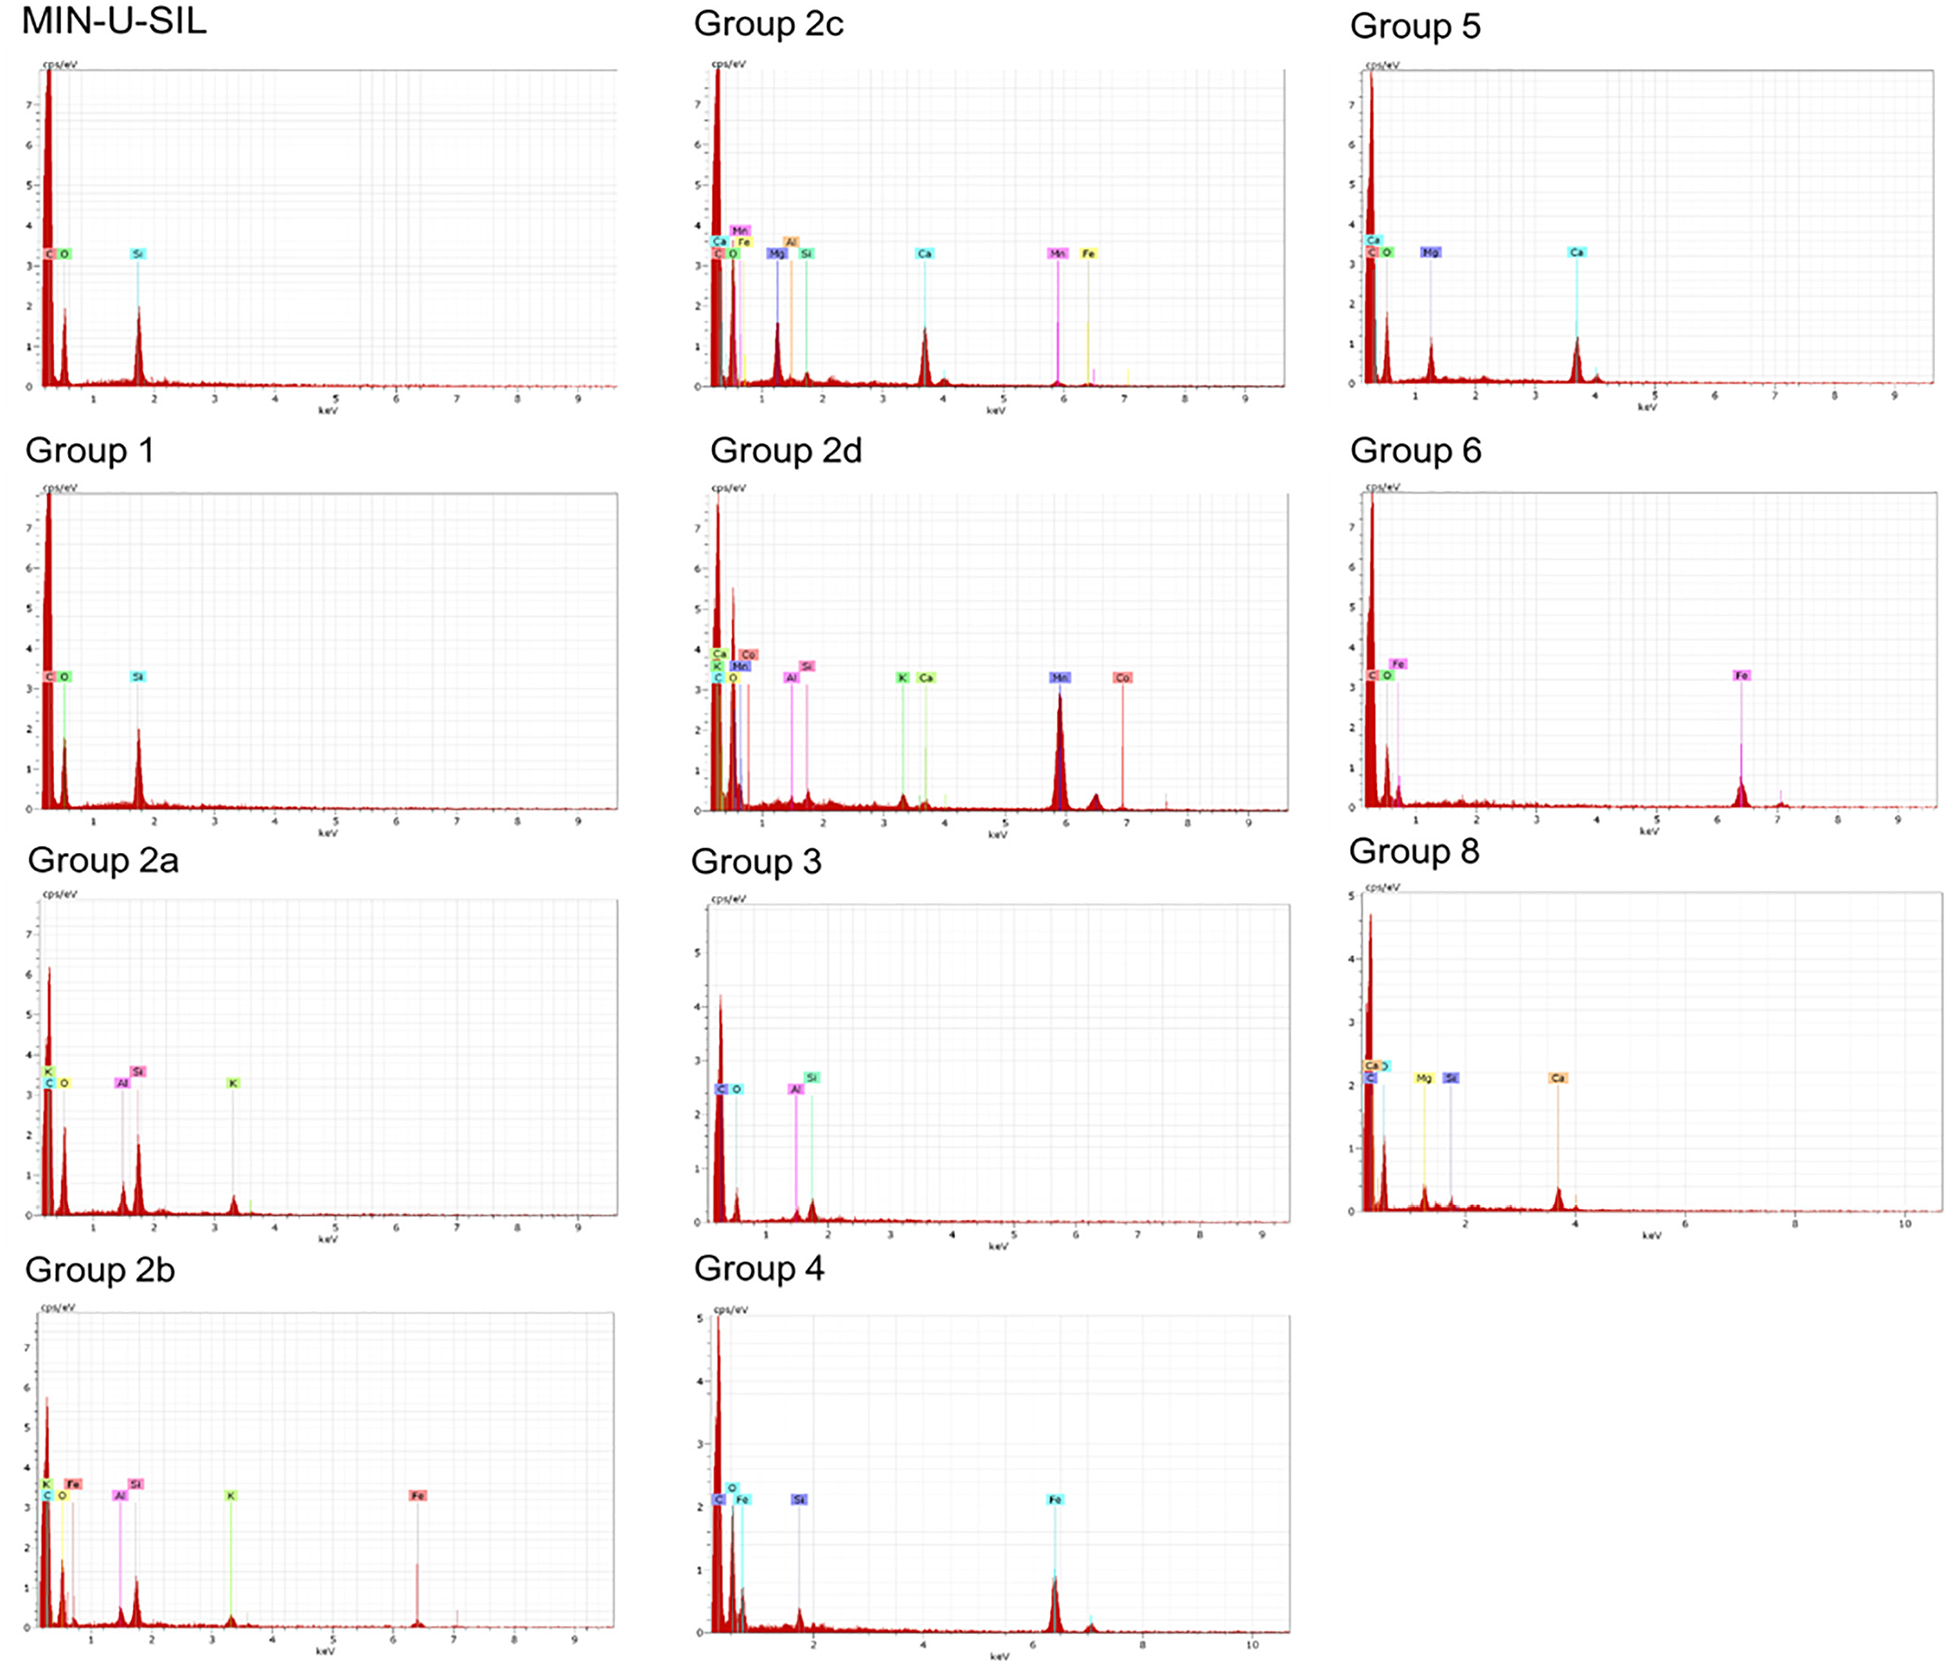
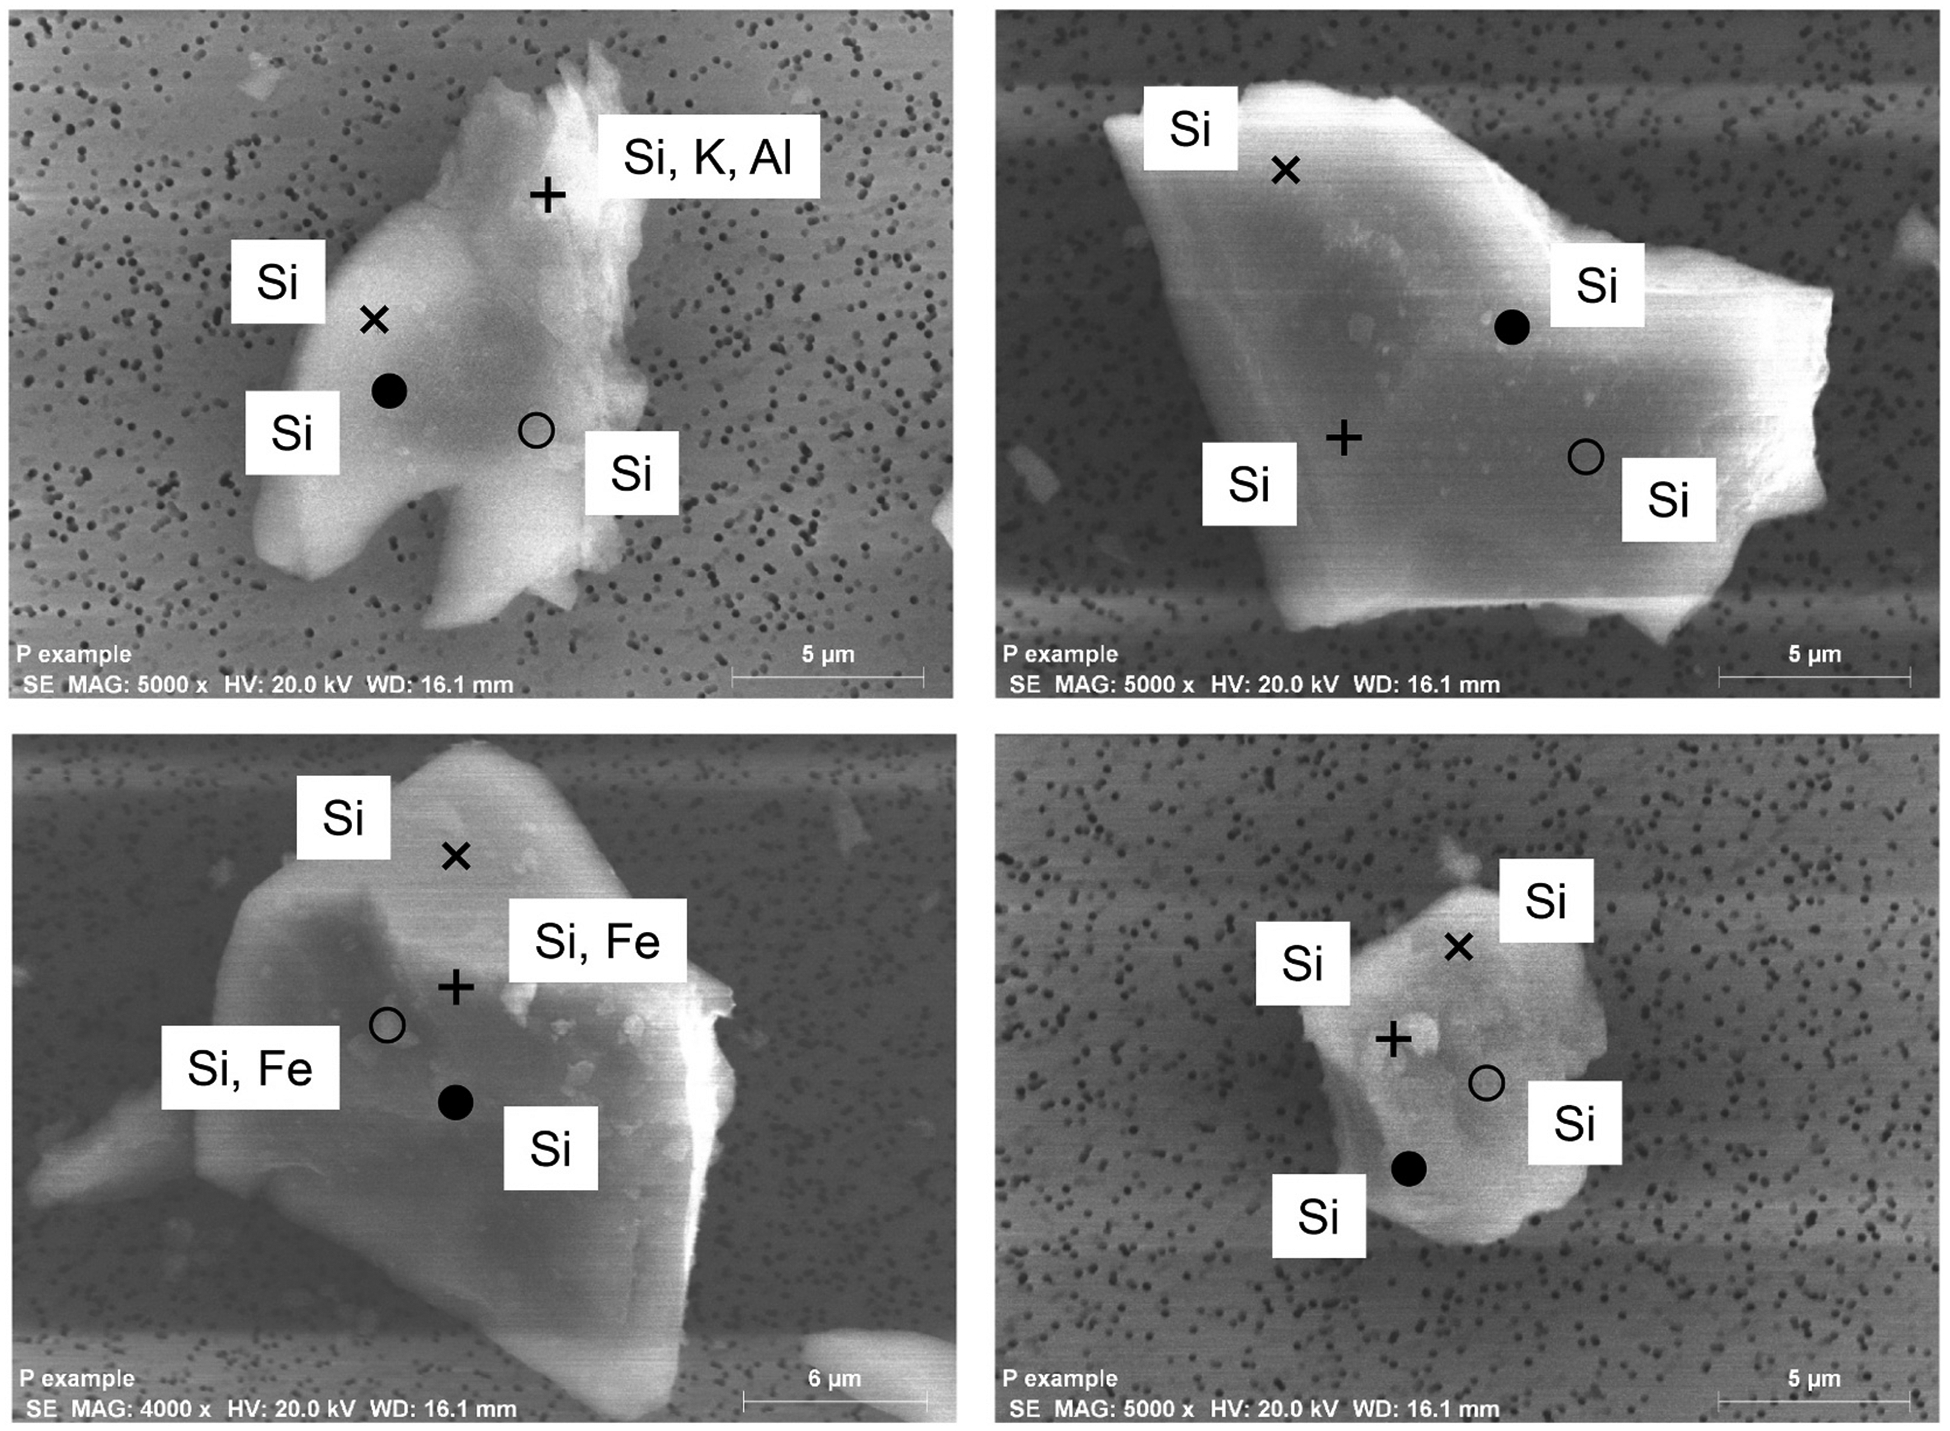
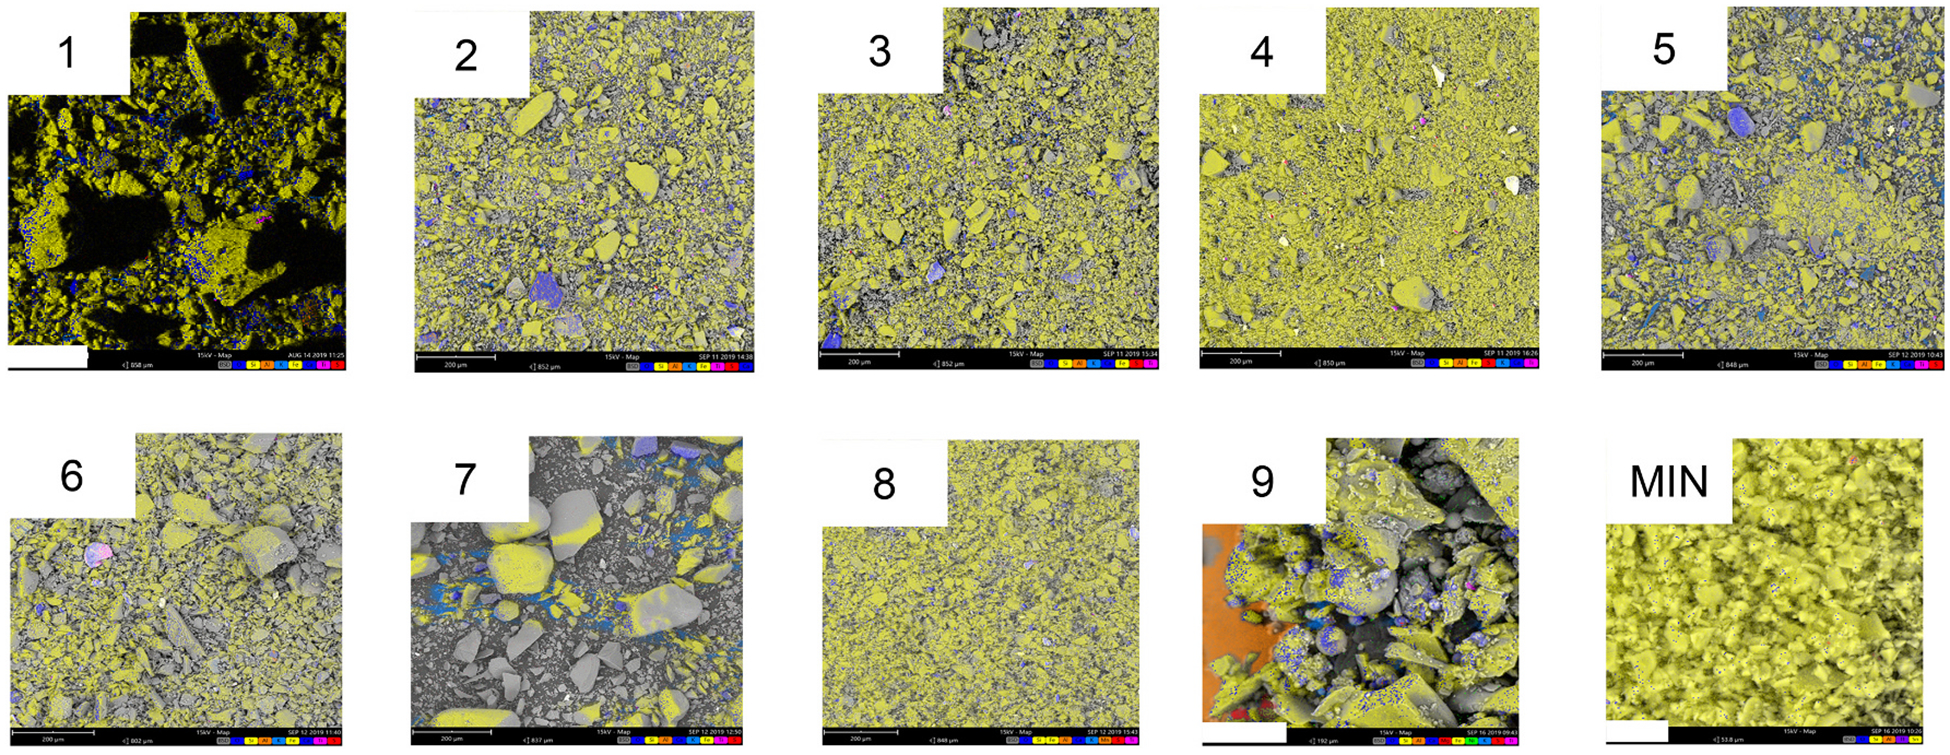
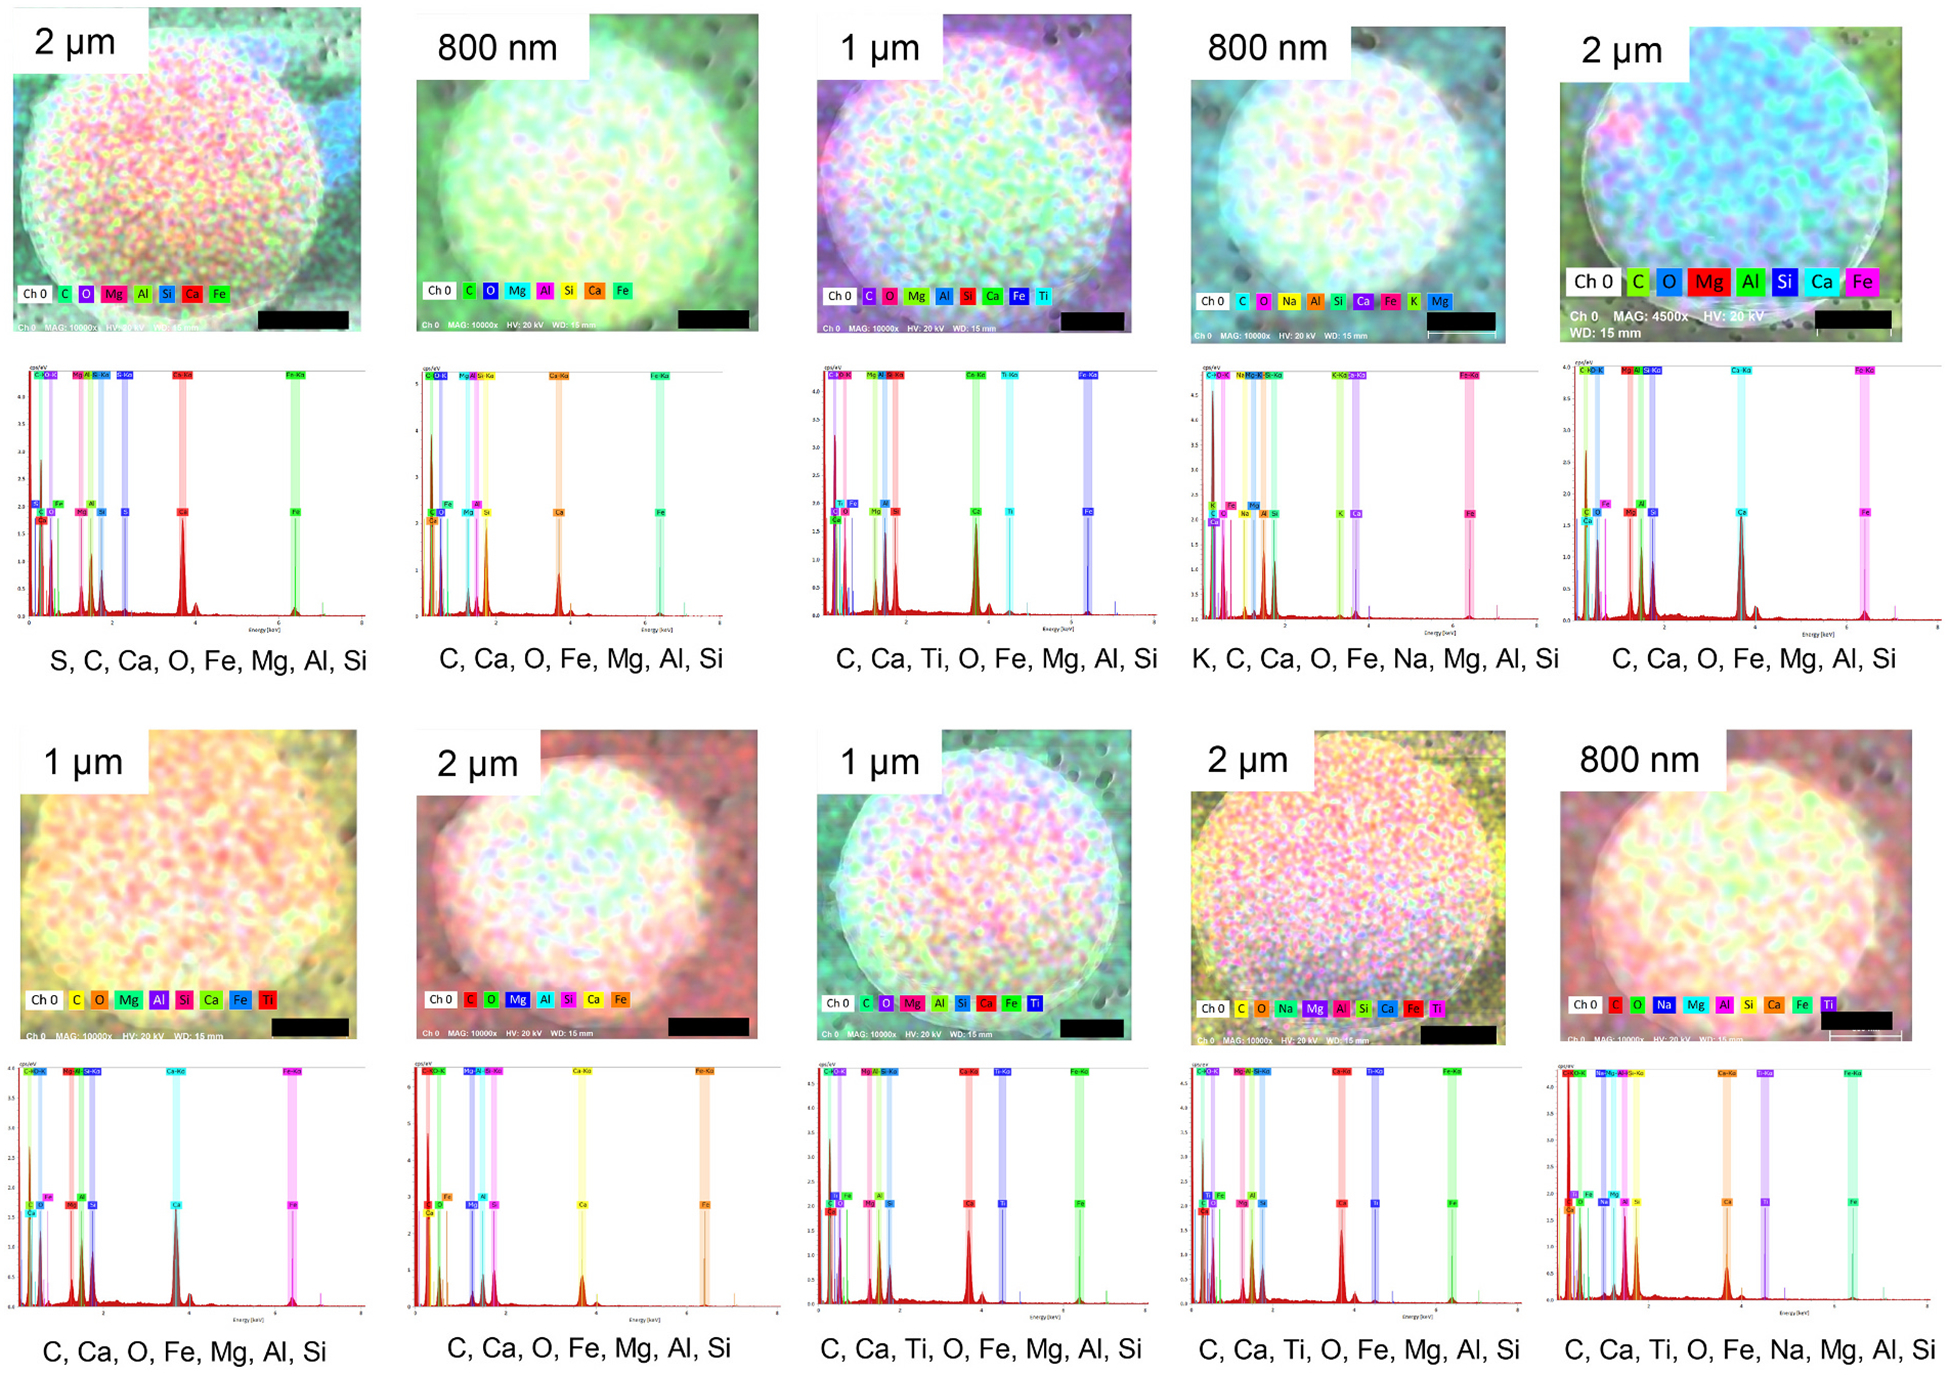
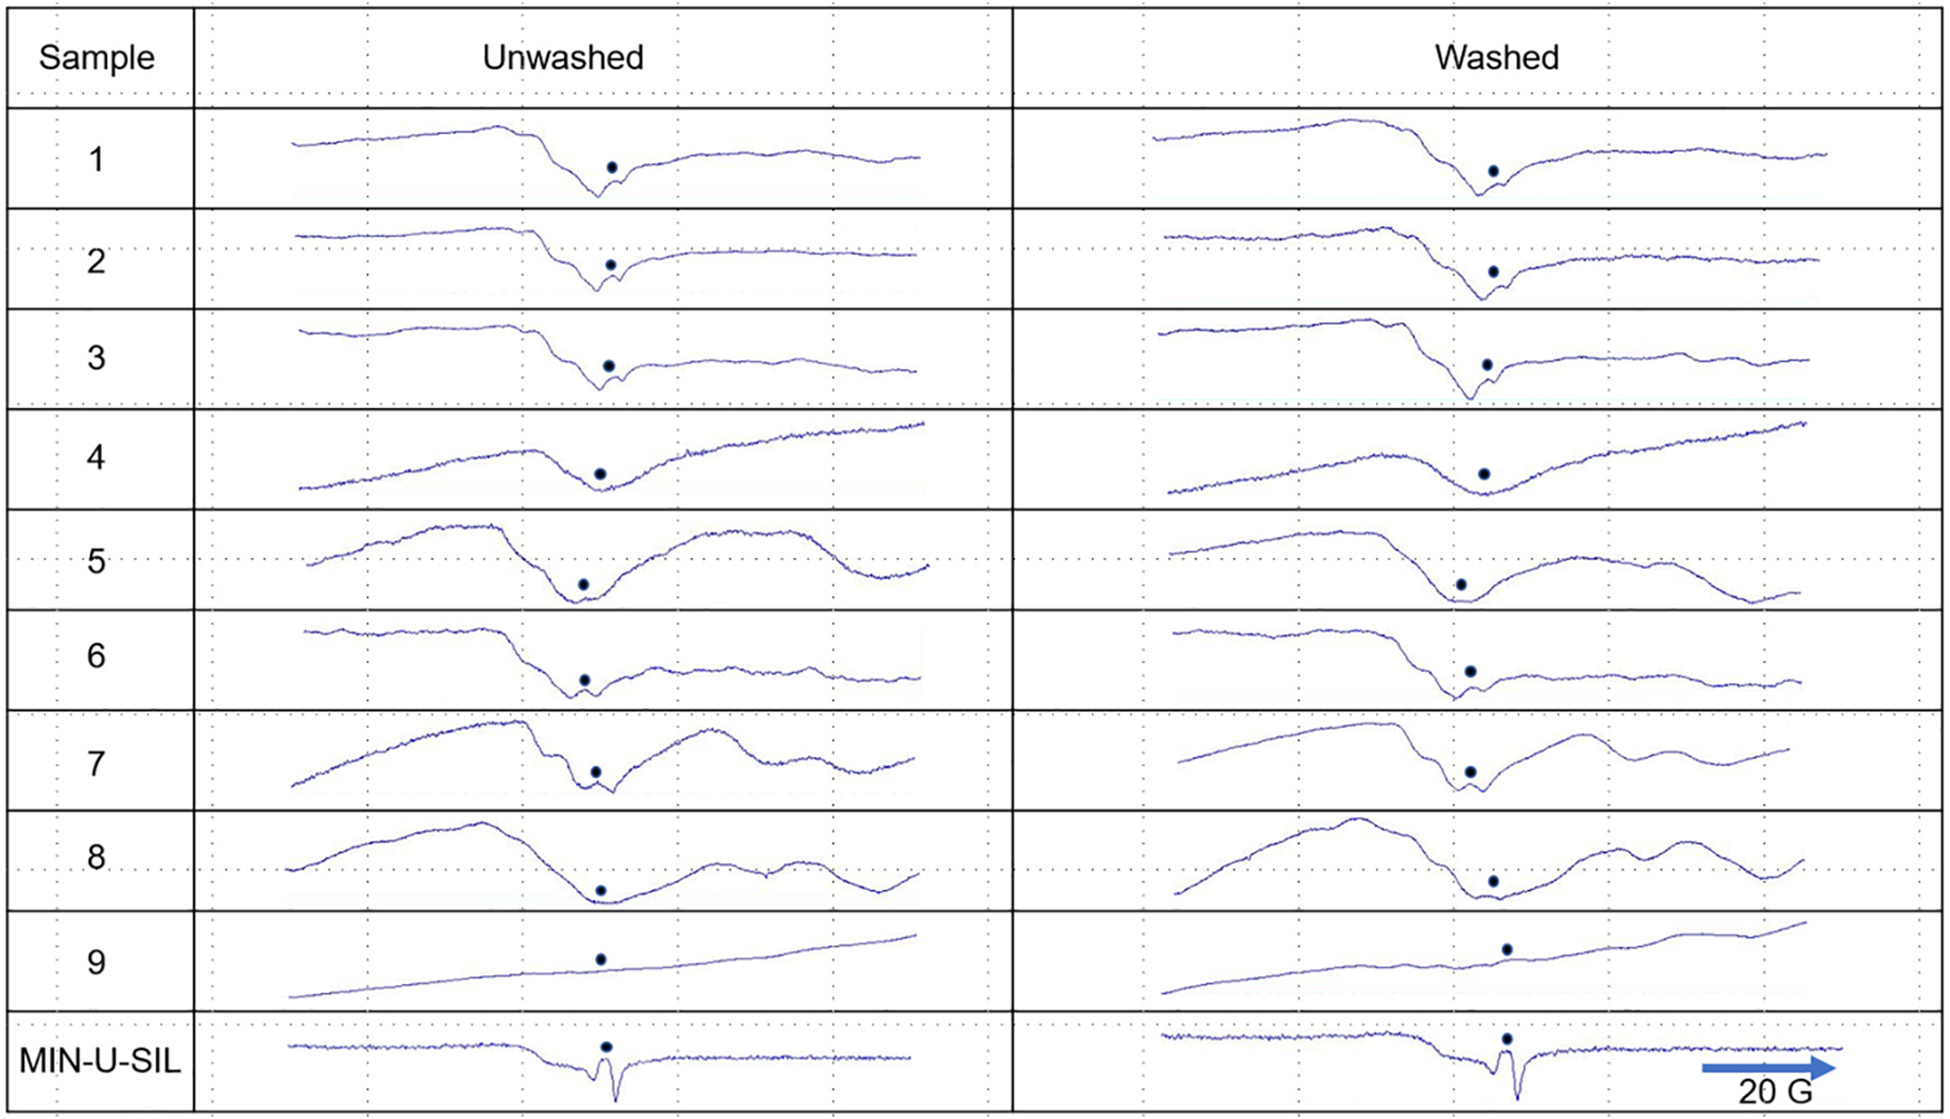
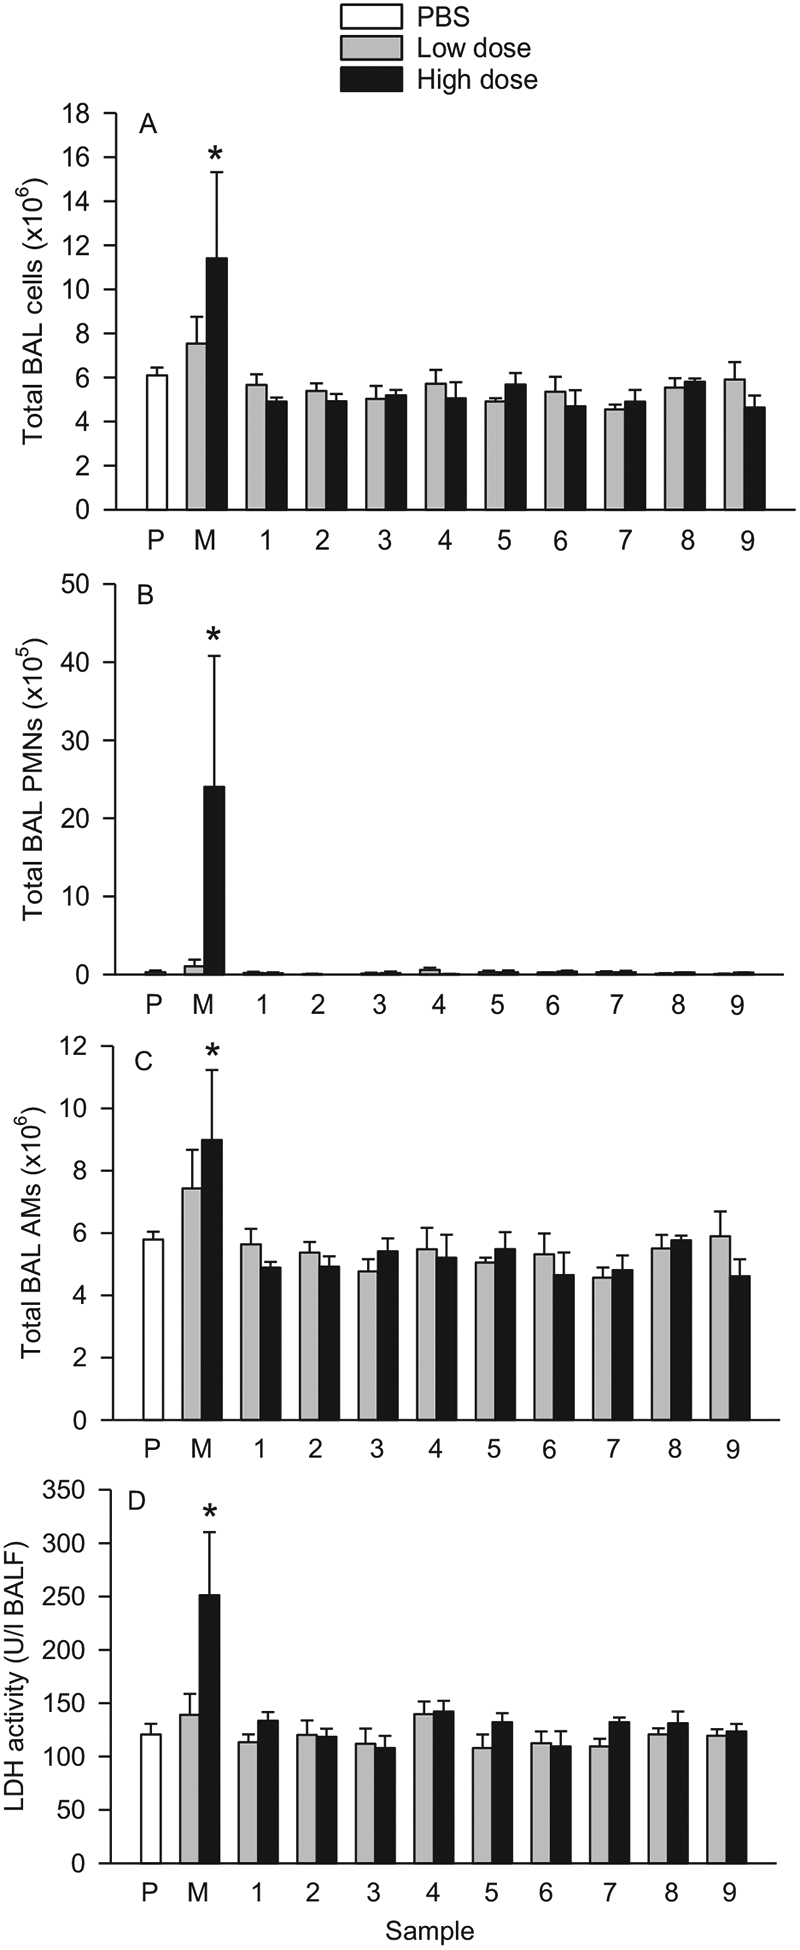
Hydraulic fracturing ("fracking") is used in unconventional gas drilling to allow for the free flow of natural gas from rock. Sand in fracking fluid is pumped into the well bore under high pressure to enter and stabilize fissures in the rock. In the process of manipulating the sand on site, respirable dust (fracking sand dust, FSD) is generated. Inhalation of FSD is a potential hazard to workers inasmuch as respirable crystalline silica causes silicosis, and levels of FSD at drilling work sites have exceeded occupational exposure limits set by OSHA. In the absence of any information about its potential toxicity, a comprehensive rat animal model was designed to investigate the bioactivities of several FSDs in comparison to MIN-U-SIL® 5, a respirable α-quartz reference dust used in previous animal models of silicosis, in several organ systems (Fedan, J.S., Toxicol Appl Pharmacol. 00, 000-000, 2020). The present report, part of the larger investigation, describes: 1) a comparison of the physico-chemical properties of nine FSDs, collected at drilling sites, and MIN-U-SIL® 5, a reference silica dust, and 2) a comparison of the pulmonary inflammatory responses to intratracheal instillation of the nine FSDs and MIN-U-SIL® 5. Our findings indicate that, in many respects, the physico-chemical characteristics, and the biological effects of the FSDs and MIN-U-SIL® 5 after intratracheal instillation, have distinct differences.

Keywords: Fracking sand dust; MIN-U-SIL®; Particle characterization; Rat model; Silica.


Conflict of interest statement

Declaration of Competing Interest

The authors declare that they have no conflicts of interest in relation to this publication.

Figures

Fig. 1.
Fig. 1.
Photograph of the nine FSDs studied in this investigation. These FSDs were collected at sites (see 2.1.) where hydraulic fracturing was used. The FSDs exhibited a range of colors. MIN-U-SIL (number 10) is included for comparison.
Fig. 2.
Fig. 2.
High magnification SEM images of the nine FSDs studied in this investigation. MIN-U-SIL (MIN) is shown for comparison. Bar = 100 μm. Note the spherical structures in FSD 9 (arrow). Refer to Fig. S1 for a lower power rendering of the FSDs. High magnification SEM images of the nine FSDs studied in this investigation. MIN-U-SIL (MIN) is shown for comparison. Bar = 100 μm. Note the spherical structures in FSD 9 (arrow). Refer to Fig. S1 for a lower power rendering of the FSDs.
Fig. 3.
Fig. 3.
DLS intensity and particle size distributions of nine FSDs and MIN-U-SIL. The black, red and blue colors refer to three separate measurements on a given sample.
Fig. 4.
Fig. 4.
EDS spectrum analysis of MIN-U-SIL and FSD 8. Eight distinct groups of particles based on surface element content were detected. These spectra are representative of ones detected in a survey of 200 FSD 8 particles. For each particle, a spectrum was obtained from one discrete spot on the particle surface. Abscissa: keV; ordinate: cps/eV. The individual spectra are also presented as Supplementary Figs. S2–S12 for greater clarity, along with SEM images identifying beam location. EDS spectrum analysis of MIN-U-SIL and FSD 8. Eight distinct groups of particles based on surface element content were detected. These spectra are representative of ones detected in a survey of 200 FSD 8 particles. For each particle, a spectrum was obtained from one discrete spot on the particle surface. Abscissa: keV; ordinate: cps/eV. The individual spectra are also presented as Supplementary Figs. S2–S12 for greater clarity, along with SEM images identifying beam location.
Fig. 5.
Fig. 5.
EDS analysis of the surface of randomly selected FSD particles, indicating heterogeneity of surface elemental composition on single particles (upper and lower left) or absence of elements other than Si in areas scanned in other particles (upper and lower right). The symbols indicate the several locations of the electron beam at on the particles, and the elements identified at each location are shown.
Fig. 6.
Fig. 6.
Composite EDS images of nine neat FSDs and MIN-U-SIL. These images depict the composite pseudo-colors of the samples. With amplification of the images different colors appear more clearly, reflecting the location of elements at different locations on the particles. For FSD 9 the orange area reflects the Al present in the mounting stub on which the particles were placed for analysis. The spectra for the individual elements comprising the composite in these samples may be viewed in Fig. S13. Composite EDS images of nine neat FSDs and MIN-U-SIL. These images depict the composite pseudo-colors of the samples. With amplification of the images different colors appear more clearly, reflecting the location of elements at different locations on the particles. For FSD 9 the orange area reflects the Al present in the mounting stub on which the particles were placed for analysis. The spectra for the individual elements comprising the composite in these samples may be viewed in Fig. S13.
Fig. 7.
Fig. 7.
Composite EDS images of spherical structures found in FSD 9. Spheres of different sizes were observed in the neat sample. The EDS spectrum of each sample is shown below its composite image. These images depict the composite pseudo-colors of the samples. In this figure the composite pseudo-color reflects the predominance of the elements; the instrument assigns color with regard to predominance as opposed to assigning a given color with a given element, as was done in Fig. 6. With augmentation of the images different colors appear more clearly, reflecting the location of elements at different locations. The rank order of element prevalence is shown by the order of the elements below each panel, from left to right. The dimensions of the black bars are given by the insets in the upper left-hand corner of each panel.
Fig. 8.
Fig. 8.
EPR spectra of nine neat FSDs before (left column) and after (right column) washing in dH2O. The dots indicate the location of the visible or masked Si radical signal in the spectra. Only in the case of FSD 8 did washing partially revert the Si signal to that of MIN-U-SIL. See also Castranova et al. (1996) for EPR spectra of MIN-U-SIL.
Fig. 9.
Fig. 9.
Effects of nine neat FSDs and MIN-U-SIL (M) on BAL inflammatory cellular and LDH responses following i.t. instillation of the dusts in rats. A, Total BAL cells; B, total BAL PMNs; C, total BAL AMs; and D, LDH activity. The dusts were administered in a low dose (159 μg/rat) or a high dose (500 μg/rat). Cell and LDH activity measurements were obtained from BAL 30 d post-instillation exposure. *Significantly different from PBS (P). n = 4.
Fig. 10.
Fig. 10.
A focus of histiocytic and neutrophilic alveolitis in a rat exposed to 500 μg MIN-U-SIL by i.t. instillation 30 d earlier. Bar = 100 μm.
Fig. 11.
Fig. 11.
Foci of histiocytic and neutrophilic alveolitis characterized the response to the 500 μg MIN-U-SIL dose but was rarely observed in FSD-exposed rats. Alveolar macrophages containing FSD particles were occasionally observed in the 500 μg FSD-exposed rats. A, Alveolar region of a vehicle control (PBS). The alveolar macrophage (dashed arrow) is a normal feature. B, Histiocytic and neutrophilic alveolitis 30 d after a 500 μg MIN-U-SIL exposure is characterized by increased number and size of alveolar macrophages (dashed arrows) accompanied by neutrophils (open arrows). Alveolar epithelial cells are increased in number and size, reflecting hyperplasia and hypertrophy (solid arrows). C, Lung of a rat 30 d after receiving a 500 μg FSD 8. An occasional macrophage (dashed arrows) is in the alveolar region. D, Polarized image from the same field shown in C, demonstrating a birefringent particle. E, Lung of a rat 30 d after receiving a 500 μg FSD 5. Low numbers of alveolar macrophages (dashed arrows) are seen in the alveolar region. F, Polarized image from the same field shown in E, demonstrating a birefringent particle in one of the alveolar macrophages. H and E stain; bar = 20 μm.
Fig. 12.
Fig. 12.
Trichrome-stained sections of lung. A, PBS negative control. B, MIN-U-SIL positive control. Fibrous connective tissue stains blue. In the MIN-U-SIL-exposed lung, alveolar septa were mildly thickened by blue-staining fibrous connective tissue, indicating mild alveolar septal fibrosis.

References

    1. Anderson SE, Shane H, Long C, Marrocco A, Lukomska E, Roberts JR, Marshall N, Fedan JS, 2020. Biological effects of inhaled hydraulic fracturing sand dust. VIII. Immunotoxicity. Toxicol. Appl. Pharmacol 408, 115256 10.1016/j.taap.2020.115256. - DOI - PMC - PubMed
    1. Battelli LA, Ghanem MM, Kashon ML, Barger M, Ma JY, Simoskevitz RL, Miles PR, Hubbs AF, 2008. Crystalline silica is a negative modifier of pulmonary cytochrome P-4501A1 induction. J. Toxicol. Environ. Health A 71, 521–532. - PubMed
    1. Begin R, Masse S, Rola-Pleszczynski M, Martel M, Desmarais Y, Geoffroy M, LeBouffant L, Daniel H, Martin J, 1986. Aluminum lactate treatment alters the lung biological activity of quartz. Exp. Lung Res 10, 385–399. - PubMed
    1. Begin R, Masse S, Sebastien P, Martel M, Bosse J, Dubois F, Geoffroy M, Labbe J, 1987. Sustained efficacy of aluminum to reduce quartz toxicity in the lung. Exp. Lung Res 13, 205–222. - PubMed
    1. Borm P, Cassee FR, Oberdörster G, 2015. Lung particle overload: old school -new insights? Part. Fibre Toxicol 12, 10. - PMC - PubMed

Publication types