. 2020 Sep;9(9):890-902.
doi: 10.1530/EC-20-0288.

Sexual dimorphism in insulin resistance in a metabolic syndrome rat model

Affiliations

Sexual dimorphism in insulin resistance in a metabolic syndrome rat model

Myrian Velasco et al. Endocr Connect. 2020 Sep.

Abstract

Objective: We assessed the sex-specific differences in the molecular mechanisms of insulin resistance in muscle and adipose tissue, in a MS rat model induced by a high sucrose diet.

Methods: Male, female, and ovariectomized female Wistar rats were randomly distributed in control and high-sucrose diet (HSD) groups, supplemented for 24 weeks with 20% sucrose in the drinking water. At the end, we assessed parameters related to MS, analyzing the effects of the HSD on critical nodes of the insulin signaling pathway in muscle and adipose tissue.

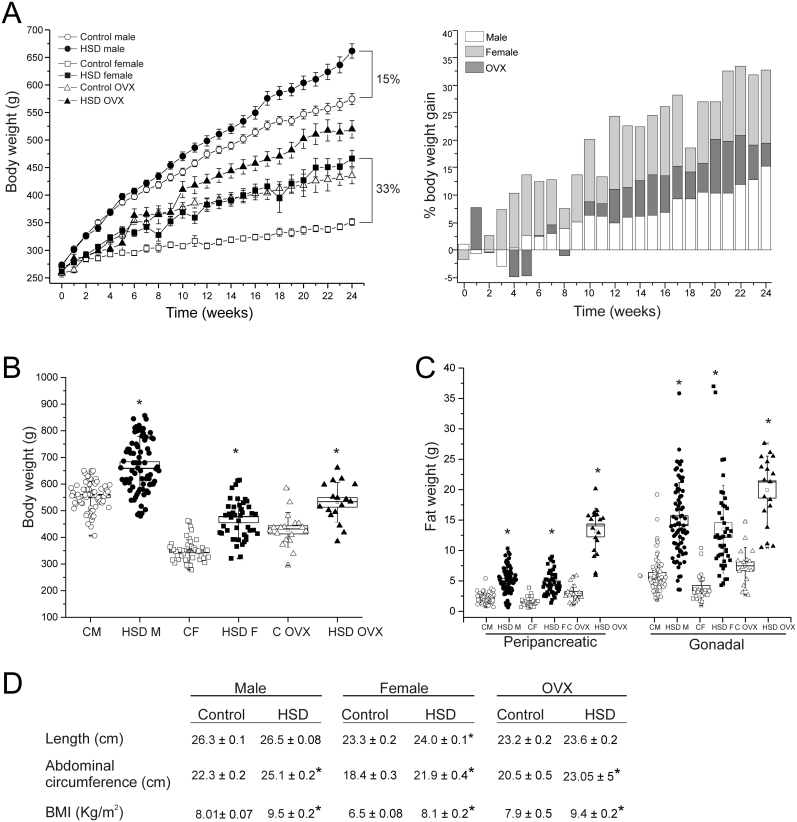
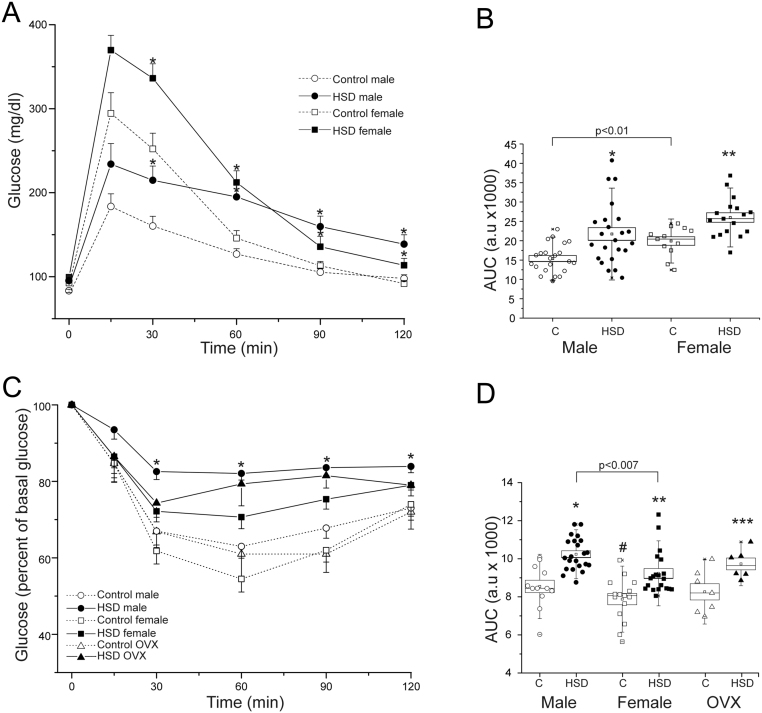
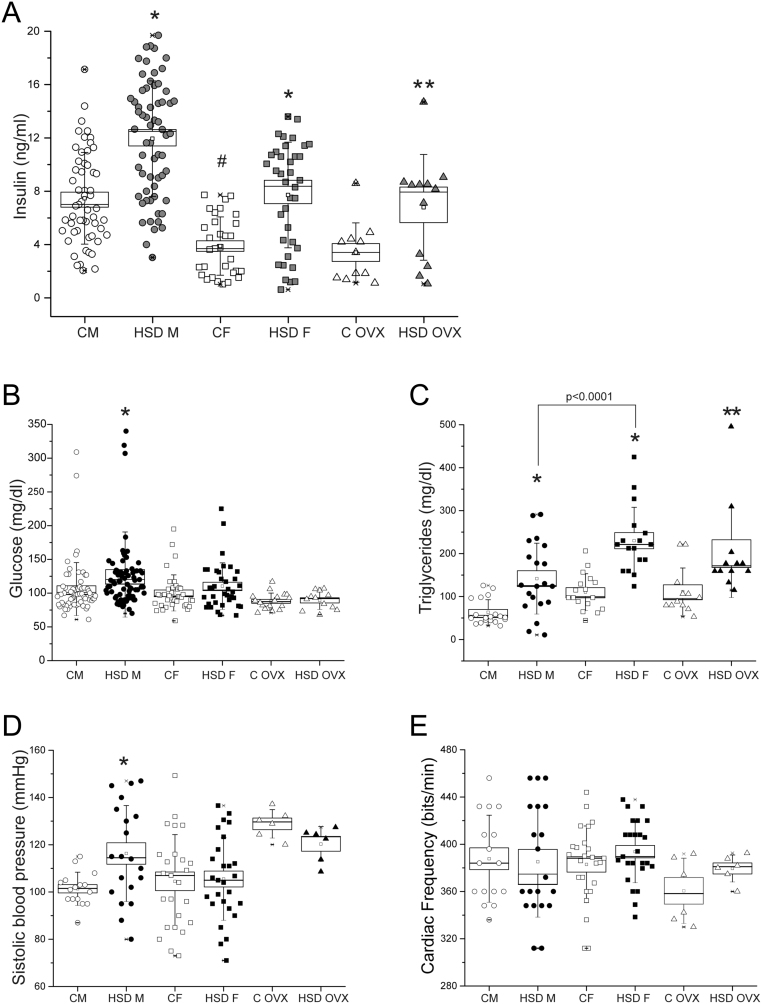
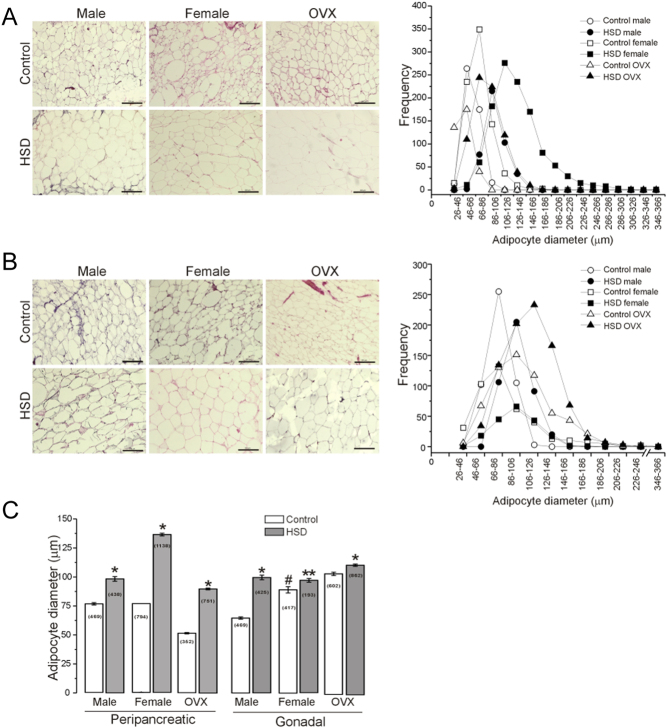
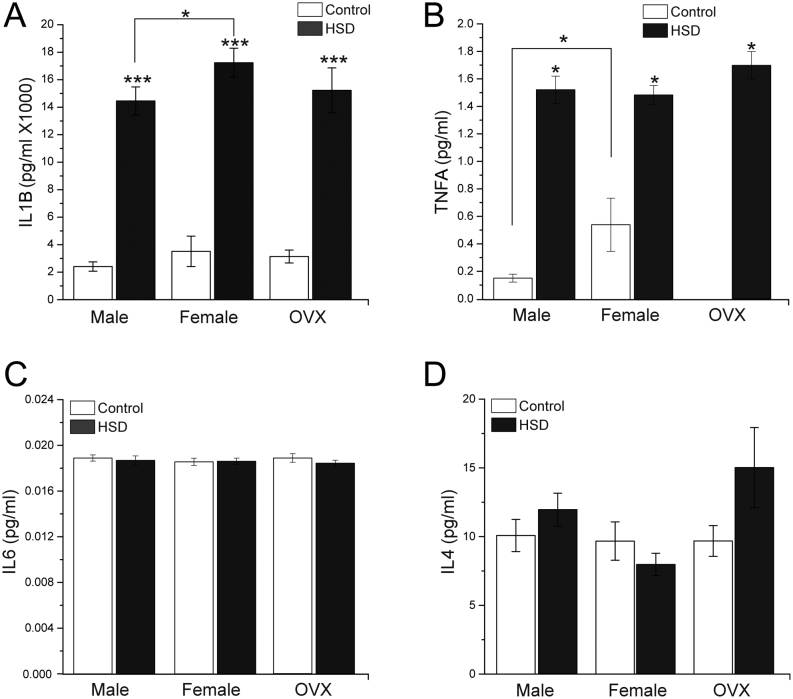
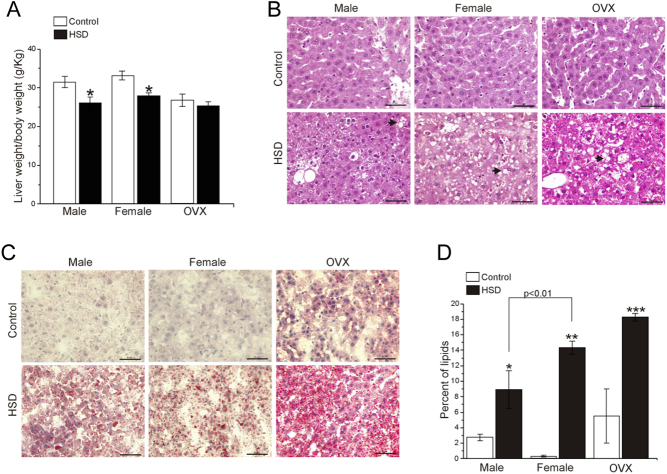
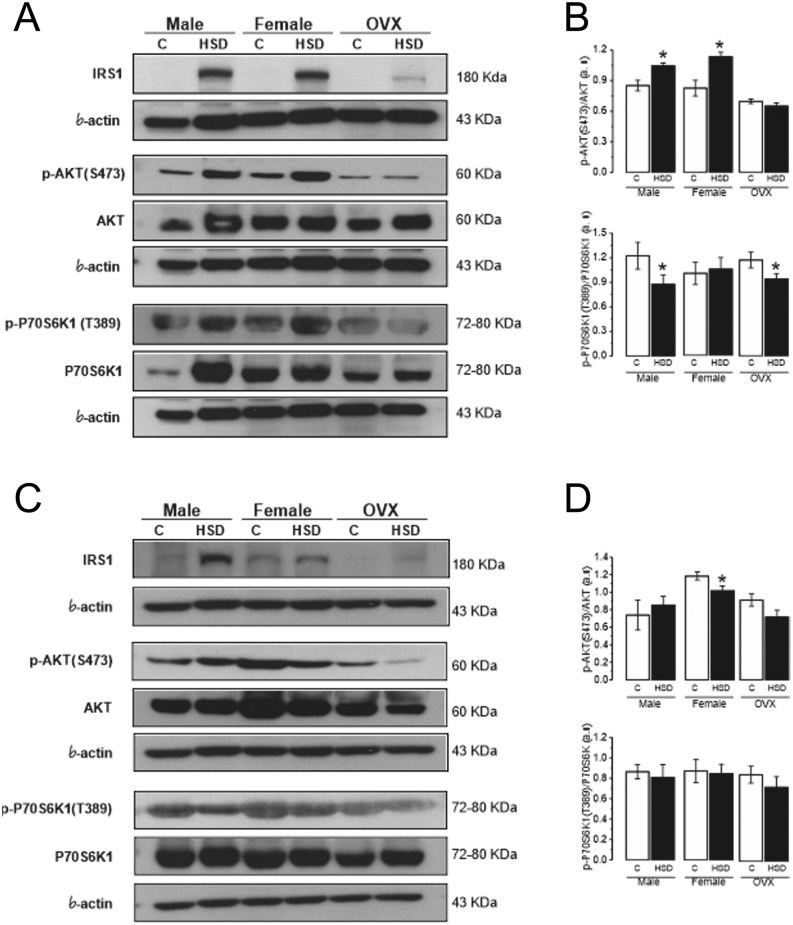
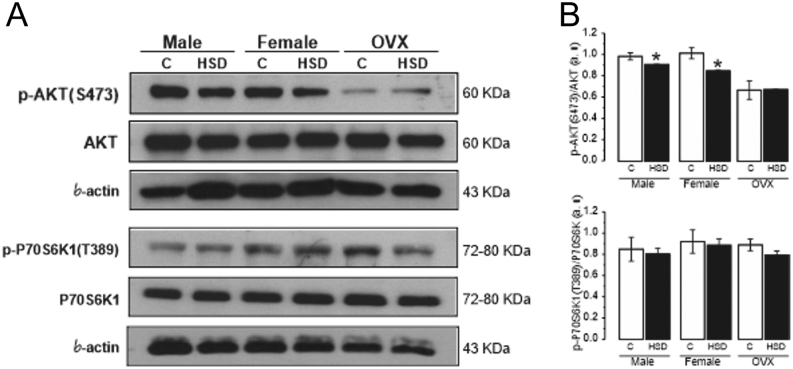
Results: At the end of the treatment, HSD groups of both sexes developed obesity, with a 15, 33 and 23% of body weight gain in male, female, and OVX groups respectively, compared with controls; mainly related to hypertrophy of peripancreatic and gonadal adipose tissue. They also developed hypertriglyceridemia, and liver steatosis, with the last being worse in the HSD females. Compared to the control groups, HSD rats had higher IL1B and TNFA levels and insulin resistance. HSD females were more intolerant to glucose than HSD males. Our observations suggest that insulin resistance mechanisms include an increase in phosphorylated AKT(S473) form in HSD male and female groups and a decrease in phosphorylated P70S6K1(T389) in the HSD male groups from peripancreatic adipose tissue. While in gonadal adipose tissue the phosphorylated form of AKT decreased in HSD females, but not in HSD males. Finally, HSD groups showed a reduction in p-AKT levels in gastrocnemius muscle.

Conclusion: A high-sucrose diet induces MS and insulin resistance with sex-associated differences and in a tissue-specific manner.

Keywords: insulin resistance; metabolic syndrome; obesity; sexual dimorphism.


Figures

Figure 1
Figure 1
High-sucrose diet produces obesity. (A) Body weight gain after 24 weeks of diet (left panel) and the percentage of BW gain compared to control (right panel) in control and HSD male (n = 65, for control and HSD groups), female (n = 24, for control and HSD groups) and ovariectomized rats (OVX; n = 12, for control and HSD groups). (B) Body weight at the end of HSD treatment mean ± s.e.m. Two-way ANOVA was performed (Sex, F(1,228) = 380.9, and diet, F(1,228) = 122.6, P = 0.0001 for both factors), with post hoc Tukey’s test, *P < 0.0001 compared to their control groups, #P < 0.0001 compared to control male group, boxes around the mean represent the s.e.m., and whiskers represent the s.d. (C) Peripancreatic and gonadal adipose tissue weight of males (n = 63 to control and n = 75 to HSD), females (n = 29 and 44 for control and HSD respectively) and OVXs (n = 18 for both conditions), boxes around the mean represent the s.e.m., and whiskers represent the s.d. Two-way ANOVA was performed (Sex, F(1,208) = 3.8 and F(1,207) = 5.5; P = 5.2 x 10⁻² and P = 0.019 for pWAT and gWAT respectively; Diet, F(1,208) = 158.9 and F(1,207) = 143.3; P = 0.0001 for pWAT and gWAT respectively), with post hoc Tukey’s test, *P < 0.0001 compared to their control group. (D) Somatometric parameters mean ± s.e.m. for length, abdominal circumference (AC) and BMI. Two-way ANOVA was performed (Sex, F(1,225) = 595.9, 207.5 and 106.7; P = 0.0001 for length, AC and BMI, respectively) with post hoc Tukey’s test. *P < 0.0001 compared to their control groups.
Figure 2
Figure 2
Sex differences in insulin resistance. (A) IP glucose tolerance test (2 g/kg body weight) were performed in male (n = 22 and 23 to control and HSD group respectively), female (n = 22 for both conditions) control and HSD rats. Data expressed as mean ± s.e.m. Two-way ANOVA was performed (Sex, F(1,70) = 10.4, P = 0.0018 and diet F(1,70) = 20.8, P = 2.04 x 10⁻⁵), with post hoc Tukey’s test *P < 0.001, **P < 0.02 compared to their controls. (B) The areas under the curves (AUC) *P < 0.001, **P < 0.02 compared to their control group, boxes around the mean represent the s.e.m., and whiskers represent the SD. (C) Insulin (0.2 IU/Kg body weight) was administered IP to males (n = 12 and 22 to control and HSD group respectively), females (n = 17 to control group and n = 20 to HSD group) and OVXs (n = 7 to both conditions). Data expressed as mean ± s.e.m., *P < 0.01 compared to their controls. (D) AUC boxes around the mean represent the s.e.m., and whiskers represent the s.d. Two-way ANOVA was performed (Sex, F(1,32) = 25.4, P = 1.77 x 10⁻⁵ and diet F(1,32) = 18.4, P = 1.53 x 10⁻⁴), with post hoc Tukey’s test. *P < 0.05; **P < 0.01; ***P < 0.02.
Figure 3
Figure 3
High-sucrose diet affects the metabolic status. (A) Plasma insulin levels from male (n = 60), female (n = 34) and OVX (n = 12) group of both conditions. Two-way ANOVA was performed (Sex, F(1,183) = 47.5, P = 8.57 x 10⁻¹¹ and diet F(1,183) = 53.7, P = 7.11 x 10⁻¹²), with post hoc Tukey’s test *P < 0.0001, **P < 0.02 compared to their control group, #P < 0.0001 compared to control males, boxes around the mean represent s.e.m. and whiskers represent the s.d. (B) Plasma glucose levels from male (n= 70), female (n = 36) and OVX groups (n= 12). Boxes around the mean represent the s.e.m., and whiskers represent the s.d. Two-way ANOVA was performed (Sex, F(1,208) = 2.865, P = 0.09 and diet F(1,208) = 5.517, P = 0.02), with post hoc Tukey’s test *P < 0.02. (C) Plasma triglycerides levels from males (n = 20), females (n = 17) and OVX rats (n = 12) of both conditions. Boxes around the mean represent the s.e.m., and whiskers represent the s.d. Two-way ANOVA was performed (Sex, F(1,69) = 21.255, P = 1.79 x 10⁻⁵ and diet F(1,69) = 45.449 P = 3.89 x 10⁻⁹), with post hoc Tukey’s test *P < 0.001, **P < 0.01 compared to control groups, #P < 0.01 compared to control male. systolic blood pressure (D) and cardiac frequency (E) from males (n = 20), females (n = 25) and ovx rats (n = 6) for both conditions. boxes around the mean represent the s.e.m., and whiskers represent the s.d. one-way anova was performed with post hoc Tukey’s test *P < 0.008 compared to control groups.
Figure 4
Figure 4
High-sucrose diet produces hypertrophy of the peripancreatic and gonadal adipocytes. Representative picture of H&E stained sections (n = 6 animals per group and 10 optic fields per animal) from peripancreatic (A), and gonadal adipose tissue (B), the insert represent the frequency histogram of adipocyte diameters (classified in 17 classes from 26–46 µm to 346–366 µm). (C) The bars represent the mean ± s.e.m. of adipocytes diameter for both adipose tissue depots from male, female and OVX rats of both conditions (n is indicated in the bars). Two-way ANOVA was performed (Sex, F(1,2835) = 409.3 and F(1,1500) = 10.3; P = 0 and P = 0.0013 for pWAT and gWAT respectively; Diet, F(1,2835)= 1714.6 and F(1,1500) = 69.0; P = 0 and P = 2.2 x 10⁻¹⁶ for pWAT and gWAT respectively), with post hoc Tukey’s test; with interaction between sex and diet. *P < 0.0001, **P < 0.03 compared to the control group, #P < 0.0001 compared to the control male group. 10x objective, scale bar = 200 µm.
Figure 5
Figure 5
Cytokines profile. (A) Plasma IL1B levels of male, female and OVX control and HSD groups (two-way ANOVA was performed (Sex, F(1,271) = 9.167, P = 0.0027 and diet F(1,271) = 165.325, P = 0), with post hoc Tukey’s test *P<0.02, ***P<0.0001 compared to control). (B) Plasma TNFA levels of male, female and OVX control and HSD groups (two-way ANOVA was performed (Sex, F(1,67) = 3.1593, P = 0.080 and diet F(1,67)= 134.46, P = 0), with post hoc Tukey’s test *P < 0.001 compared to control). (C) Plasma IL6 levels of male, female and OVX control and HSD groups. (D) Plasma IL4 levels of male, female and OVX control and HSD groups. We used n = 25 per duplicated for each cytokine. The bars represent the mean ± s.e.m.
Figure 6
Figure 6
Liver steatosis. (A) The ratio of the liver weight and body weight ratio of the rats. The bars represent the mean ± s.e.m. (n = 10). Two-way ANOVA was performed (Sex, F(1,39) = 1.81, P = 0.1857 and diet F(1,39) = 17.01, P = 1.88 x 10⁻⁴), with post hoc Tukey’s test *P < 0.03 compared to control. Representative pictures of H&E stained (B) and Oil-red-O stained, black arrowheads show microvesicular fat depositions (C) liver sections from males, females and OVXs of control and HSD conditions, scale bar = 50 µm. (D) The bars represent the percentage of area occupied by lipids in both control and HSD conditions from male, female and OVX groups (n = 10 rats per condition). Two-way ANOVA was performed (Sex, F(1,35) = 1.80, P = 0.18 and diet F(1,35) = 81.30, P = 1.18 x 10⁻¹⁰), with post hoc Tukey’s test; with interaction between sex and diet (P = 0.001). *P < 0.002, **P < 0.0001; ***P < 0.05 compared to their control group.
Figure 7
Figure 7
Effect of high-sucrose diet over the insulin-signaling pathway in peripancreatic and gonadal adipose tissue. Representative blots of IRS1, AKT, p-AKT(S473), P70S6K1, p-P70S6K1(T389), and β-actin as load control, from pooled peripancreatic adipose tissue (pWAT) (A) and gonadal adipose tissue (gWAT) (C) from control and HSD groups. Normalized ratio of phosphorylated AKT and P70S6K1 and total forms in pWAT (B) and gWAT (D). Mean density ± s.e.m. from three independent experiments. Two-way ANOVA was performed for p-AKT (Diet F(1,8) = 22.4, P = 0.0014) *P < 0.01 compared to control; p-P70S6K1 (Diet F(1,8) = 7.89, P = 0.022) with post hoc Tukey’s test with interaction between sex and diet. *P < 0.05 compared to control in pWAT. For p-AKT in gWAT (Sex F(1,8) = 7.51, P = 0.02). One-way ANOVA with post hoc Tukey’s test *P < 0.008 compared to control.
Figure 8
Figure 8
Effect of high-sucrose diet over the insulin-signaling pathway in gastrocnemius muscle. Representative blots of AKT, p-AKT(S473), P70S6K1, p-P70S6K1(T389) and β-actin as a load control, from pooled gastrocnemius muscles (A). Normalized ratio of phosphorylated AKT(S473) and P70S6K1(T389) and total forms (B). Mean density ± s.e.m. from three independent experiments. Two-way ANOVA was performed for p-AKT (Sex, F(1,4) = 0.309, P = 0.60 and diet F(1,4) = 68.92, P = 0.001), with post hoc Tukey’s test *P < 0.003 compared to control. With interaction between sex and diet.

References

    1. Deng H, Jasper H. Sexual dimorphism: how female cells win the race. Current Biology 2016. 26 R212–R21. ( 10.1016/j.cub.2016.01.062) - DOI - PubMed
    1. Vige A, Gallou-Kabani C, Junien C. Sexual dimorphism in non-Mendelian inheritance. Pediatric Research 2008. 63 340–34. ( 10.1203/PDR.0b013e318165b896) - DOI - PubMed
    1. Moller DE, Flier JS. Insulin resistance–mechanisms, syndromes, and implications. New England Journal of Medicine 1991. 325 938–9. ( 10.1056/NEJM199109263251307) - DOI - PubMed
    1. Kautzky-Willer A, Harreiter J, Pacini G. Sex and gender differences in risk, pathophysiology and complications of type 2 diabetes mellitus. Endocrine Reviews 2016. 37 278–316. ( 10.1210/er.2015-1137) - DOI - PMC - PubMed
    1. Hiriart M, Velasco M, Larque C, Diaz-Garcia CM. Metabolic syndrome and ionic channels in pancreatic beta cells. Vitamins and Hormones 2014. 95 87–114. ( 10.1016/B978-0-12-800174-5.00004-1) - DOI - PubMed

LinkOut - more resources