

Global age-sex-specific fertility, mortality, healthy life expectancy (HALE), and population estimates in 204 countries and territories, 1950-2019: a comprehensive demographic analysis for the Global Burden of Disease Study 2019
- PMID: 33069325
- PMCID: PMC7566045
- DOI: 10.1016/S0140-6736(20)30977-6
Global age-sex-specific fertility, mortality, healthy life expectancy (HALE), and population estimates in 204 countries and territories, 1950-2019: a comprehensive demographic analysis for the Global Burden of Disease Study 2019
Abstract
Background: Accurate and up-to-date assessment of demographic metrics is crucial for understanding a wide range of social, economic, and public health issues that affect populations worldwide. The Global Burden of Diseases, Injuries, and Risk Factors Study (GBD) 2019 produced updated and comprehensive demographic assessments of the key indicators of fertility, mortality, migration, and population for 204 countries and territories and selected subnational locations from 1950 to 2019.
Methods: 8078 country-years of vital registration and sample registration data, 938 surveys, 349 censuses, and 238 other sources were identified and used to estimate age-specific fertility. Spatiotemporal Gaussian process regression (ST-GPR) was used to generate age-specific fertility rates for 5-year age groups between ages 15 and 49 years. With extensions to age groups 10-14 and 50-54 years, the total fertility rate (TFR) was then aggregated using the estimated age-specific fertility between ages 10 and 54 years. 7417 sources were used for under-5 mortality estimation and 7355 for adult mortality. ST-GPR was used to synthesise data sources after correction for known biases. Adult mortality was measured as the probability of death between ages 15 and 60 years based on vital registration, sample registration, and sibling histories, and was also estimated using ST-GPR. HIV-free life tables were then estimated using estimates of under-5 and adult mortality rates using a relational model life table system created for GBD, which closely tracks observed age-specific mortality rates from complete vital registration when available. Independent estimates of HIV-specific mortality generated by an epidemiological analysis of HIV prevalence surveys and antenatal clinic serosurveillance and other sources were incorporated into the estimates in countries with large epidemics. Annual and single-year age estimates of net migration and population for each country and territory were generated using a Bayesian hierarchical cohort component model that analysed estimated age-specific fertility and mortality rates along with 1250 censuses and 747 population registry years. We classified location-years into seven categories on the basis of the natural rate of increase in population (calculated by subtracting the crude death rate from the crude birth rate) and the net migration rate. We computed healthy life expectancy (HALE) using years lived with disability (YLDs) per capita, life tables, and standard demographic methods. Uncertainty was propagated throughout the demographic estimation process, including fertility, mortality, and population, with 1000 draw-level estimates produced for each metric.
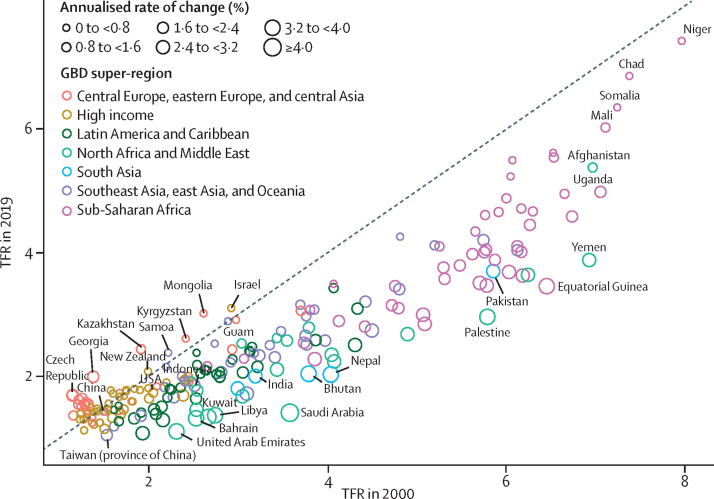
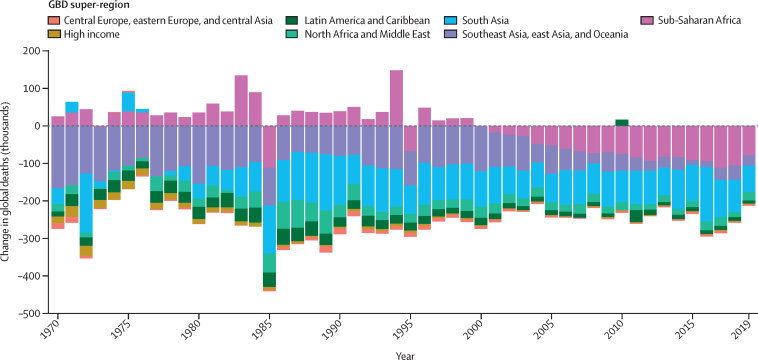
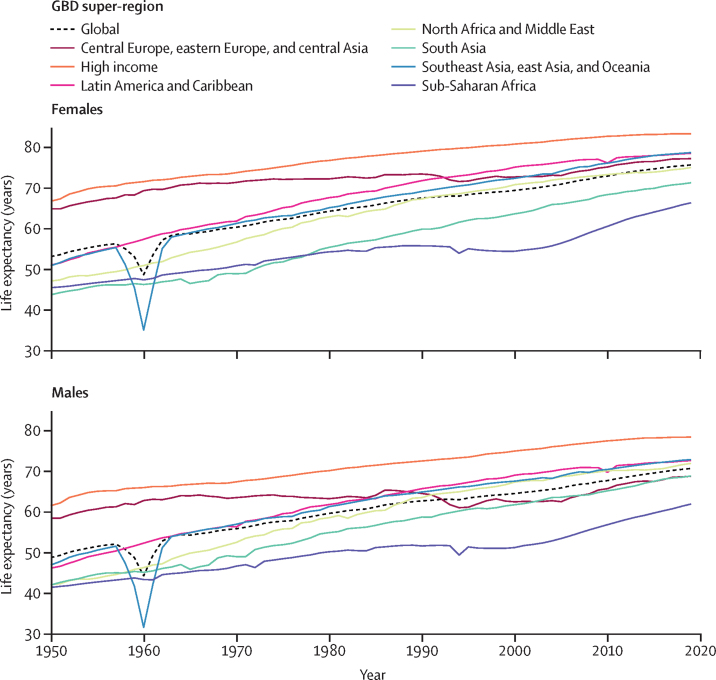
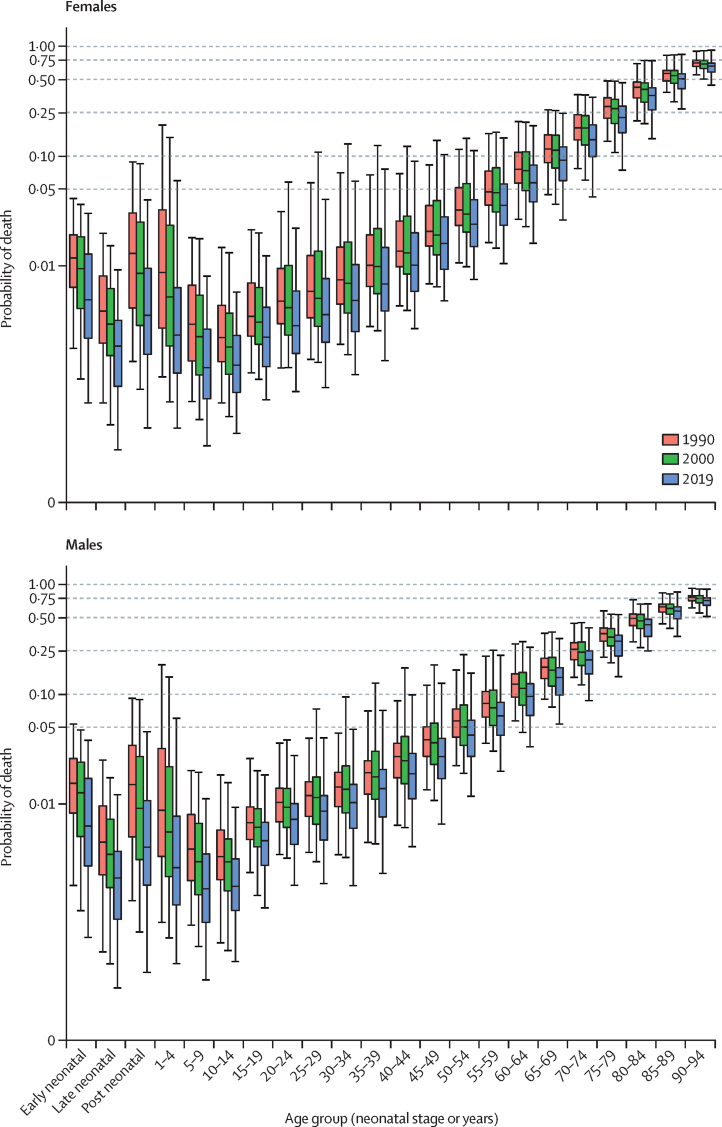
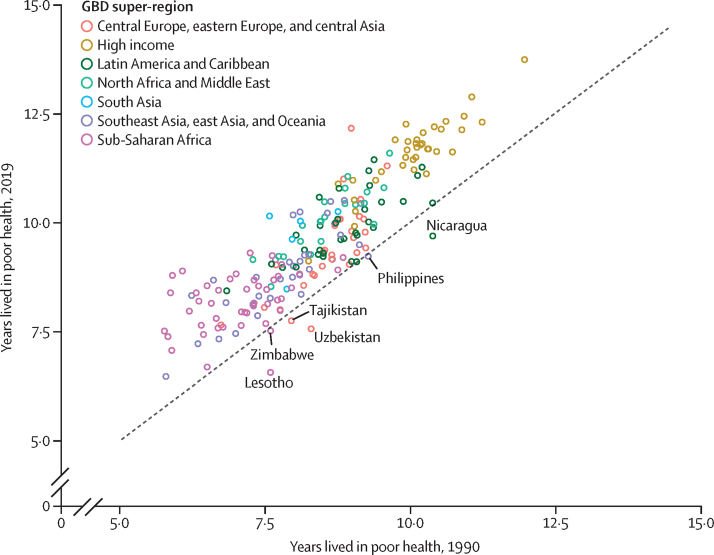
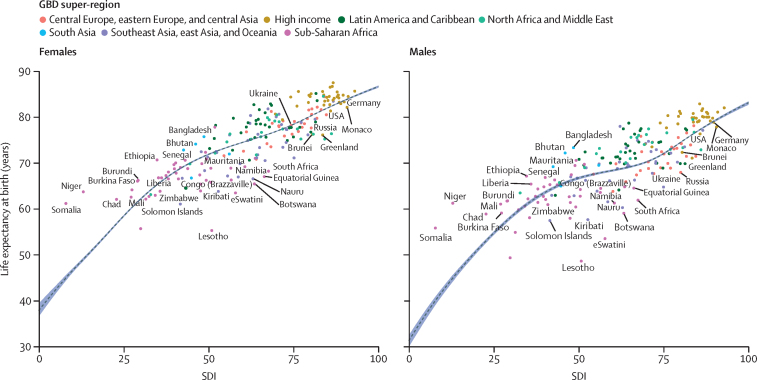
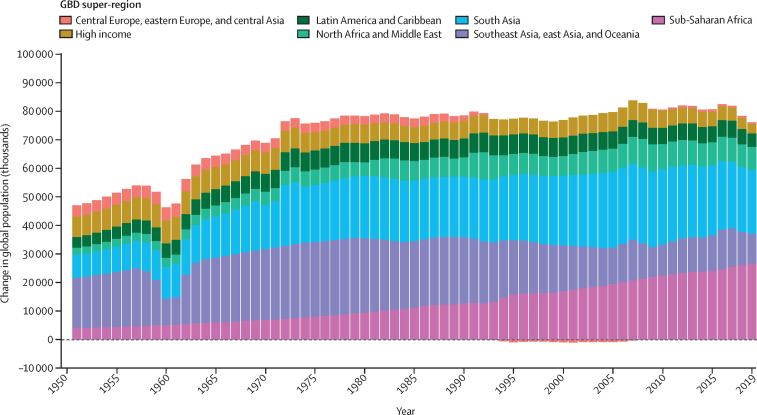
Findings: The global TFR decreased from 2·72 (95% uncertainty interval [UI] 2·66-2·79) in 2000 to 2·31 (2·17-2·46) in 2019. Global annual livebirths increased from 134·5 million (131·5-137·8) in 2000 to a peak of 139·6 million (133·0-146·9) in 2016. Global livebirths then declined to 135·3 million (127·2-144·1) in 2019. Of the 204 countries and territories included in this study, in 2019, 102 had a TFR lower than 2·1, which is considered a good approximation of replacement-level fertility. All countries in sub-Saharan Africa had TFRs above replacement level in 2019 and accounted for 27·1% (95% UI 26·4-27·8) of global livebirths. Global life expectancy at birth increased from 67·2 years (95% UI 66·8-67·6) in 2000 to 73·5 years (72·8-74·3) in 2019. The total number of deaths increased from 50·7 million (49·5-51·9) in 2000 to 56·5 million (53·7-59·2) in 2019. Under-5 deaths declined from 9·6 million (9·1-10·3) in 2000 to 5·0 million (4·3-6·0) in 2019. Global population increased by 25·7%, from 6·2 billion (6·0-6·3) in 2000 to 7·7 billion (7·5-8·0) in 2019. In 2019, 34 countries had negative natural rates of increase; in 17 of these, the population declined because immigration was not sufficient to counteract the negative rate of decline. Globally, HALE increased from 58·6 years (56·1-60·8) in 2000 to 63·5 years (60·8-66·1) in 2019. HALE increased in 202 of 204 countries and territories between 2000 and 2019.
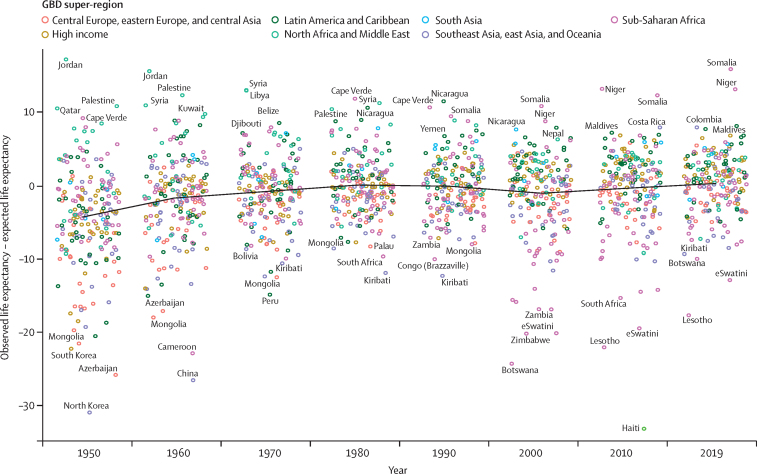
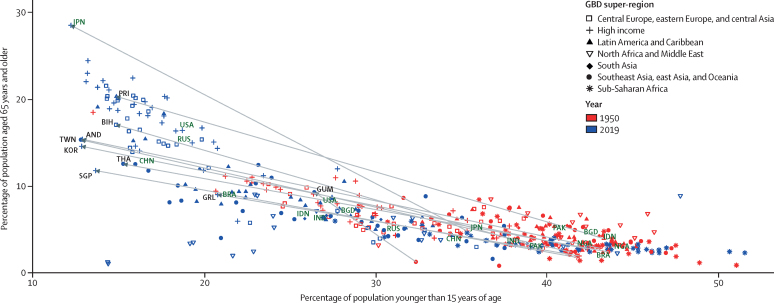
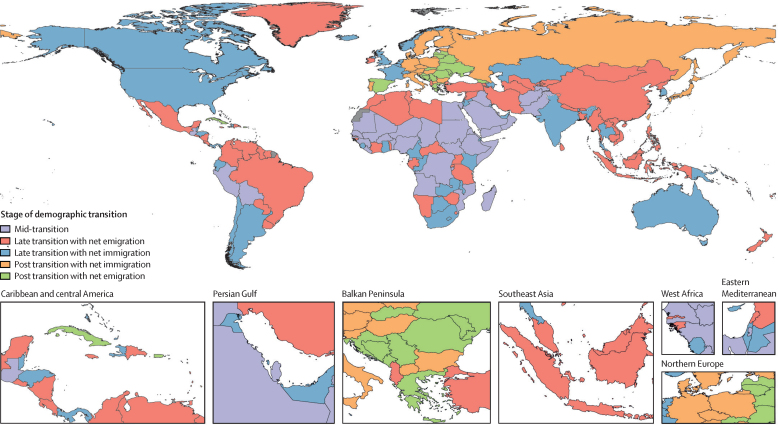
Interpretation: Over the past 20 years, fertility rates have been dropping steadily and life expectancy has been increasing, with few exceptions. Much of this change follows historical patterns linking social and economic determinants, such as those captured by the GBD Socio-demographic Index, with demographic outcomes. More recently, several countries have experienced a combination of low fertility and stagnating improvement in mortality rates, pushing more populations into the late stages of the demographic transition. Tracking demographic change and the emergence of new patterns will be essential for global health monitoring.
Funding: Bill & Melinda Gates Foundation.
Copyright © 2020 The Author(s). Published by Elsevier Ltd. This is an Open Access article under the CC BY 4.0 license. Published by Elsevier Ltd.. All rights reserved.
Figures
References
-
- UN Statistics Division National statistical offices. https://unstats.un.org/home/nso_sites
-
- Organisation for Economic Co-operation and Development Society data. http://data.oecd.org/society.htm
-
- Eurostat Population: demography, population projections, census, asylum & migration—overview. https://ec.europa.eu/eurostat/web/population/overview
-
- WHO Disease burden and mortality estimates. http://www.who.int/healthinfo/global_burden_disease/estimates/en
-
- US Census Bureau International programs, international data base. https://www.census.gov/programs-surveys/international-programs/about/idb...
Publication types
MeSH terms
Grants and funding
- MC_UU_12017/13/MRC_/Medical Research Council/United Kingdom
- SPHSU17/CSO_/Chief Scientist Office/United Kingdom
- P30 AG047845/AG/NIA NIH HHS/United States
- T32 AI007044/AI/NIAID NIH HHS/United States
- K43 TW 010716-03/NH/NIH HHS/United States
- MR/M015084/1/MRC_/Medical Research Council/United Kingdom
- SCAF/15/02/CSO_/Chief Scientist Office/United Kingdom
- MC_UU_00022/2/MRC_/Medical Research Council/United Kingdom
- MC_UU_12017/15/MRC_/Medical Research Council/United Kingdom
- R03 AG043052/AG/NIA NIH HHS/United States
- K43 TW010716/TW/FIC NIH HHS/United States
- R21 AG032572/AG/NIA NIH HHS/United States
- R01 MH110163/MH/NIMH NIH HHS/United States
- 201900/Z/16/Z/WT_/Wellcome Trust/United Kingdom
- 206471/Z/17/Z/WT_/Wellcome Trust/United Kingdom
- U01 AG009740/AG/NIA NIH HHS/United States
- 109949/Z/15/Z/WT_/Wellcome Trust/United Kingdom
- 205039/Z/16/Z/WT_/Wellcome Trust/United Kingdom
- R01 AG030153/AG/NIA NIH HHS/United States
LinkOut - more resources
Full Text Sources
Medical
Miscellaneous
