. 2022 Apr-Jun;38(2):489-504.
doi: 10.1016/j.ijforecast.2020.10.001. Epub 2020 Oct 9.

Comparing the accuracy of several network-based COVID-19 prediction algorithms

Affiliations

Comparing the accuracy of several network-based COVID-19 prediction algorithms

Massimo A Achterberg et al. Int J Forecast. 2022 Apr-Jun.

Abstract

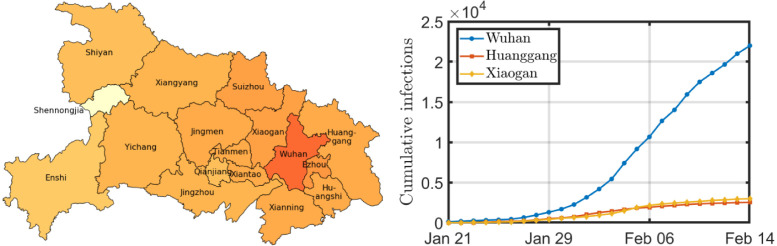
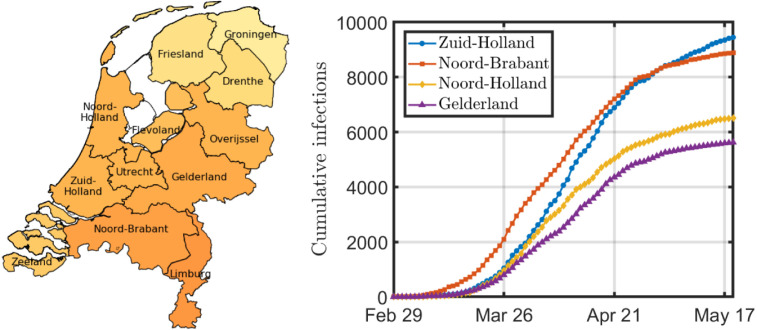
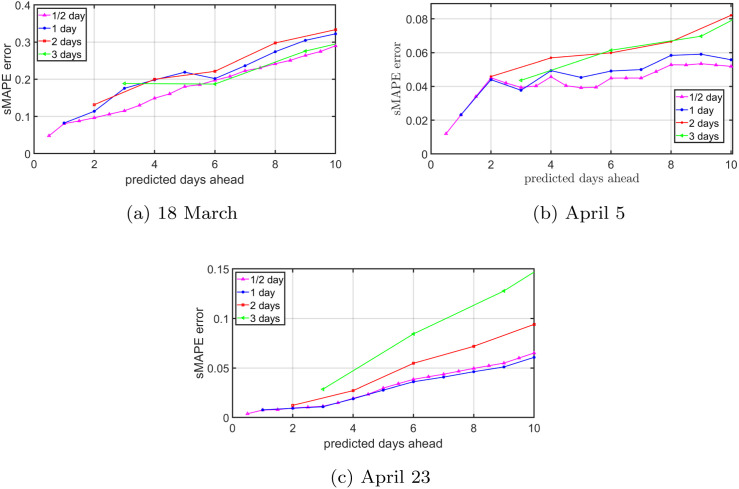
Researchers from various scientific disciplines have attempted to forecast the spread of coronavirus disease 2019 (COVID-19). The proposed epidemic prediction methods range from basic curve fitting methods and traffic interaction models to machine-learning approaches. If we combine all these approaches, we obtain the Network Inference-based Prediction Algorithm (NIPA). In this paper, we analyse a diverse set of COVID-19 forecast algorithms, including several modifications of NIPA. Among the algorithms that we evaluated, the original NIPA performed best at forecasting the spread of COVID-19 in Hubei, China and in the Netherlands. In particular, we show that network-based forecasting is superior to any other forecasting algorithm.

Keywords: Bayesian methods; Epidemiology; Forecast accuracy; Machine learning methods; Network inference; SIR model; Time series methods.


Figures

Fig. 1
Fig. 1
The figure on the left shows a geographical map of Hubei. The darker the city, the more infections per 100,000 inhabitants on February 14. The three cities with the most infections on February 14 are displayed on the right.
Fig. 2
Fig. 2
Prediction accuracy for the situation in Hubei, China. The subfigures show the prediction accuracy for a forecast horizon of (a) one day, (b) two days, (c) three days, (d) four days, (e) five days, and (f) six days for the prediction algorithms from Section 2.
Fig. 3
Fig. 3
Surface error plots for four-days-ahead forecasts versus time. The subfigures show (a) NIPA, (b) NIPA separate, (c) NIPA static prior, (d) NIPA dynamic prior, (e) logistic function, and (f) LSTM.
Fig. 4
Fig. 4
The figure on the left shows a geographical map of the Netherlands. The darker the province, the more infections per 100,000 inhabitants on May 19. The four provinces with the most infections on May 19 are displayed on the right.
Fig. 5
Fig. 5
Prediction accuracy for the situation in the Netherlands. The subfigures show the prediction accuracy (a) one day ahead, (b) two days ahead, (c) three days ahead, (d) four days ahead, (e) five days ahead, and (f) six days ahead.
Fig. E.6
Fig. E.6
The prediction for (a) NIPA and (b) NIPA static prior with generated SIR data based on Definition 1 on a 10-node network.
Fig. G.7
Fig. G.7
(Method A: First remove, then smooth.) The NIPA prediction accuracy for the situation in the Netherlands for varying time steps Δt. The subplots show the forecast for (a) March 18, (b) April 5, and (c) April 23. For the time step Δt=2 days and Δt=3 days, the data is first removed and then smoothed.
Fig. G.8
Fig. G.8
(Method B: First smooth, then remove.) The NIPA prediction accuracy for the situation in the Netherlands for varying time steps Δt. The subplots show the forecast for (a) March 18, (b) April 5, and (c) April 23. For the time step Δt=2 days and Δt=3 days, the data is first smoothed and then removed.
None
None

References

    1. Al-qaness M., Ewees A., Fan H., Abd El Aziz M. Optimization method for forecasting confirmed cases of COVID-19 in China. Journal of Clinical Medicine. 2020;9:674. doi: 10.3390/jcm9030674. - DOI - PMC - PubMed
    1. Baidu Migration website (2020). Retrieved on February 16, 2020 from https://qianxi.baidu.com/2020/.
    1. Boyd S., Vandenberghe L. Cambridge University Press; 2004. Convex optimization. - DOI
    1. CBS S. 2018. Banen van werknemers naar woon- en werkregio. Retrieved on May 29, 2020 from.
    1. Chang S.Y., Pierson E., Koh P.W., Gerardin J., Redbird B., Grusky D., Leskovec J. 2020. Mobility network modeling explains higher SARS-CoV-2 infection rates among disadvantaged groups and informs reopening strategies. medRxiv . - DOI

LinkOut - more resources