

Modelling a pandemic with asymptomatic patients, impact of lockdown and herd immunity, with applications to SARS-CoV-2
- PMID: 33071595
- PMCID: PMC7546280
- DOI: 10.1016/j.arcontrol.2020.10.003
Modelling a pandemic with asymptomatic patients, impact of lockdown and herd immunity, with applications to SARS-CoV-2
Abstract
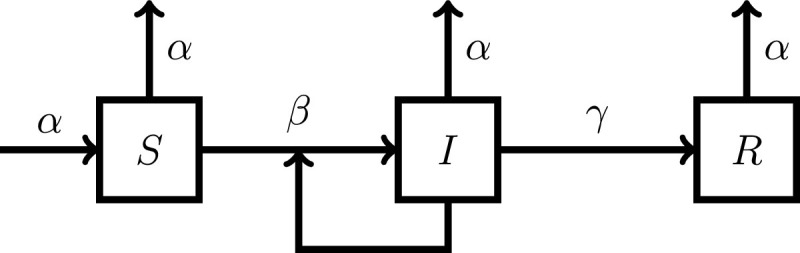
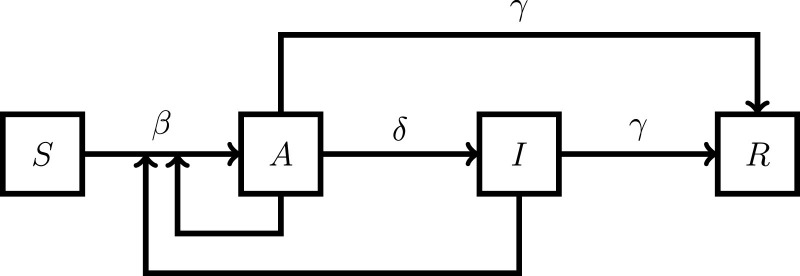
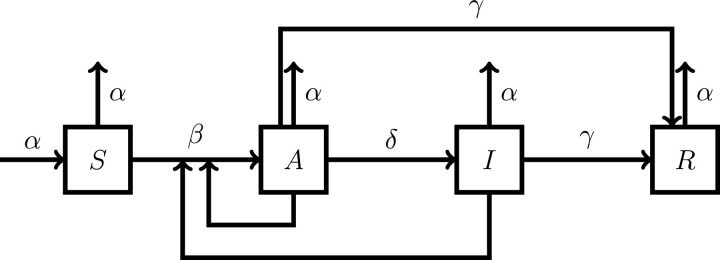
The SARS-CoV-2 is a type of coronavirus that has caused the pandemic known as the Coronavirus Disease of 2019, or COVID-19. In traditional epidemiological models such as SEIR (Susceptible, Exposed, Infected, Removed), the exposed group E does not infect the susceptible group S. A distinguishing feature of COVID-19 is that, unlike with previous viral diseases, there is a distinct "asymptomatic" group A, which does not show any symptoms, but can nevertheless infect others, at the same rate as infected symptomatic patients. This situation is captured in a model known as SAIR (Susceptible, Asymptomatic, Infected, Removed), introduced in Robinson and Stillianakis (2013). The dynamical behavior of the SAIR model is quite different from that of the SEIR model. In this paper, we use Lyapunov theory to establish the global asymptotic stabililty of the SAIR model, both without and with vital dynamics. Then we develop compartmental SAIR models to cater to the migration of population across geographic regions, and once again establish global asymptotic stability. Next, we go beyond long-term asymptotic analysis and present methods for estimating the parameters in the SAIR model. We apply these estimation methods to data from several countries including India, and demonstrate that the predicted trajectories of the disease closely match actual data. We show that "herd immunity" (defined as the time when the number of infected persons is maximum) can be achieved when the total of infected, symptomatic and asymptomatic persons is as low as 25% of the population. Previous estimates are typically 50% or higher. We also conclude that "lockdown" as a way of greatly reducing inter-personal contact has been very effective in checking the progress of the disease.
Keywords: COVID-19; Herd immunity; Lockdown; Lyapunov stability; SAIR model; SARS-CoV-2.
© 2020 The Author(s).
Conflict of interest statement
The authors declare that they have no known competing financial interests or personal relationships that could have appeared to influence the work reported in this paper.
Figures


References
-
- Anderson R., May R. Oxford University Press; 1991. Infectious diseases of humans: Dynamics and control.
-
- Dietz, K. (1975). Transmission and control of arbovirus diseases. Ludwig, D. Cooke, K. L. Epidemiology, society for industrial and applied mathematics (SIAM), 104–121.
Publication types
LinkOut - more resources
Full Text Sources
Miscellaneous