

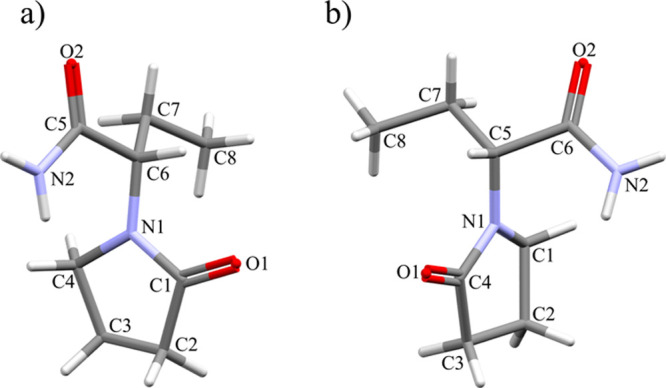
Effect of Chirality on the Compression of 2-(2-Oxo-1-pyrrolidinyl)butyramide: A Tale of Two Crystals
- PMID: 33071676
- PMCID: PMC7552093
- DOI: 10.1021/acs.cgd.0c00871
Effect of Chirality on the Compression of 2-(2-Oxo-1-pyrrolidinyl)butyramide: A Tale of Two Crystals
Abstract
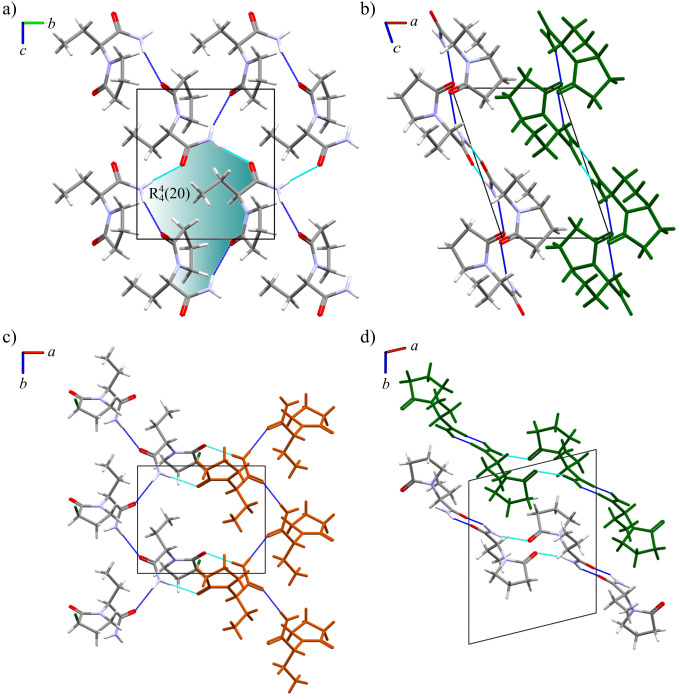
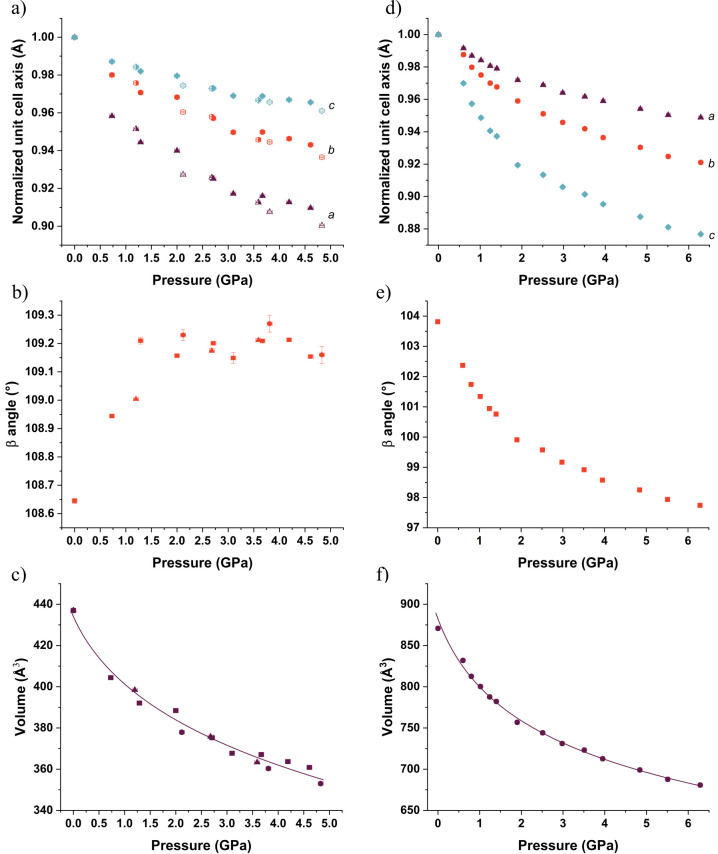
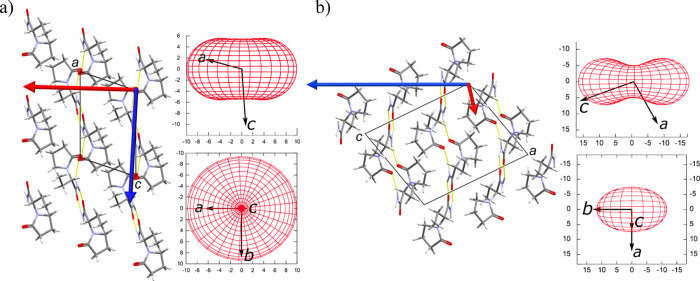
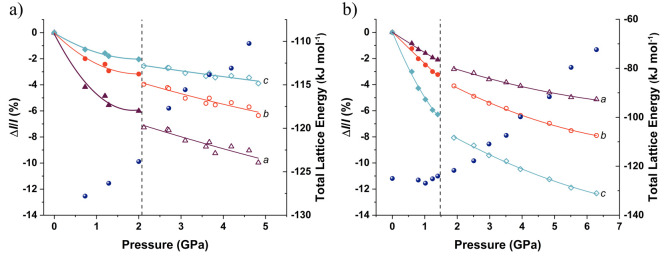
Understanding polymorphism in chiral systems for drug manufacturing is essential to avoid undesired therapeutic effects. Generally, polymorphism is studied through changes in temperature and solution concentration. A less common approach is the application of pressure. The goal of this work is to investigate the effect of pressure on levetiracetam (pure enantiomer) and etiracetam (racemic compound). Anisotropic compressions of levetiracetam and etiracetam are observed to 5.26 and 6.29 GPa, respectively. The most compressible direction for both was identified to be perpendicular to the layers of the structure. Raman spectroscopy and an analysis of intermolecular interactions suggest subtle phase transitions in levetiracetam (∼2 GPa) and etiracetam (∼1.5 GPa). The stability of etiracetam increases with respect to levetiracetam on compression; hence, the chiral resolution of this system is unfavorable using pressure. This work contributes to the ongoing efforts in understanding the stability of chiral systems.
Conflict of interest statement
The authors declare no competing financial interest.
Figures


References
-
- Brittain H. G.Polymorphism in Pharmaceutical Solids, 2nd ed.; CRC Press: 2016. 10.3109/9781420073225. - DOI
-
- Yu L.; Reutzel S. M.; Stephenson G. A. Physical Characterization of Polymorphic Drugs: An Integrated Characterization Strategy. Pharm. Sci. Technol. Today 1998, 1, 118–127. 10.1016/S1461-5347(98)00031-5. - DOI