

Poly(cyclodextrin)-Polydrug Nanocomplexes as Synthetic Oncolytic Virus for Locoregional Melanoma Chemoimmunotherapy
- PMID: 33071710
- PMCID: PMC7566879
- DOI: 10.1002/adfm.201908788
Poly(cyclodextrin)-Polydrug Nanocomplexes as Synthetic Oncolytic Virus for Locoregional Melanoma Chemoimmunotherapy
Abstract
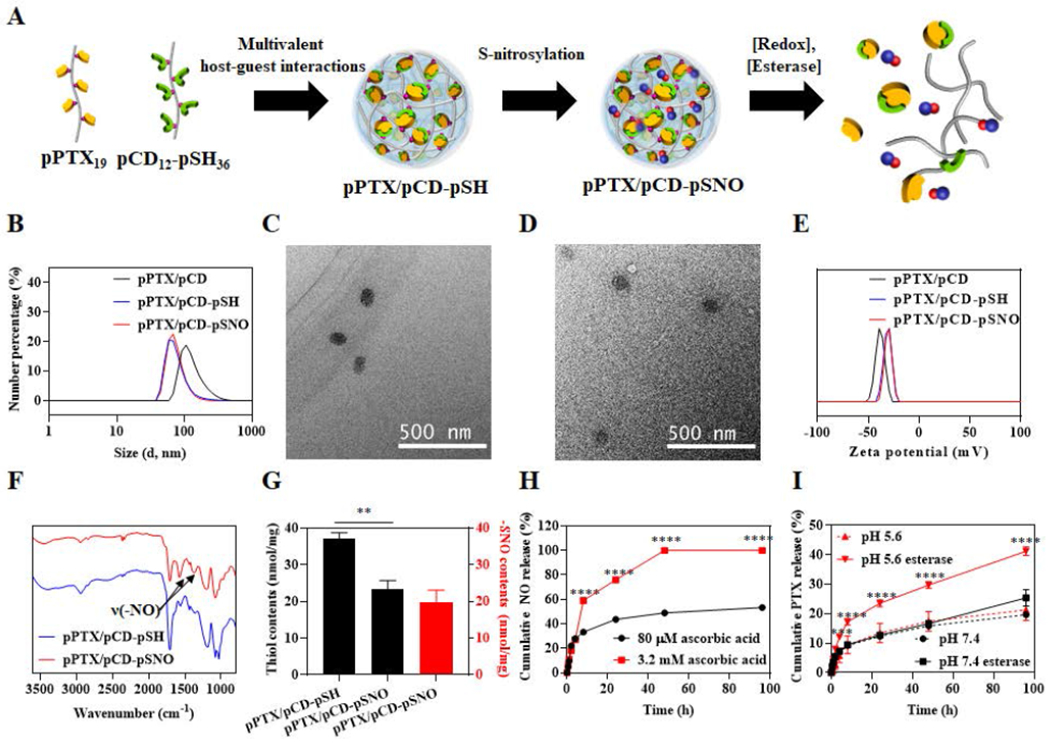
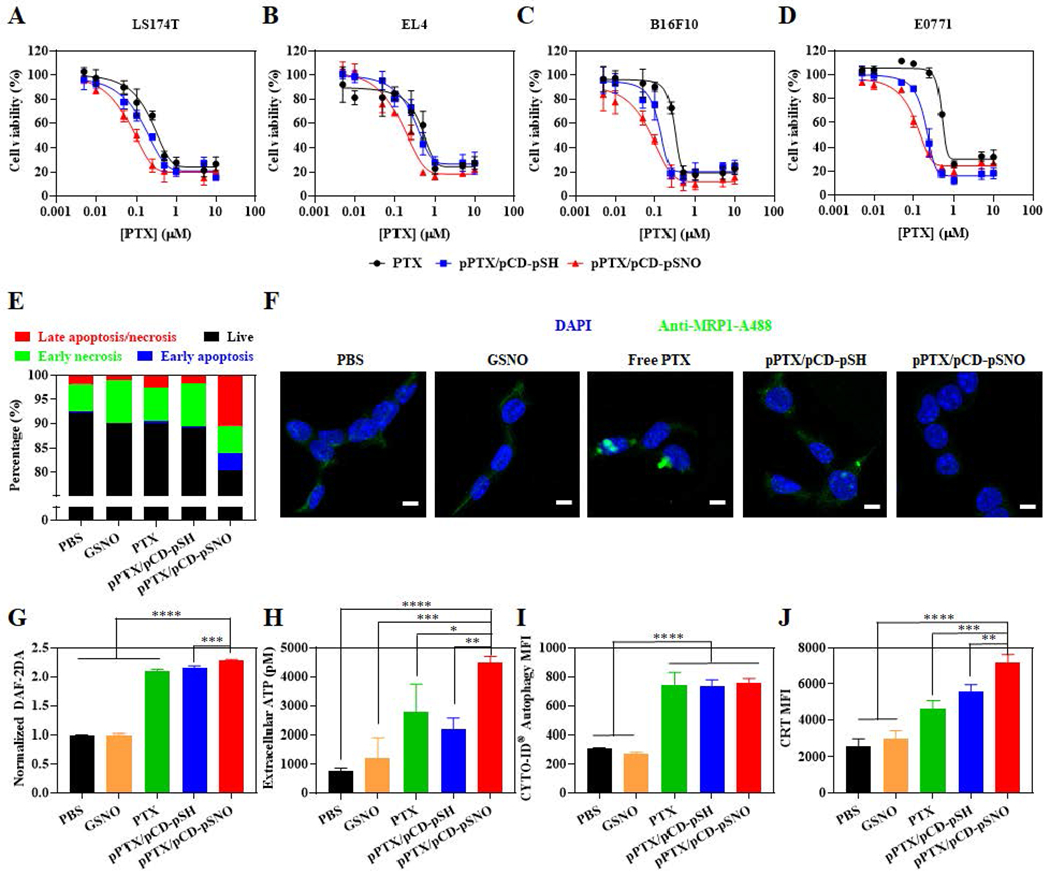
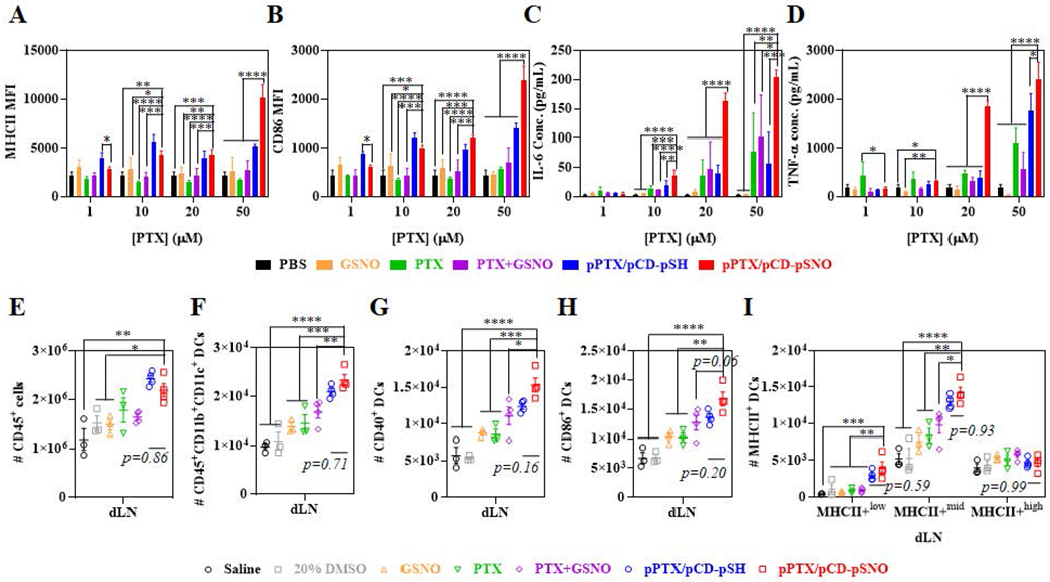
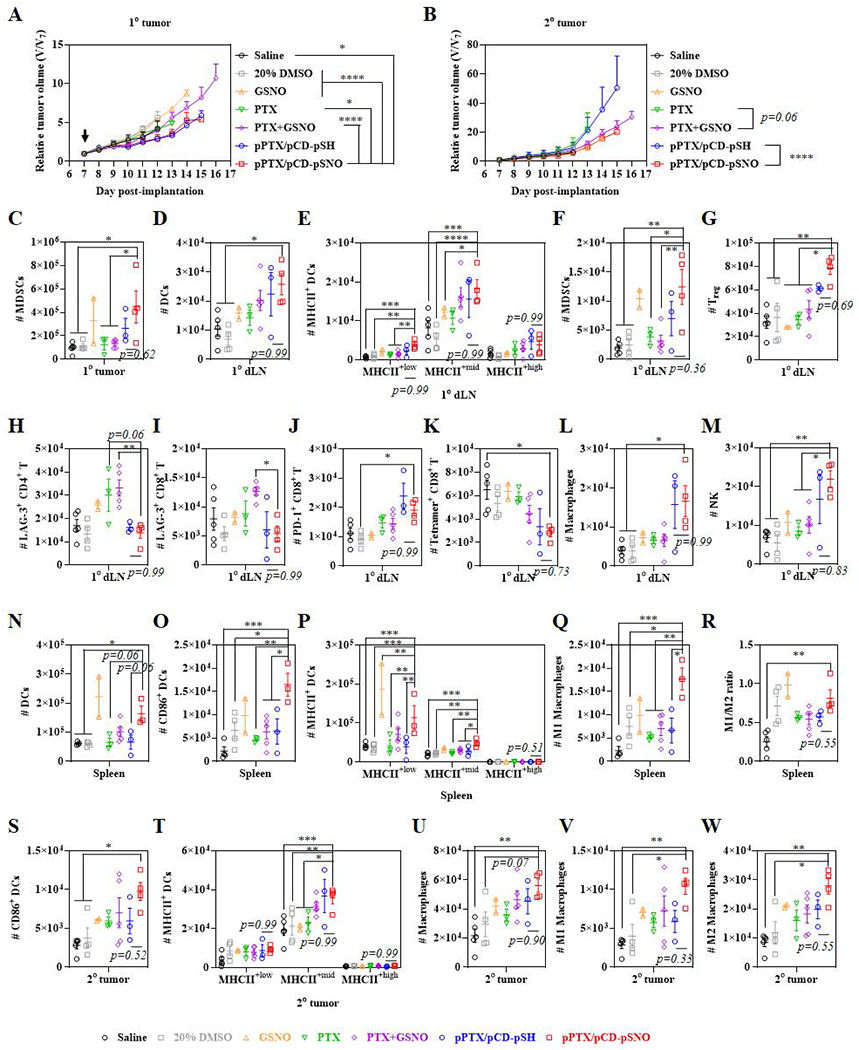
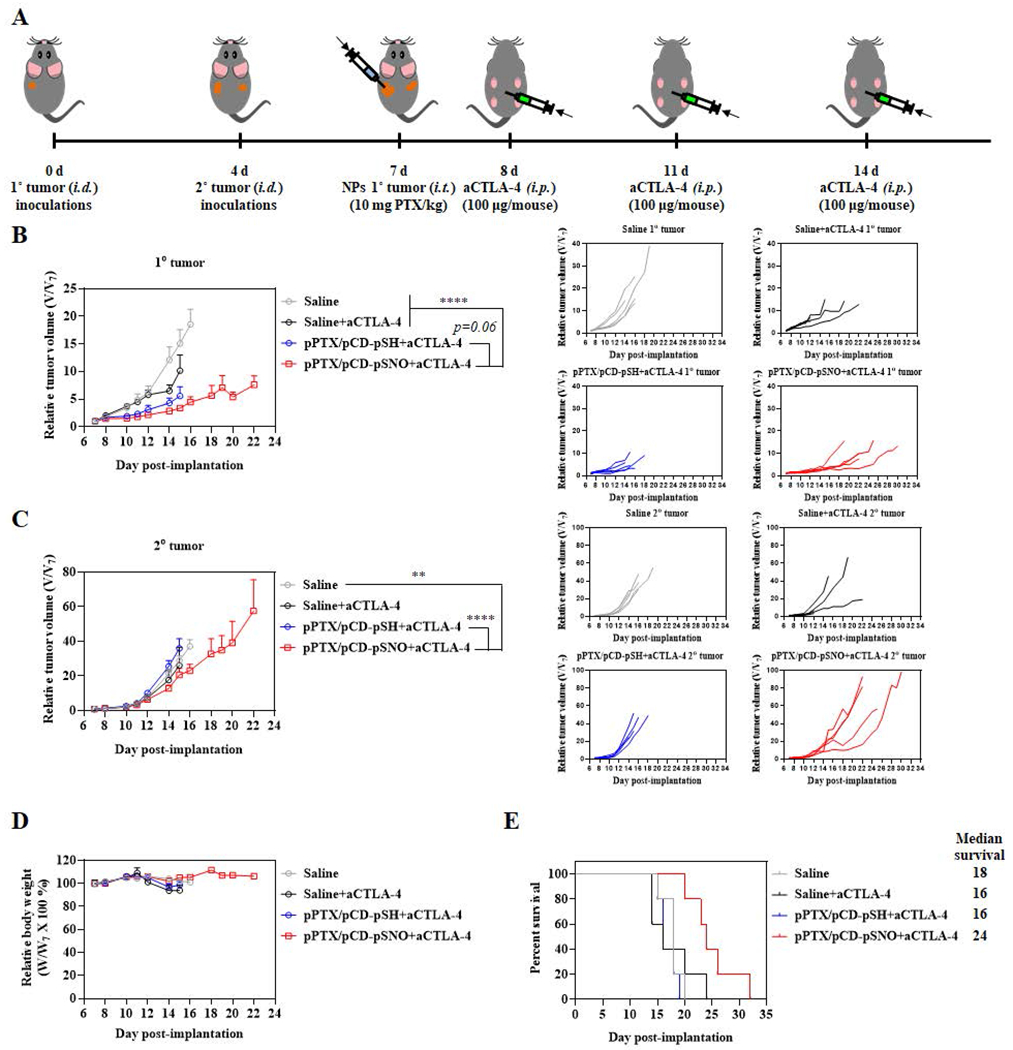
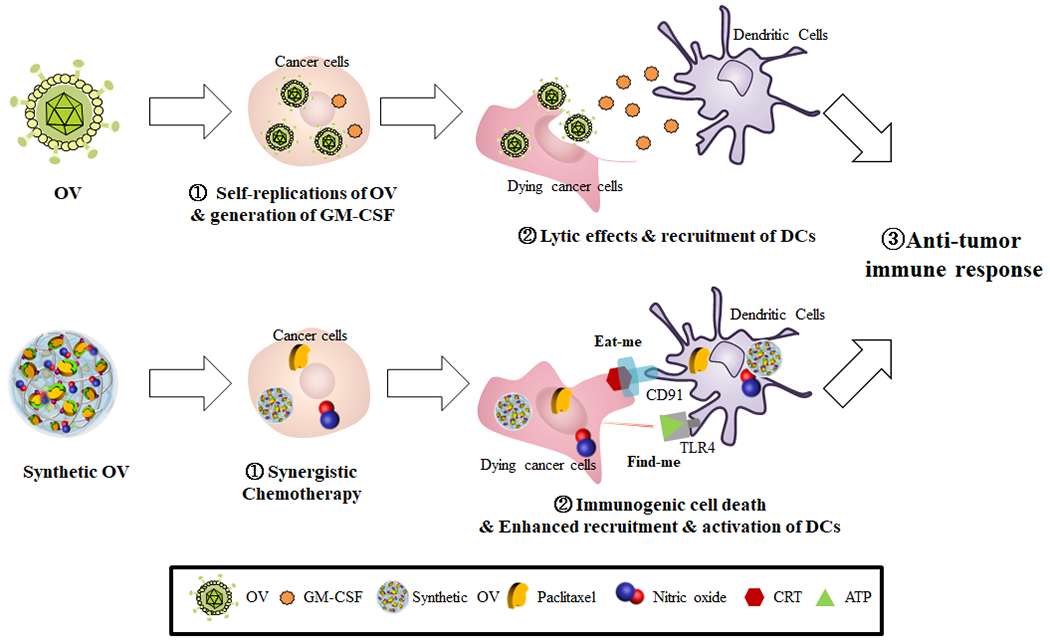
Despite the approval of oncolytic virus therapy for advanced melanoma, its intrinsic limitations that include the risk of persistent viral infection and cost-intensive manufacturing motivate the development of analogous approaches that are free from the disadvantages of virus-based therapies. Herein, we report a nanoassembly comprised of multivalent host-guest interactions between polymerized paclitaxel (pPTX) and nitric oxide incorporated polymerized β-cyclodextrin (pCD-pSNO) that through its bioactive components and when used locoregionally recapitulates the therapeutic effects of oncolytic virus. The resultant pPTX/pCD-pSNO exhibits significantly enhanced cytotoxicity, immunogenic cell death, dendritic cell activation and T cell expansion in vitro compared to free agents alone or in combination. In vivo, intratumoral administration of pPTX/pCD-pSNO results in activation and expansion of dendritic cells systemically, but with a corresponding expansion of myeloid-derived suppressor cells and suppression of CD8+ T cell expansion. When combined with antibody targeting cytotoxic T lymphocyte antigen-4 that blunts this molecule's signaling effects on T cells, intratumoral pPTX/pCD-pSNO treatment elicits potent anticancer effects that significantly prolong animal survival. This formulation thus leverages the chemo- and immunotherapeutic synergies of paclitaxel and nitric oxide and suggests the potential for virus-free nanoformulations to mimic the therapeutic action and benefits of oncolytic viruses.
Keywords: Cancer; Chemotherapy; Immunotherapy; Nitric oxide; Paclitaxel.
Conflict of interest statement
Conflict of Interest The authors declare no conflict of interest.
Figures
Similar articles
-
Development of a new fusion-enhanced oncolytic immunotherapy platform based on herpes simplex virus type 1.J Immunother Cancer. 2019 Aug 10;7(1):214. doi: 10.1186/s40425-019-0682-1. J Immunother Cancer. 2019. PMID: 31399043 Free PMC article.
-
Natural killer T cell immunotherapy combined with oncolytic vesicular stomatitis virus or reovirus treatments differentially increases survival in mouse models of ovarian and breast cancer metastasis.J Immunother Cancer. 2021 Mar;9(3):e002096. doi: 10.1136/jitc-2020-002096. J Immunother Cancer. 2021. PMID: 33722907 Free PMC article.
-
Immunogenicity of oncolytic vaccinia viruses JX-GFP and TG6002 in a human melanoma in vitro model: studying immunogenic cell death, dendritic cell maturation and interaction with cytotoxic T lymphocytes.Onco Targets Ther. 2017 May 2;10:2389-2401. doi: 10.2147/OTT.S126320. eCollection 2017. Onco Targets Ther. 2017. PMID: 28496337 Free PMC article.
-
Intratumoral Immunotherapy-Update 2019.Oncologist. 2020 Mar;25(3):e423-e438. doi: 10.1634/theoncologist.2019-0438. Epub 2019 Nov 29. Oncologist. 2020. PMID: 32162802 Free PMC article. Review.
-
Immunovirotherapy: The role of antibody based therapeutics combination with oncolytic viruses.Front Immunol. 2022 Oct 13;13:1012806. doi: 10.3389/fimmu.2022.1012806. eCollection 2022. Front Immunol. 2022. PMID: 36311790 Free PMC article. Review.
Cited by
-
Elicitation of stem-like CD8+ T cell responses via lymph node-targeted chemoimmunotherapy evokes systemic tumor control.J Immunother Cancer. 2022 Sep;10(9):e005079. doi: 10.1136/jitc-2022-005079. J Immunother Cancer. 2022. PMID: 36100312 Free PMC article.
-
Nanoparticle-mediated synergistic chemoimmunotherapy for tailoring cancer therapy: recent advances and perspectives.J Nanobiotechnology. 2021 Apr 17;19(1):110. doi: 10.1186/s12951-021-00861-0. J Nanobiotechnology. 2021. PMID: 33865432 Free PMC article. Review.
-
Nitric Oxide-Driven Nanomotor for Deep Tissue Penetration and Multidrug Resistance Reversal in Cancer Therapy.Adv Sci (Weinh). 2020 Dec 18;8(3):2002525. doi: 10.1002/advs.202002525. eCollection 2021 Feb. Adv Sci (Weinh). 2020. PMID: 33552861 Free PMC article.
-
Synergetic delivery of artesunate and isosorbide 5-mononitrate with reduction-sensitive polymer nanoparticles for ovarian cancer chemotherapy.J Nanobiotechnology. 2022 Nov 5;20(1):471. doi: 10.1186/s12951-022-01676-3. J Nanobiotechnology. 2022. PMID: 36335352 Free PMC article.
-
Chemotherapy-Enabled Colorectal Cancer Immunotherapy of Self-Delivery Nano-PROTACs by Inhibiting Tumor Glycolysis and Avoiding Adaptive Immune Resistance.Adv Sci (Weinh). 2024 Apr;11(15):e2309204. doi: 10.1002/advs.202309204. Epub 2024 Jan 18. Adv Sci (Weinh). 2024. PMID: 38239040 Free PMC article.
References
Grants and funding
LinkOut - more resources
Full Text Sources
Research Materials