

Predicting Relapse in Patients With Triple Negative Breast Cancer (TNBC) Using a Deep-Learning Approach
- PMID: 33071806
- PMCID: PMC7538858
- DOI: 10.3389/fphys.2020.511071
Predicting Relapse in Patients With Triple Negative Breast Cancer (TNBC) Using a Deep-Learning Approach
Abstract
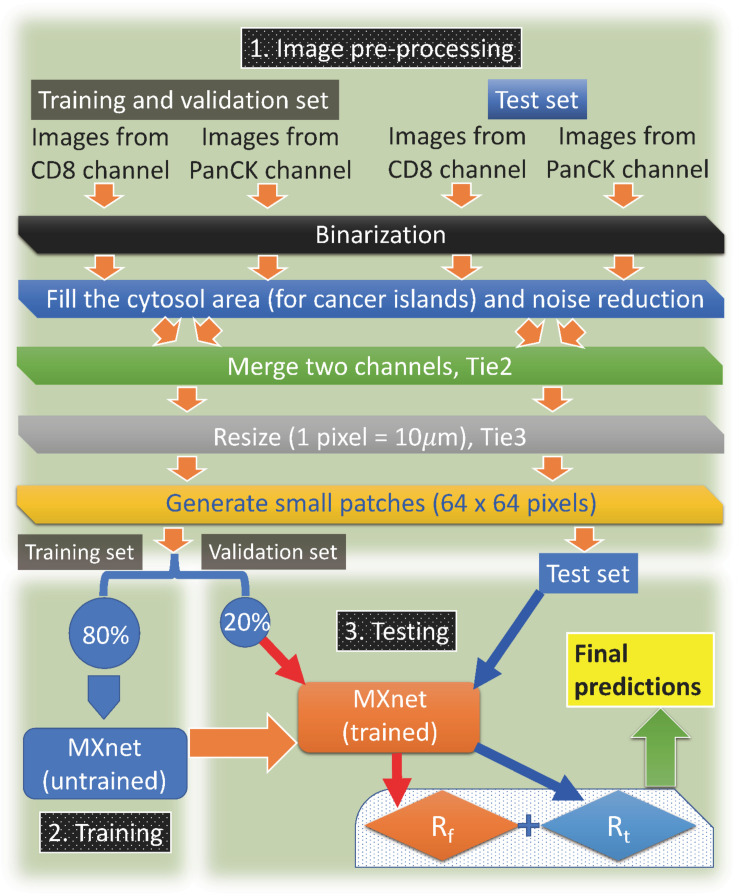
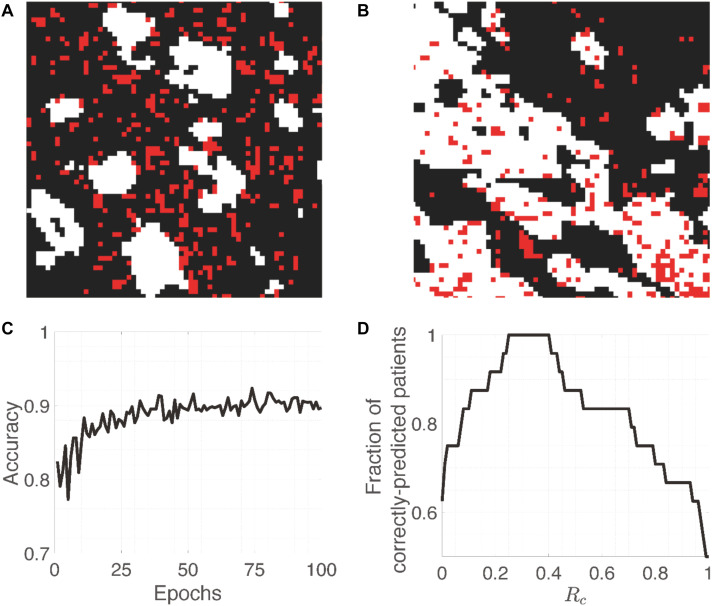
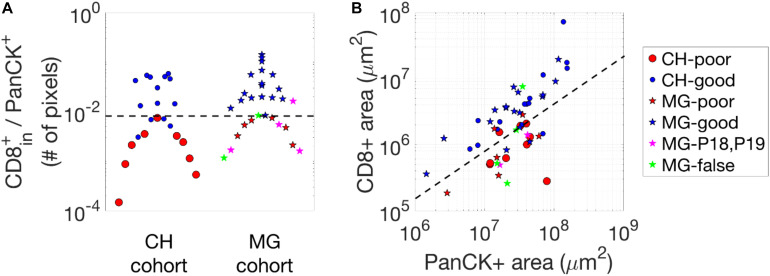
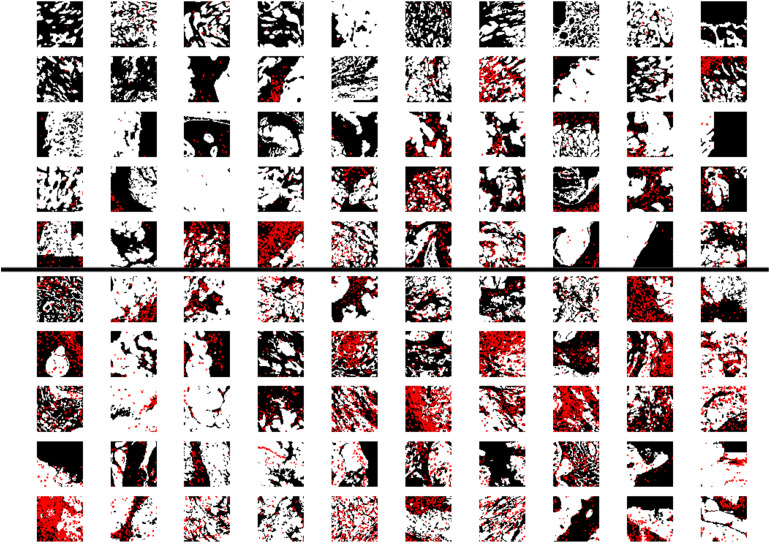
The abundance and/or location of tumor infiltrating lymphocytes (TILs), especially CD8+ T cells, in solid tumors can serve as a prognostic indicator in various types of cancer. However, it is often difficult to select an appropriate threshold value in order to stratify patients into well-defined risk groups. It is also important to select appropriate tumor regions to quantify the abundance of TILs. On the other hand, machine-learning approaches can stratify patients in an unbiased and automatic fashion. Based on immunofluorescence (IF) images of CD8+ T lymphocytes and cancer cells, we develop a machine-learning approach which can predict the risk of relapse for patients with Triple Negative Breast Cancer (TNBC). Tumor-section images from 9 patients with poor outcome and 15 patients with good outcome were used as a training set. Tumor-section images of 29 patients in an independent cohort were used to test the predictive power of our algorithm. In the test cohort, 6 (out of 29) patients who belong to the poor-outcome group were all correctly identified by our algorithm; for the 23 (out of 29) patients who belong to the good-outcome group, 17 were correctly predicted with some evidence that improvement is possible if other measures, such as the grade of tumors, are factored in. Our approach does not involve arbitrarily defined metrics and can be applied to other types of cancer in which the abundance/location of CD8+ T lymphocytes/other types of cells is an indicator of prognosis.
Keywords: immunofluorescence images; machine-learning; relapse prediction; triple negative breast cancer (TNBC); tumor-infiltrating T cells.
Copyright © 2020 Yu, Li, He, Gruosso, Zuo, Souleimanova, Ramos, Omeroglu, Meterissian, Guiot, Yang, Yuan, Park, Lee and Levine.
Figures
Similar articles
-
The CD4/CD8 ratio of tumor-infiltrating lymphocytes at the tumor-host interface has prognostic value in triple-negative breast cancer.Hum Pathol. 2017 Nov;69:110-117. doi: 10.1016/j.humpath.2017.09.012. Epub 2017 Oct 6. Hum Pathol. 2017. PMID: 28993275
-
Significance of Tumor-Infiltrating Lymphocytes and the Expression of Topoisomerase IIα in the Prediction of the Clinical Outcome of Patients with Triple-Negative Breast Cancer after Taxane-Anthracycline-Based Neoadjuvant Chemotherapy.Chemotherapy. 2017;62(4):246-255. doi: 10.1159/000470900. Epub 2017 May 5. Chemotherapy. 2017. PMID: 28472798
-
Tumor-infiltrating lymphocytes and CD8+ T cells predict survival of triple-negative breast cancer.J Cancer Res Clin Oncol. 2019 Dec;145(12):3105-3114. doi: 10.1007/s00432-019-03036-5. Epub 2019 Sep 27. J Cancer Res Clin Oncol. 2019. PMID: 31562550 Free PMC article.
-
Tumor-Infiltrating Lymphocytes in Triple Negative Breast Cancer: The Future of Immune Targeting.Clin Med Insights Oncol. 2016 Apr 5;10(Suppl 1):31-9. doi: 10.4137/CMO.S34540. eCollection 2016. Clin Med Insights Oncol. 2016. PMID: 27081325 Free PMC article. Review.
-
The prognostic value of tumor-infiltrating lymphocytes in triple-negative breast cancer: a meta-analysis.Breast Cancer Res Treat. 2014 Dec;148(3):467-76. doi: 10.1007/s10549-014-3185-2. Epub 2014 Nov 1. Breast Cancer Res Treat. 2014. PMID: 25361613 Review.
Cited by
-
Quantitative Assessment of Tumor-Infiltrating Lymphocytes Using Machine Learning Predicts Survival in Muscle-Invasive Bladder Cancer.J Clin Med. 2022 Nov 29;11(23):7081. doi: 10.3390/jcm11237081. J Clin Med. 2022. PMID: 36498655 Free PMC article.
-
A Review of AI-Based Radiomics and Computational Pathology Approaches in Triple-Negative Breast Cancer: Current Applications and Perspectives.Clin Breast Cancer. 2023 Dec;23(8):800-812. doi: 10.1016/j.clbc.2023.06.004. Epub 2023 Jun 21. Clin Breast Cancer. 2023. PMID: 37380569 Free PMC article. Review.
-
Artificial Intelligence for Precision Oncology of Triple-Negative Breast Cancer: Learning from Melanoma.Cancers (Basel). 2024 Feb 6;16(4):692. doi: 10.3390/cancers16040692. Cancers (Basel). 2024. PMID: 38398083 Free PMC article.
-
The Response of Triple-Negative Breast Cancer to Neoadjuvant Chemotherapy and the Epithelial-Mesenchymal Transition.Int J Mol Sci. 2023 Mar 29;24(7):6422. doi: 10.3390/ijms24076422. Int J Mol Sci. 2023. PMID: 37047393 Free PMC article.
-
A pathomic approach for tumor-infiltrating lymphocytes classification on breast cancer digital pathology images.Heliyon. 2023 Mar 9;9(3):e14371. doi: 10.1016/j.heliyon.2023.e14371. eCollection 2023 Mar. Heliyon. 2023. PMID: 36950640 Free PMC article.
References
-
- Agarap A. F. (2017). On breast cancer detection: an application of machine learning algorithms on the wisconsin diagnostic dataset. arxiv [Preprint], Avaliable at: https://arxiv.org/abs/1711.07831 (accessed December 12, 2018).
-
- Chen T., Li M., Li Y., Lin M., Wang N., Wang M., et al. (2015). MXNet: a flexible and efficient machine learning library for heterogeneous distributed systems. arxiv [Preprint]. Avaliable at: https://arxiv.org/abs/1512.01274 (accessed October 25, 2017).
Grants and funding
LinkOut - more resources
Full Text Sources
Research Materials
Miscellaneous