. 2020 Sep 18:11:530485.
doi: 10.3389/fphys.2020.530485. eCollection 2020.

Hidden Microatelectases Increase Vulnerability to Ventilation-Induced Lung Injury

Affiliations

Hidden Microatelectases Increase Vulnerability to Ventilation-Induced Lung Injury

Karolin Albert et al. Front Physiol. .

Abstract

Mechanical ventilation of lungs suffering from microatelectases may trigger the development of acute lung injury (ALI). Direct lung injury by bleomycin results in surfactant dysfunction and microatelectases at day 1 while tissue elastance and oxygenation remain normal. Computational simulations of alveolar micromechanics 1-day post-bleomycin predict persisting microatelectases throughout the respiratory cycle and increased alveolar strain during low positive end-expiratory pressure (PEEP) ventilation. As such, we hypothesize that mechanical ventilation in presence of microatelectases, which occur at low but not at higher PEEP, aggravates and unmasks ALI in the bleomycin injury model. Rats were randomized and challenged with bleomycin (B) or not (H = healthy). One day after bleomycin instillation the animals were ventilated for 3 h with PEEP 1 (PEEP1) or 5 cmH2O (PEEP5) and a tidal volume of 10 ml/kg bodyweight. Tissue elastance was repetitively measured after a recruitment maneuver to investigate the degree of distal airspace instability. The right lung was subjected to bronchoalveolar lavage (BAL), the left lung was fixed for design-based stereology at light- and electron microscopic level. Prior to mechanical ventilation, lung tissue elastance did not differ. During mechanical ventilation tissue elastance increased in bleomycin-injured lungs ventilated with PEEP = 1 cmH2O but remained stable in all other groups. Measurements at the conclusion of ventilation showed the largest time-dependent increase in tissue elastance after recruitment in B/PEEP1, indicating increased instability of distal airspaces. These lung mechanical findings correlated with BAL measurements including elevated BAL neutrophilic granulocytes as well as BAL protein and albumin in B/PEEP1. Moreover, the increased septal wall thickness and volume of peri-bronchiolar-vascular connective tissue in B/PEEP1 suggested aggravation of interstitial edema by ventilation in presence of microatelectases. At the electron microscopic level, the largest surface area of injured alveolar epithelial was observed in bleomycin-challenged lungs after PEEP = 1 cmH2O ventilation. After bleomycin treatment cellular markers of endoplasmic reticulum stress (p-Perk and p-EIF-2α) were positive within the septal wall and ventilation with PEEP = 1 cmH2O ventilation increased the surface area stained positively for p-EIF-2α. In conclusion, hidden microatelectases are linked with an increased pulmonary vulnerability for mechanical ventilation characterized by an aggravation of epithelial injury.

Keywords: alveolar interdependence; blood-gas barrier; microatelectases; surfactant; ventilation-induced lung injury.


Figures

FIGURE 1
FIGURE 1
The airway opening pressure (Pao) at the expiratory limb of the rodent ventilator were continuously recorded during the mechanical ventilation in n = 3 lungs per experimental group. The graphs illustrate representative examples of the range of Pao for the different study groups. The lower limit represents the PEEP level while the upper limit corresponds to the peak inspiratory pressures. The black arrows indicate pressure increases during recruitment maneuvers (=deep inflations) which were followed by repetitive measurements of tissue elastance using the forced oscillation perturbation (FOT, red arrows). The green arrows indicate recording of pressure controlled pressure volume loops with a stepwise increase of Pao up to a maximum of 30 cmH2O (quasistatic PV-loops). Hence, the second bar is a combination of quasistatic PV-loops and deep inflations. The peak inspiratory pressures increased between the recruitment maneuvers in all study groups but did in none of the recorded datasets exceed 20 cmH2O.
FIGURE 2
FIGURE 2
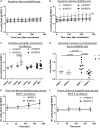
Lung mechanical data. (A) Derecruitability tests at baseline: Tissue Elastance (cmH2O/ml) was measured repetitively after first recruitment maneuver for 10 times before the onset of mechanical ventilation. H1 did not differ between study groups while Hs demonstrated significant Bleomycin effects. The data show that there was no difference present before subjects were assigned to the different ventilation protocols. Mean and standard deviation of at least seven independent measurements per group are given. (B) Shows derecruitability tests during PEEP = 3 cmH2O ventilation after 3 h of mechanical ventilation. Hs was significantly increased in B/PEEP1 compared to the other groups, including B/PEEP5. Mean and standard deviation of at least seven independent measurements per group are given. (C) Compares Hs data before and after mechanical ventilation in the different study groups. A statistical significant increase was only observed in B/PEEP1. (D) The increase in tissue Elastance (ΔH) was calculated from derecruitability tests after mechanical ventilation. Compared to the other groups, a significantly larger ΔH was observed in B/PEEP1. (E) The development of H1 is presented for H/PEEP1 and B/PEEP 1 during mechanical ventilation. Whereas H1 increased significantly (p < 0.05) in B/PEEP1, H1 remained stable in H/PEEP1. The same measurements are shown for H/PEEP5 and B/PEEP5 in panel F, where no increase can be identified in any of study groups. In (E,F) the mean and standard deviation of at least seven independent measurements per group are given. Statistics is based on two-way ANOVA followed by Bonferroni’s post hoc adjustment of the p-value in all graphs except for C where a dependent t-test was used. The level of statistical significance was p < 0.05. Hs: tissue elastance at steady state (mean of last 3 tissue elastance measurement of derecruitability test), H1: first tissue elastance after recruitment, ΔH = Hs–H1.
FIGURE 3
FIGURE 3
Representative toluidine blue stained light microscopic images are shown after airway instillation fixation at low magnification. Septal walls are slim and infiltrates are missing in H with and without mechanical ventilation. Inflammatory cells and thickened inter-alveolar septal walls (arrows) can be seen in B/PEEP1 but not in B/PEEP5.
FIGURE 4
FIGURE 4
Light microscopical stereological data and interstitial edema. (A) The absolute volume of alveolar airspaces (V(alv,par) was reduced in group B compared to group H. Within group B data were lowest in B/PEEP1. (B) Within group B a significant effect of ventilation on arithmetic mean septal wall thickness was observed resulting in an increase in B/PEEP1 compared to B/PEEP5. (C) Bleomycin pre-treatment resulted in an increase in the volume of peri-bronchiolar vascular connective tissue (V(pbvtis,nonpar)). Within group B a significant ventilation effect could be observed resulting in largest values in B/PEEP1 compared to both B/no ventil as well as B/PEEP5. Statistics were made with the use of two-way ANOVA and Bonferroni’s multiple comparisons. (D) High magnification, representative light microscopic images after airway instillation fixation are shown, stained with toluidine blue. Healthy lungs show only marginal peri-bronchiolar-vascular connective tissue (asterisks), whereas B/PEEP1 reveals cellular and edema influx into the non-parenchymal connective tissue compared with all other groups, which is further confirmed by our quantitative measurements in 3C. Also, thickened septal walls were observed in B/PEEP1 (arrows).
FIGURE 5
FIGURE 5
BAL data and intra-alveolar edema. (A) In this figure, the amount of neutrophil granulocytes within the BAL is presented for each group and demonstrates an enormous influx of neutrophil granulocytes into the alveolar space in group B/PEEP1. This influx is statistically significantly higher compared to B/PEEP5 and B/no ventil. (B) The BAL protein concentration in μg/ml is shown. For group B/PEEP1, the protein content is significantly elevated versus B/PEEP5 (p < 0.001) and B (p < 0.001). Furthermore, initially healthy lungs demonstrate a trend for an increased amount of BAL protein level after ventilation with PEEP = 1 cmH2O (H/PEEP1). (C) The concentrations of BAL albumin in μg/ml show a slightly different distribution than the protein measurements but highest albumin concentration can be identified in group B/PEEP1 which differs significantly from B/PEEP5 but not from B/no ventil. Of note, the albumin level is significantly lower in B/PEEP5 compared to B/no ventil. There is a significant difference between H and H/PEEP1 (p = 0.01). (D) Light microscopic images after vascular perfusion fixation at end-inspiratory pressure during PEEP = 1 cmH2O ventilation. Sections were stained with toluidine blue. Microatelectases or alveolar edema are absent in healthy lungs. All Bleomycin-treated lungs demonstrate microatelectatic regions at end-inspiratory status (asterisk). In lungs from group B/PEEP1, alveolar edema fluid in adjacency to microatelectasis can be observed (arrows). Intraalveolar edema is hardly visible in B/PEEP5.
FIGURE 6
FIGURE 6
Injury of alveolar epithelial cells. Representative electron-microscopic images are shown at primary magnification of 11,000×. There is evidence of epithelial injury, like swollen AE1 cells, in most of the experimental groups, except H/No ventil. Regarding B/PEEP1, the injury of the blood-gas barrier was severe, since complete denudations of the epithelial basal lamina (BL) was observed in particular in areas characterized by a widening of the septal walls due to interstitial fluid accumulation (int ed). col, collagen fibrils; IC, interstitial cell; alv, alveolar airspace.
FIGURE 7
FIGURE 7
Stereological data of alveolar epithelial injury. (A) The surface area of basal lamina covered by intact (healthy) AE1 cells (S(AE1_intact,par) was larger in group H compared to group B. Within group B a tendency for reduced values were found in B/PEEP1 compared to B/PEEP5. (B) The surface area of basal lamina covered by injured AE1 cells S(AE1_injured,par) increases in group B compared to group H. This was most pronounced in B/PEEP1 where S(AE1_injured,par) was significantly larger compared to B/no ventil or B/PEEP5. No significant effect of mechanical ventilation was found within H. The surface area of basal lamina covered by healthy (C) or injured AE2 cells S(AE2_intact,par) (D) demonstrates a Bleomycin but no ventilation effect on S(AE2_intact,par).
FIGURE 8
FIGURE 8
Endoplasmic reticulum stress. p-Perk positive cells (arrows), stained by immunohistochemistry, were found in all experimental groups but most profiles of p-Perk positive cells were present in B. There was no clear effect of mechanical ventilation visible.
FIGURE 9
FIGURE 9
Integrated stress response. Immunohistochemistry of p-EIF-2α is shown (arrows). While no staining was seen in H, bleomycin alone resulted in a positive labeling of cells in septal walls and this appears to be aggravated by mechanical ventilation with PEEP = 1 cmH2O in some regions. Qualitatively, p-EIF-2α labeled cells were predominantly found in adjacency to microatelectatic regions.
FIGURE 10
FIGURE 10
Correlation with lung mechanical data. H1 in the last derecruitability test performed after 3 h of mechanical ventilation with PEEP = 1 cmH2O demonstrated strong positive correlations with the volume of peri-bronchiolo-vascular connective tissue (A) and BAL protein content (B) and a negative correlation with the absolute volume of alveolar airspaces in lung parenchyma (V(alv,par)) (C). Hs, referred to as the mean of the last three measurements of H during the derecruitability test at PEEP = 3 cmH2O ventilation performed after the 3 h period of mechanical ventilation, was tested for correlation to the volume of peri-bronchiolo-vascular connective tissue (V(pbvtis,nonpar) (D) and BAL protein concentration (E) and both parameters demonstrated a strong correlation with Hs. Regarding the increase in tissue elastance during the derecruitability test at PEEP = 3 cm H2O ventilation performed after the 3 h period of mechanical ventilation, ΔH, the BAL protein level showed the strongest correlation (F). Hs: tissue elastance at steady state, H1: first tissue elastance after recruitment, ΔH = Hs–H1.

References

    1. Albert K., Krischer J.-M., Knudsen L. (2020). Light and Transmission Electron Microscopic Images for Quantitative Lung Morphology of Mechanichally Ventilated Rat Lungs. [Data set]. Geneva: Zenodo, 10.5281/zenodo.3738928 - DOI
    1. Albert R. K. (2012). The role of ventilation-induced surfactant dysfunction and atelectasis in causing acute respiratory distress syndrome. Am. J. Respir. Crit. Care Med. 185 702–708. 10.1164/rccm.201109-1667pp - DOI - PubMed
    1. Albert R. K., Smith B., Perlman C. E., Schwartz D. A. (2019). Is progression of pulmonary fibrosis due to ventilation-induced lung injury? Am J Respir Crit Care Med. 200 140–151. 10.1164/rccm.201903-0497pp - DOI - PMC - PubMed
    1. Allen G. B., Pavone L. A., DiRocco J. D., Bates J. H., Nieman G. F. (2005). Pulmonary impedance and alveolar instability during injurious ventilation in rats. J. Appl. Physiol. 99 723–730. 10.1152/japplphysiol.01339.2004 - DOI - PubMed
    1. Ashbaugh D. G., Bigelow D. B., Petty T. L., Levine B. E. (1967). Acute respiratory distress in adults. Lancet 2 319–323. - PubMed