. 2020 Sep 22:11:580691.
doi: 10.3389/fmicb.2020.580691. eCollection 2020.

No Assembly Required: Using BTyper3 to Assess the Congruency of a Proposed Taxonomic Framework for the Bacillus cereus Group With Historical Typing Methods

Affiliations

No Assembly Required: Using BTyper3 to Assess the Congruency of a Proposed Taxonomic Framework for the Bacillus cereus Group With Historical Typing Methods

Laura M Carroll et al. Front Microbiol. .

Abstract

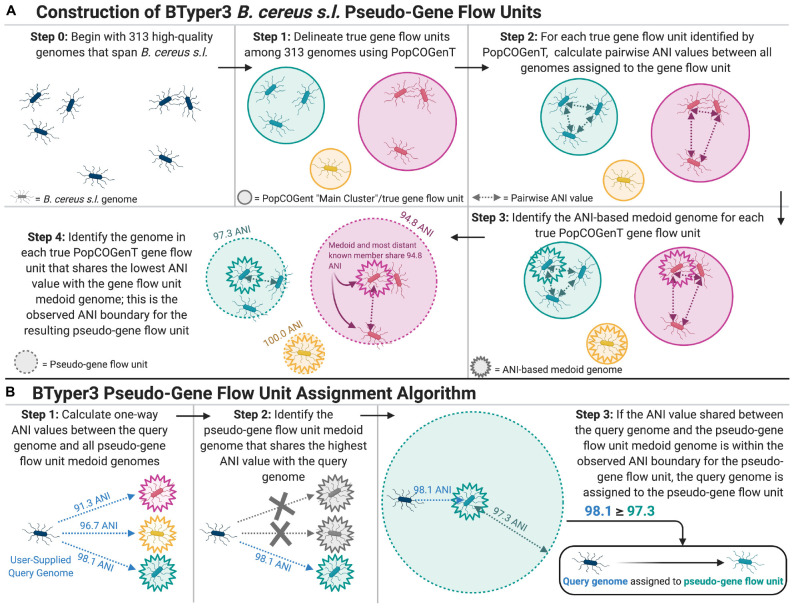
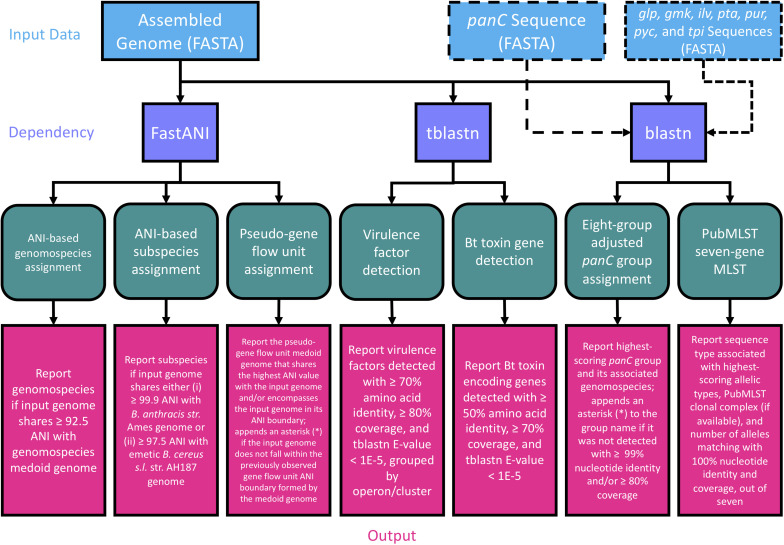
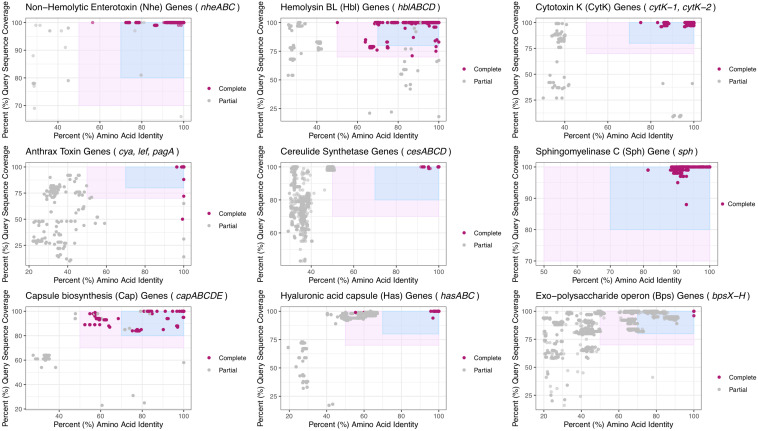
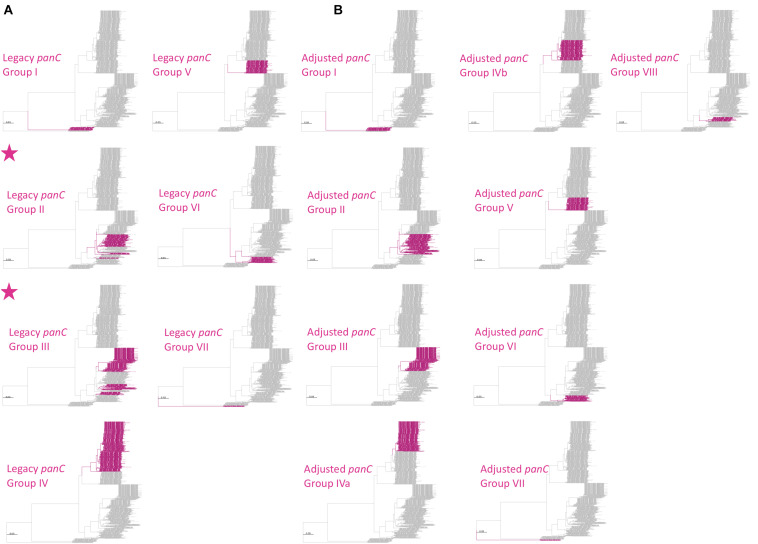
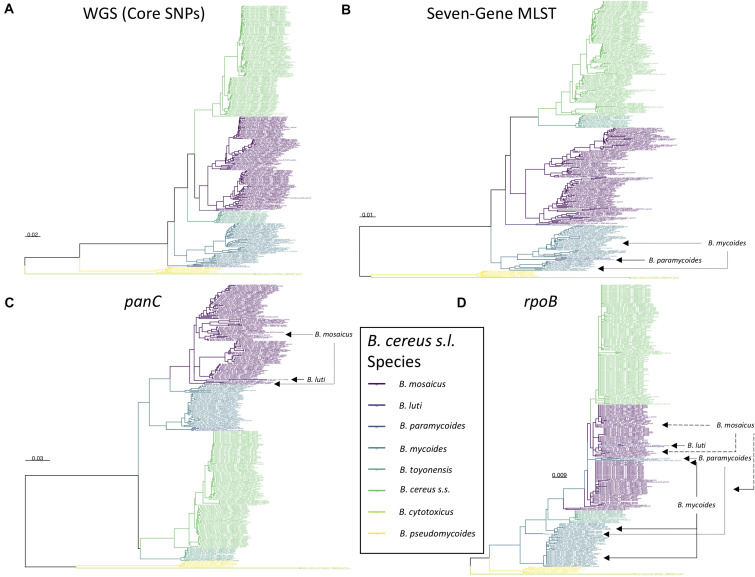
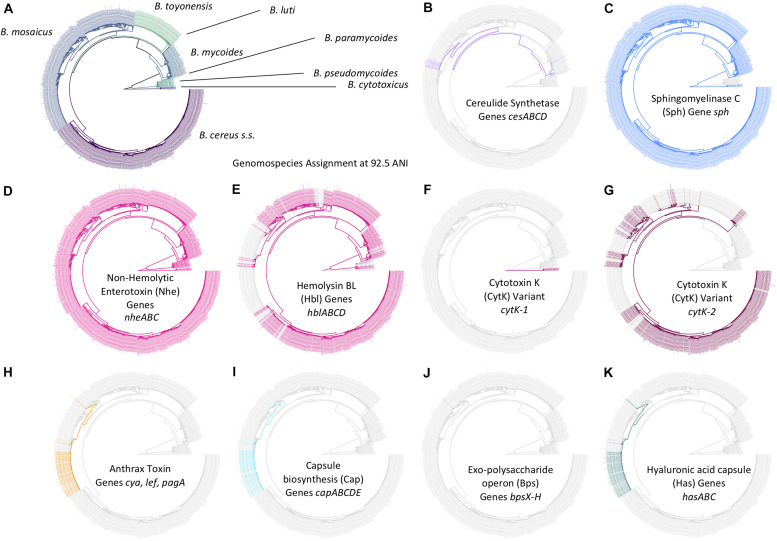
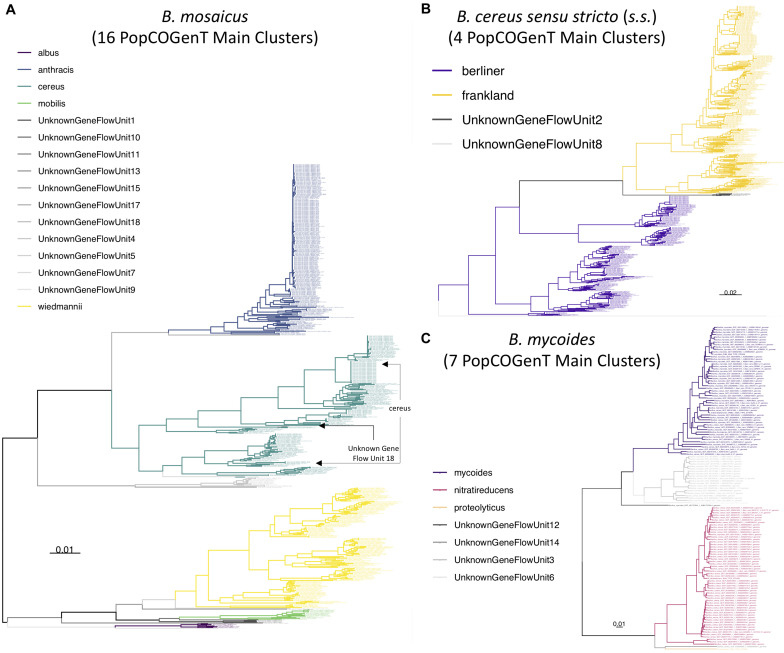
The Bacillus cereus group, also known as B. cereus sensu lato (s.l.), is a species complex comprising numerous closely related lineages, which vary in their ability to cause illness in humans and animals. The classification of B. cereus s.l. isolates into species-level taxonomic units is essential for facilitating communication between and among microbiologists, clinicians, public health officials, and industry professionals, but is not always straightforward. A recently proposed genomospecies-subspecies-biovar taxonomic framework aims to provide a standardized nomenclature for this species complex but relies heavily on whole-genome sequencing (WGS). It thus is unclear whether popular, low-cost typing methods (e.g., single- and multi-locus sequence typing) remain congruent with the proposed taxonomy. Here, we characterize 2,231 B. cereus s.l. genomes using a combination of in silico (i) average-nucleotide identity (ANI)-based genomospecies assignment, (ii) ANI-based subspecies assignment, (iii) seven-gene multi-locus sequence typing (MLST), (iv) single-locus panC group assignment, (v) rpoB allelic typing, and (vi) virulence factor detection. We show that sequence types (STs) assigned using MLST can be used for genomospecies assignment, and we provide a comprehensive list of ST/genomospecies associations. For panC group assignment, we show that an adjusted, eight-group framework is largely, albeit not perfectly, congruent with the proposed eight-genomospecies taxonomy, as panC alone may not distinguish (i) B. luti from Group II B. mosaicus and (ii) B. paramycoides from Group VI B. mycoides. We additionally provide a list of loci that capture the topology of the whole-genome B. cereus s.l. phylogeny that may be used in future sequence typing efforts. For researchers with access to WGS, MLST, and/or panC data, we showcase how our recently released software, BTyper3 (https://github.com/lmc297/BTyper3), can be used to assign B. cereus s.l. isolates to taxonomic units within this proposed framework with little-to-no user intervention or domain-specific knowledge of B. cereus s.l. taxonomy. We additionally outline a novel method for assigning B. cereus s.l. genomes to pseudo-gene flow units within proposed genomospecies. The results presented here highlight the backward-compatibility and accessibility of the recently proposed genomospecies-subspecies-biovar taxonomic framework and illustrate that WGS is not a necessity for microbiologists who want to use the proposed nomenclature effectively.

Keywords: Bacillus anthracis; Bacillus cereus; Bacillus cereus group; Bacillus thuringiensis; multi-locus sequence typing (MLST); single-locus sequence typing (SLST); taxonomy; whole-genome sequencing.


Figures

FIGURE 1
FIGURE 1
(A) Graphical depiction of the methods used to construct B. cereus s.l. pseudo-gene flow units used by BTyper3. The 313 high-quality B. cereus s.l. genomes (Step 0) were medoid genomes identified among a set of 1,741 high-quality B. cereus s.l. genomes at a 99 average nucleotide identity (ANI) threshold using the bactaxR package in R. This step was performed to remove highly similar genomes and reduce the full set of 1,741 high-quality genomes to a smaller set of genomes that encompassed the diversity of B. cereus s.l. in its entirety. Gene flow units delineated using PopCOGenT (Step 1) were the “main clusters” reported by the PopCOGenT module. (B) Graphical depiction of the pseudo-gene flow unit assignment algorithm implemented in BTyper3. Pseudo-gene flow unit medoid genomes (Steps 1–3) are the output of the steps outlined in (A). If a user-supplied query genome does not fall within the observed ANI boundary of the most similar pseudo-gene flow unit medoid genome (Step 3), the second-through-fifth most similar pseudo-gene flow unit medoid genomes are queried. All ANI values were calculated using FastANI. The figure was created with BioRender (https://biorender.com/).
FIGURE 2
FIGURE 2
Flow chart describing the workflow implemented in BTyper3 v. 3.1.0. Input data in FASTA format (blue boxes) can consist of any of the following: (i) a whole genome (complete or draft; can be used with all/all combinations of workflow steps), (ii) a panC sequence (can be used with the eight-group adjusted panC group assignment workflow only), or (iii) sequences of the seven loci used in PubMLST’s seven-gene multi-locus sequence typing (MLST) scheme for B. cereus s.l. (sequences can be in multi-FASTA format, or concatenated into a single sequence; can be used with the PubMLST seven-gene MLST workflow only). Purple boxes represent software dependencies required for each type of input data, while green boxes represent the various analyses that can be conducted in BTyper3 v. 3.1.0. Pink boxes denote the output that BTyper3 v. 3.1.0 reports for each analysis.
FIGURE 3
FIGURE 3
Virulence factors detected in 1,741 high-quality B. cereus s.l. genomes at various minimum percent amino acid identity (X-axes) and query sequence coverage (Y-axes) thresholds. Each subplot denotes a virulence factor composed of one or more genes listed in the subplot title. Points represent the individual genes listed in the subplot title. The light pink rectangle denotes amino acid identity and coverage values at which the original BTyper (BTyper v. 2.3.3 and previous versions) would report a gene as “present” (i.e., 50 and 70% amino acid identity and coverage thresholds, respectively). The blue rectangle denotes the updated virulence factor cutoffs used by BTyper3 v. 3.1.0 (i.e., 70 and 80% amino acid identity and coverage thresholds, respectively). Points shaded in dark pink (i.e., “Complete”) were (i) detected within a B. cereus s.l. genome at the default minimum amino acid identity and coverage thresholds used by the original BTyper (i.e., BTyper v. 2.3.3, at 50 and 70%, respectively), and (ii) were part of a “complete” virulence factor, as listed in the subplot title (i.e., all other genes comprising the virulence factor were detected in the genome at the 50 and 70% minimum amino acid identity and coverage thresholds used by BTyper v. 2.3.3, respectively). Points colored in gray (i.e., “Partial”) denote genes that were not detected at the 50 and 70% minimum amino acid identity and coverage thresholds used by BTyper v. 2.3.3 and/or were part of a virulence factor that was not present in its entirety in the respective genome at 50 and 70% amino acid identity and coverage, respectively. All genes were detected using BTyper3 v. 3.1.0 with a minimum E-value threshold of 1E-5.
FIGURE 4
FIGURE 4
Maximum likelihood phylogeny constructed using panC, extracted from 1,736 high-quality B. cereus s.l. genomes. Branches and tip labels are colored by (A) panC group (I–VII), assigned using the panC group assignment method implemented in the original BTyper v. 2.3.3 (i.e., the “legacy” panC group assignment method), and (B) adjusted panC group assignment (I–VIII), obtained using RhierBAPS Level 1 cluster assignments for panC. For all panC group assignments, the “foreground” panC group is colored (pink) and the background panC groups are shown in gray. Phylogenies for which the foreground panC group (pink) presents as polyphyletic are annotated with a pink star in the upper left corner of the panel. Phylogenies are rooted using the panC sequence of the “B. manliponensis” type strain (omitted for clarity), and branch lengths are reported in substitutions per site. IQ-TREE v. 1.6.5 was used to construct the phylogeny, using the optimal nucleotide substitution model selected using ModelFinder (i.e., the TVM + F + R4 model).
FIGURE 5
FIGURE 5
Maximum likelihood phylogenies constructed using (A) genome-wide core SNPs (WGS), (B) seven concatenated multi-locus sequence typing (MLST) genes, (C) panC, and (D) rpoB identified among 313 high-quality B. cereus s.l. medoid genomes identified at a 99 average nucleotide identity (ANI) threshold. Branches and tip labels are colored by ANI-based genomospecies assignment using the proposed B. cereus s.l. taxonomic framework (i.e., eight genomospecies assigned using medoid genomes and a 92.5 ANI threshold). Polyphyletic genomospecies and the genomospecies interspersed among them are annotated with arrows. Phylogenies are rooted at the midpoint, and branch lengths are reported in substitutions per site. Genomospecies were assigned using BTyper3 v. 3.1.0 and FastANI v. 1.0. For the WGS tree (A), core SNPs were identified among all 313 B. cereus s.l. genomes using kSNP3 v. 3.92 and the optimal k-mer size reported by Kchooser (k = 19). For the MLST, panC, and rpoB trees (B–D, respectively), BTyper v. 2.3.3 was used to extract all loci from the set of 313 B. cereus s.l. genomes, and MAFFT v. 7.453-with-extensions was used to construct an alignment for each locus. For each alignment, IQ-TREE v. 1.5.4 (A) and 1.6.5 (B–D) was used to construct a phylogeny, using either the GTR + G + ASC nucleotide substitution model (A), or the optimal model selected using ModelFinder (B–D).
FIGURE 6
FIGURE 6
(A) Network of Clusters of Orthologous Groups (COG) functional categories assigned to 255 single-copy core genes that topologically mirror the B. cereus s.l. whole-genome phylogeny (Kendall–Colijn P < 0.05 after a Bonferroni correction). Each node corresponds to a COG functional category/group of functional categories assigned to one or more genes. Node size corresponds to the number of genes (out of 255 possible genes) assigned to a functional category/group of functional categories, ranging from one to 58 (for S, function unknown). Edges connect nodes that share one or more functional categories. Nodes of functional categories assigned to 15 or more genes are annotated with a text label denoting the number of genes assigned to the respective functional category. (B) Results of non-metric multidimensional scaling (NMDS) performed using pairwise semantic/functional dissimilarities calculated between 94 single-copy core genes based on their assigned Gene Ontology (GO) Biological Process Ontology (BPO) terms. Points represent individual genes, while shaded regions and convex hulls correspond to clusters of genes identified by GOGO, based on their BPO similarities. For a complete list of annotations associated with each of the 255 single-copy core genes, see Supplementary Table S2. For NMDS plots constructed using Cellular Component Ontology (CCO) and Molecular Function Ontology (MFO) dissimilarities, see Supplementary Figure S24.
FIGURE 7
FIGURE 7
Distribution of selected B. cereus s.l. virulence factors within the B. cereus s.l. phylogeny (n = 1,741). Tip labels and branches within the phylogeny are colored by (A) B. cereus s.l. genomospecies, assigned using medoid genomes obtained at a 92.5 ANI threshold, and (B–K) presence and absence of the denoted B. cereus s.l. virulence factor (colored and gray tip labels, respectively). Virulence factors were detected using BTyper v. 3.1.0, with minimum amino acid identity and coverage thresholds of 70 and 80%, respectively, and a maximum E-value threshold of 1E-5. A virulence factor was considered to be present in a genome if all genes comprising the virulence factor were detected at the aforementioned thresholds; likewise, if one or more genes comprising a virulence factor were not detected at the given thresholds, the virulence factor was considered to be absent. The phylogeny was constructed using core SNPs identified in 79 single-copy orthologous gene clusters present among all 2,231 B. cereus s.l. genomes available in NCBI’s RefSeq database (accessed 19 November 2018; see Carroll et al., 2020b, for detailed methods) (Carroll et al., 2020b). The type strain of “B. manliponensis” (i.e., the most distantly related member of the group) was treated as an outgroup on which the phylogeny was rooted. Tips representing genomes that (i) did not meet the quality thresholds and/or (ii) were not assigned to one of eight published genomospecies (i.e., genomes of unpublished, proposed, or effective B. cereus s.l. species) were omitted.
FIGURE 8
FIGURE 8
Maximum likelihood phylogenies constructed using genome-wide core SNPs identified among all high-quality genomes assigned to each of the (A) B. mosaicus, (B) B. cereus sensu stricto (s.s.), and (C) B. mycoides genomospecies delineated at a 92.5 ANI threshold. Branches and tip labels are colored by pseudo-gene flow unit assignment using the pseudo-gene flow unit assignment algorithm implemented in BTyper3 v. 3.1.0 (Figures 1, 2). Only genomes that fell within the observed ANI boundary for each pseudo-gene flow unit are shown. Arrows are used to annotate polyphyletic pseudo-gene flow units derived from “true” gene flow units that also presented as polyphyletic (Supplementary Figure S25); the pseudo-gene flow units interspersed among them are additionally annotated with arrows. Phylogenies are rooted at the midpoint, and branch lengths are reported in substitutions per site. Genomospecies and pseudo-gene flow units were assigned using BTyper3 v. 3.1.0 and FastANI v. 1.0. For each phylogeny, core SNPs were identified among all high-quality genomes assigned to the genomospecies using kSNP3 v. 3.92 and the optimal k-mer size reported by Kchooser (k = 19 or 21). For each core SNP alignment, IQ-TREE v. 1.5.4 was used to construct a phylogeny, using the GTR + G + ASC nucleotide substitution model.

Similar articles

Cited by

References

    1. Acevedo M. M., Carroll L. M., Mukherjee M., Mills E., Xiaoli L., Dudley E. G., et al. (2019). Bacillus clarus sp. nov. is a new Bacillus cereus group species isolated from soil. bioRxiv [Preprint]. 10.1101/508077 - DOI - PubMed
    1. Akamatsu R., Suzuki M., Okinaka K., Sasahara T., Yamane K., Suzuki S., et al. (2019). Novel Sequence Type in Bacillus cereus strains associated with nosocomial infections and bacteremia, Japan. Emerg. Infect. Dis 25 883–890. 10.3201/eid2505.171890 - DOI - PMC - PubMed
    1. Angiuoli S. V., Salzberg S. L. (2011). Mugsy: fast multiple alignment of closely related whole genomes. Bioinformatics 27 334–342. 10.1093/bioinformatics/btq665 - DOI - PMC - PubMed
    1. Antonation K. S., Grutzmacher K., Dupke S., Mabon P., Zimmermann F., Lankester F., et al. (2016). Bacillus cereus Biovar anthracis causing anthrax in sub-saharan Africa-chromosomal monophyly and broad geographic distribution. PLoS Negl. Trop. Dis. 10:e0004923. 10.1371/journal.pntd.0004923 - DOI - PMC - PubMed
    1. Arevalo P., Vaninsberghe D., Elsherbini J., Gore J., Polz M. F. (2019). A reverse ecology approach based on a biological definition of microbial populations. Cell 178:e814. 10.1016/j.cell.2019.06.033 - DOI - PubMed

LinkOut - more resources