. 2020 Sep 25:11:2015.
doi: 10.3389/fimmu.2020.02015. eCollection 2020.

Trichinella spiralis Thioredoxin Peroxidase 2 Regulates Protective Th2 Immune Response in Mice by Directly Inducing Alternatively Activated Macrophages

Affiliations

Trichinella spiralis Thioredoxin Peroxidase 2 Regulates Protective Th2 Immune Response in Mice by Directly Inducing Alternatively Activated Macrophages

Qi-Wang Jin et al. Front Immunol. .

Abstract

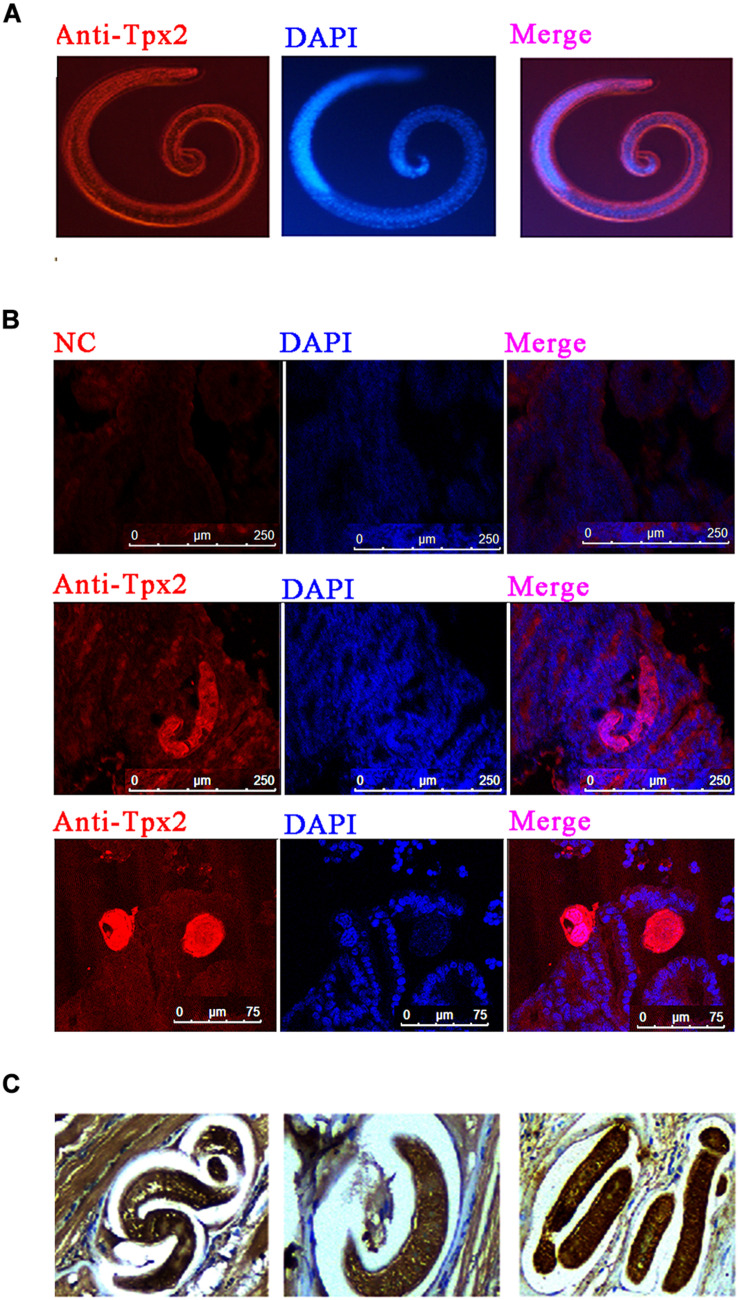
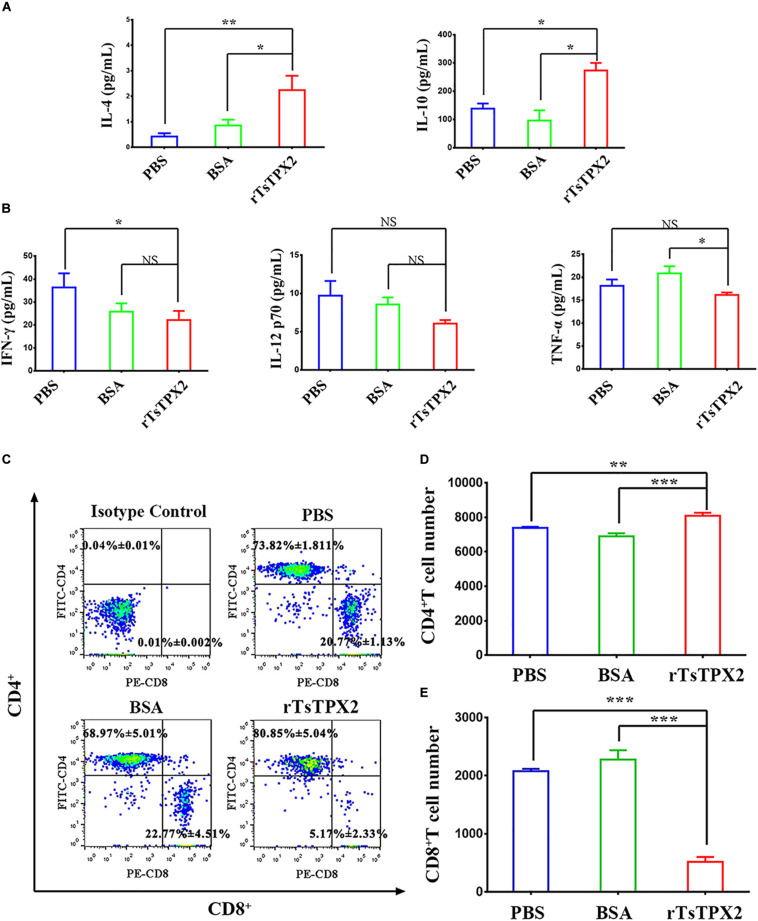
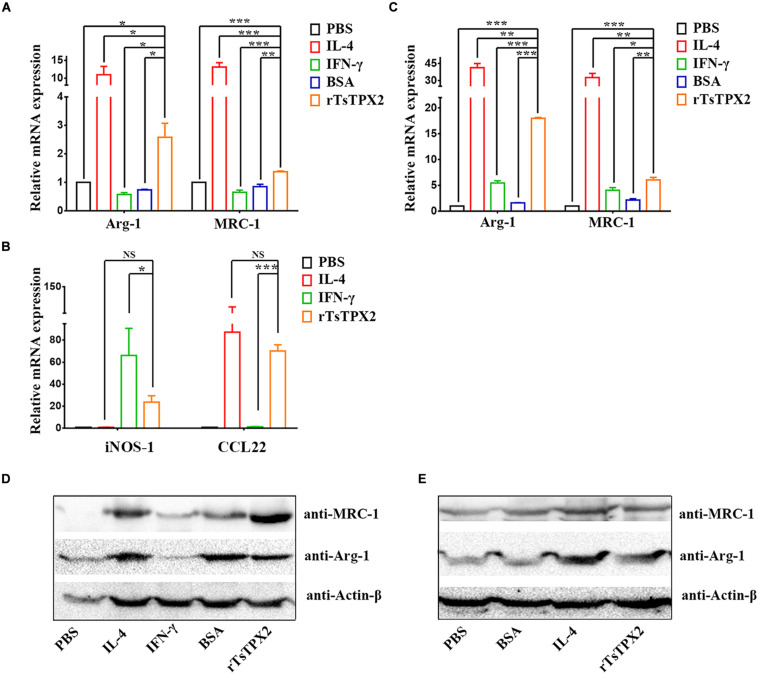
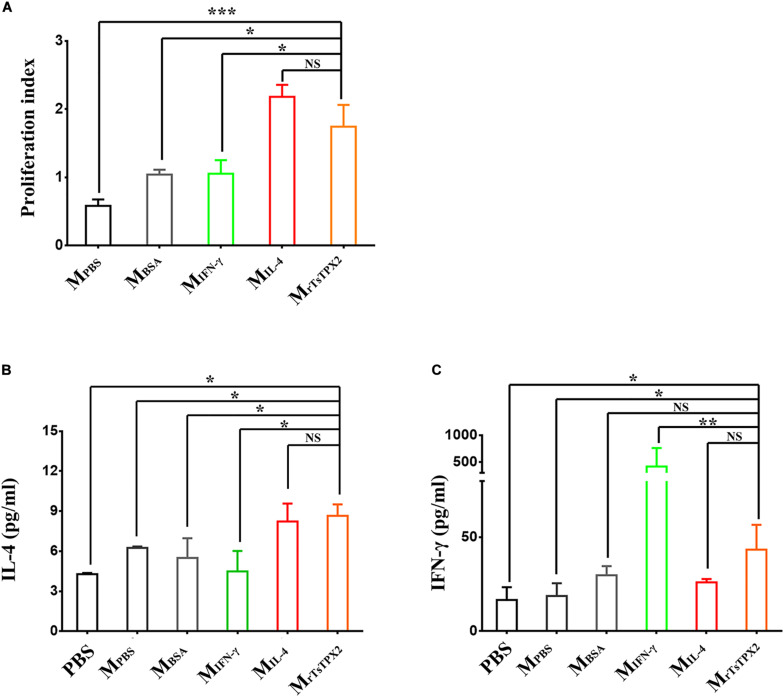
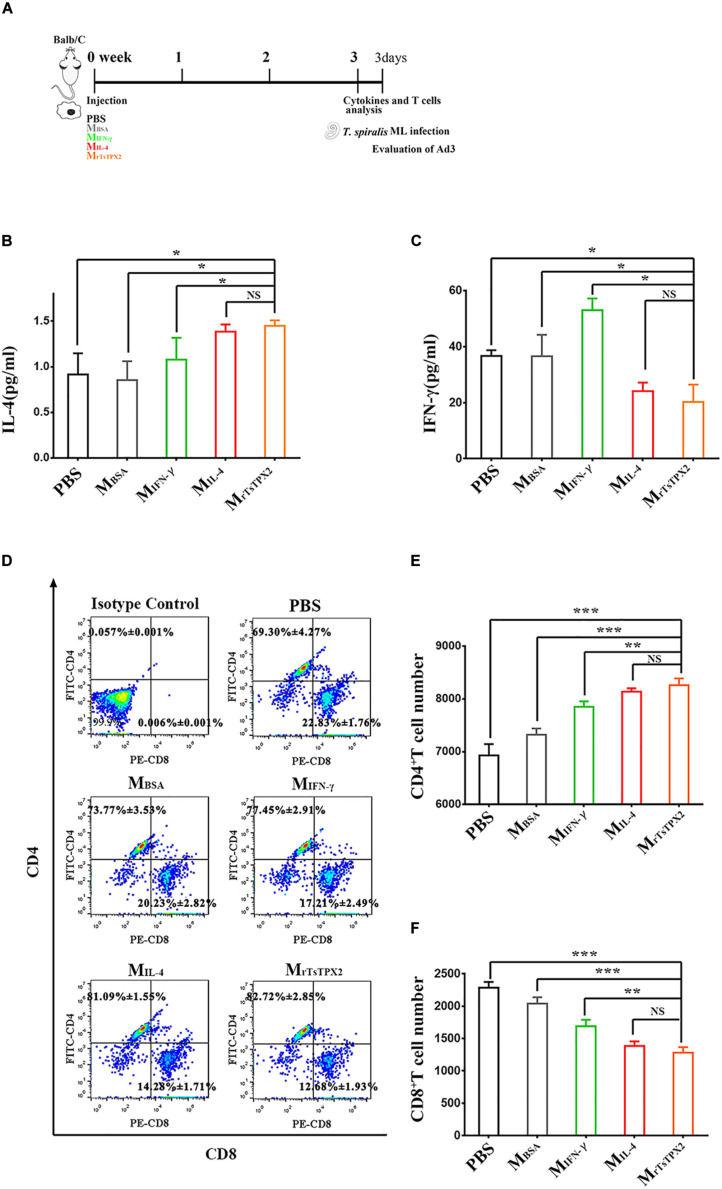
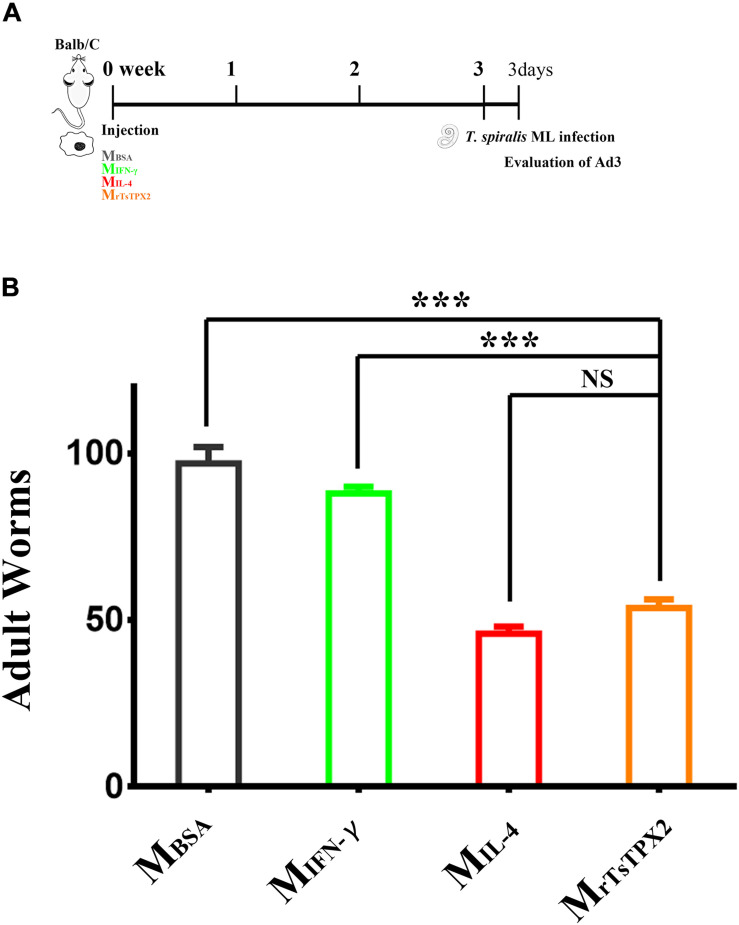
Trichinella infection can induce macrophages into the alternatively activated phenotype, which is primarily associated with the development of a polarized Th2 immune response. In the present study, we examined the immunomodulatory effect of T. spiralis thioredoxin peroxidase-2 (TsTPX2), a protein derived from T. spiralis ES products, in the regulation of Th2 response through direct activation of macrophages. The location of TsTPX2 was detected by immunohistochemistry and immunofluorescence analyses. The immune response in vivo induced by rTsTPX2 was characterized by analyzing the Th2 cytokines and Th1 cytokines in the peripheral blood. The rTsTPX2-activated macrophages (MrTsTPX2) were tested for polarization, their ability to evoke naïve CD4+ T cells, and resistance to the larval infection after adoptive transfer in BALB/c mice. The immunolocalization analysis showed TsTPX2 in cuticles and stichosome of T. spiralis ML. The immunostaining was detected in cuticles and stichosome of T. spiralis Ad3 and ML, as well as in tissue-dwellings around ML after the intestines and muscle tissues of infected mice were incubated with anti-rTsTPX2 antibody. Immunization of BALB/c mice with rTsTPX2 could induce a Th1-suppressing mixed immune response given the increased levels of Th2 cytokines (IL-4 and IL-10) production along with the decreased levels of Th1 cytokines (IFN-γ, IL-12, and TNF-α). In vitro studies showed that rTsTPX2 could directly drive RAW264.7 and peritoneal macrophages to the M2 phenotype. Moreover, MrTsTPX2 could promote CD4+ T cells polarized into Th2 type in vitro. Adoptive transfer of MrTsTPX2 into mice suppressed Th1 responses by enhancing Th2 responses and exhibited a 44.7% reduction in adult worm burden following challenge with T. spiralis infective larval, suggesting that the TsTPX2 is a potential vaccine candidate against trichinosis. Our study showed that TsTPX2 would be at least one of the molecules to switch macrophages into the M2 phenotype during T. spiralis infection, which provides a new therapeutic approach to various inflammatory disorders like allergies or autoimmune diseases.

Keywords: Th2 immune responses; Trichinella spiralis; alternative activation; macrophage; thioredoxin peroxidase-2.


Figures

FIGURE 1
FIGURE 1
Immunolocalization of TPX2 at different T. spiralis phases. (A) Immunofluorescence of TsTPX2 in muscle larvae (ML) at 35 dpi. (B) Immunofluorescence of TPX2 in adult worms at 3 days. (C) Immunohistochemistry of TsTPX2 in ML at 35 dpi.
FIGURE 2
FIGURE 2
rTsTPX2 inhibits Th1 responses in mice. (A) The levels of Th2 cytokines in sera from mice detected by ELISA. (B) The levels of Th1 cytokines in sera from mice detected by ELISA. (C) Analysis of CD3+CD4+CD8 and CD3+CD8+CD4 T lymphocytes. The number on the representative contour plots showing the ratio of each subset out of peripheral lymphocytes. (D) The total number of CD3+CD4+CD8 T cells in blood from mice. (E) The total number of CD3+CD8+CD4 T cells in blood from mice. Experimental groups include mice challenged with PBS as a negative control, BSA as mock control, or rTsTPX2. Statistical analysis was performed with Student’s t-test, and data are mean ± SDs (representative of three experiments). ***P < 0.001, **0.001 < P < 0.01, *0.01 < P < 0.05. n >= 5 mice per group.
FIGURE 3
FIGURE 3
The phenotype of macrophages induced in vitro. (A–E) The expressions of M1 and M2 markers were analyzed by both qRT-PCR (A–C) and Western Blotting (D,E). (A,B) Analysis of the expression of Arg-1 MRC-1, iNOS-1 and CCL22 genes in RAW264.7 co-cultured with various stimuli by qPCR. (C) Analysis of the expression of Arg-1 and MRC-1 genes in peritoneal macrophages isolated from healthy BALB/c mice after co-cultured with various stimuli by qPCR. (D,E) Analysis of the expression of Arg-1 and MRC-1 genes in RAW264.7 and peritoneal macrophages after co-cultured with various stimuli by Western Blotting. Experimental groups include macrophages stimulated with PBS as blank control, IL-4 as M2 positive control, INF-γ as M1 positive control, BSA as mock control or rTsTPX2. Statistical analysis was performed with Student’s t-test, and data are presented as mean ± SDs (representative of three experiments). ***P < 0.001, **0.001 < P < 0.01, *0.01 < P < 0.05. n >= 5 mice per group.
FIGURE 4
FIGURE 4
The differentiation and proliferation of CD4+ T cells induced by macrophages. (A) The proliferation index of CD4+ T cells induced by macrophages at 72 h after co-culture, measured by MTs kit. (B) Levels of IL-4 production in supernatant of CD4+ T cells co-cultured with macrophages. (C) Levels of IFN-γ production in supernatant of CD4+ T cells co-cultured with macrophages. CD4+ T cells isolated from healthy BALB/c mice co-cultured with macrophages induced by various stimuli, including PBS as blank control (MPBS), IL-4 as M2 positive control (MIL–4), INF-γ as M1 positive control (MINF–γ), BSA as mock control (MBSA) or rTsTPX2 (MrTsTPX2). The experimental group PBS representative CD4+ T cells dealing with PBS. Statistical analysis was performed with Student’s t-test, and data are presented as mean ± SDs (representative of three experiments). ***P < 0.001, **0.001 < P < 0.01, *0.01 < P < 0.05, NS, not significant. n >= 3 mice per group.
FIGURE 5
FIGURE 5
The type of immune responses in mice adoptively transferred with macrophages. (A) Schematics of immune responses in mice adoptively transferred with one of the macrophage types. Three weeks after the first injection, the immunological status was analyzed, and mice were experimentally infected with 500 T. spiralis ML. Analysis of adult load at 3 days after infection. (B) Levels of IL-4 production in sera from mice transferred with various macrophage types. (C) Levels of IFN-γ production in sera from mice transferred with various macrophage types. (D) Analysis of CD3+CD4+CD8 and CD3+CD8+CD4 T lymphocytes. The number on the representative contour plots showing the ratio of each subset out of peripheral lymphocytes. (E) The total number of CD3+CD4+CD8 T cells in blood from mice. (F) The total number of CD3+CD8+CD4 T cells in blood from mice. Experimental groups include mice transferred with macrophages activation by IL-4 as M2 positive control (MIL–4), INF-γ as M1 positive control (MINF–γ), BSA as mock control (MBSA) or rTsTPX2 (MrTsTPX2). The experimental group, PBS representative mice, injected with PBS. Statistical analysis was performed with Student’s t-test, and data are presented mean ± SDs (representative of three experiments). ***P < 0.001, **0.001 < P < 0.01, *0.01 < P < 0.05, NS, not significant. n >= 3 mice per group.
FIGURE 6
FIGURE 6
Numbers of 3-day adults from the macrophages transferred mice. (A) Schematics of immune responses in mice adoptively transferred with one of the macrophage types. Three weeks after the first injection, the immunological status was analyzed, and mice were experimentally infected with 500 T. spiralis ML. Analysis of adult load at 3 days after infection. (B) Adult load in the intestine of mice. Experimental groups include mice transferred with macrophages activation by IL-4 as M2 positive control (MIL–4), INF-γ as M1 positive control (MINF–γ), BSA as mock control (MBSA) or rTsTPX2 (MrTsTPX2). Statistical analysis was performed with Student’s t-test, and data presented are mean ± SDs (representative of three experiments). ***P < 0.001, NS: not significant. n >= 3 mice per group.

Similar articles

Cited by

References

    1. Pozio E. World distribution of Trichinella spp. infections in animals and humans. Vet Parasitol. (2007) 149:3–21. 10.1016/j.vetpar.2007.07.002 - DOI - PubMed
    1. Mitreva M, Jasmer DP. Biology and genome of Trichinella spiralis. Wormbook. (2006) 23:1–21. 10.1895/wormbook.1.124.1 - DOI - PMC - PubMed
    1. Ilic N, Gruden-Movsesijan A, Sofronic-Milosavljevic L. Trichinella spiralis: shaping the immune response. Immunol Res. (2012) 52:111–9. 10.1007/s12026-012-8287-5 - DOI - PubMed
    1. Ashour DS. Trichinella spiralis immunomodulation: an interactive multifactorial process. Expert Rev Clin Immunol. (2013) 9:669–75. 10.1586/1744666X.2013.811187 - DOI - PubMed
    1. Grencis RK. Th2-mediated host protective immunity to intestinal nematode infections. Philos Trans R Soc Lond B Biol Sci. (1997) 352:1377–84. 10.1098/rstb.1997.0123 - DOI - PMC - PubMed

Publication types