. 2020 Sep 24:11:2119.
doi: 10.3389/fimmu.2020.02119. eCollection 2020.

Prokineticin Receptor Inhibition With PC1 Protects Mouse Primary Sensory Neurons From Neurotoxic Effects of Chemotherapeutic Drugs in vitro

Affiliations

Prokineticin Receptor Inhibition With PC1 Protects Mouse Primary Sensory Neurons From Neurotoxic Effects of Chemotherapeutic Drugs in vitro

Giorgia Moschetti et al. Front Immunol. .

Abstract

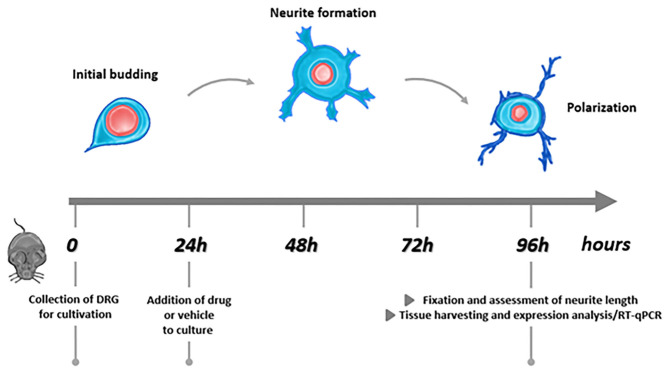
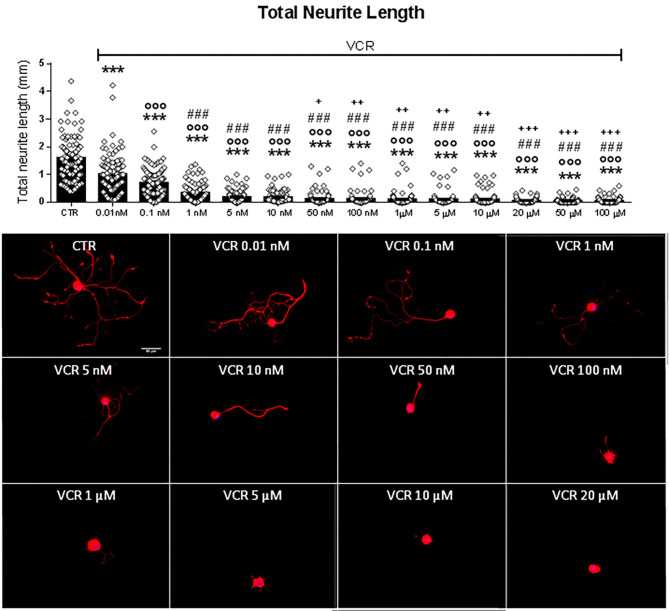
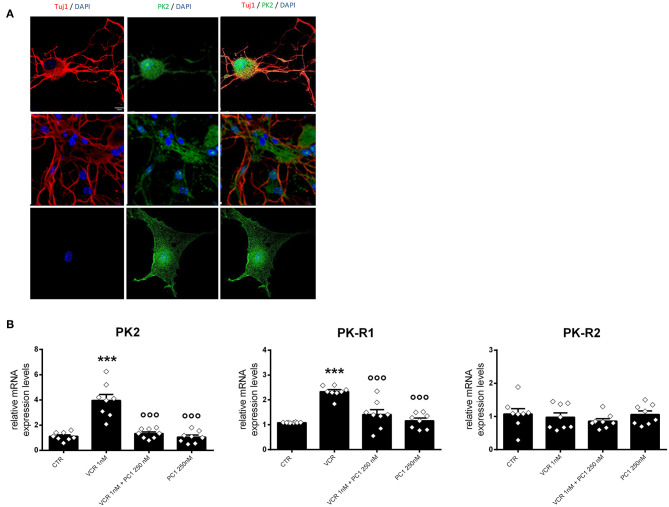
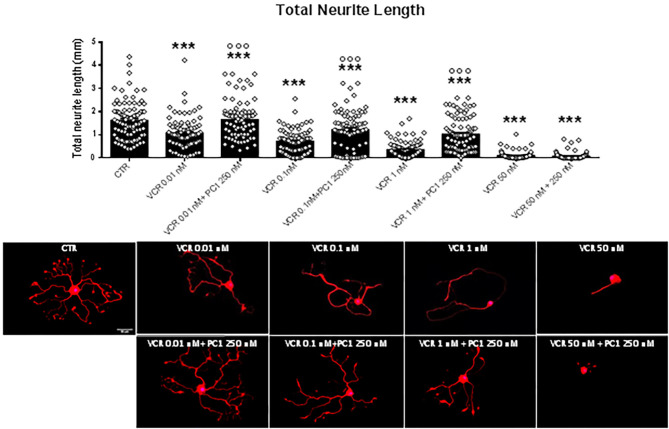
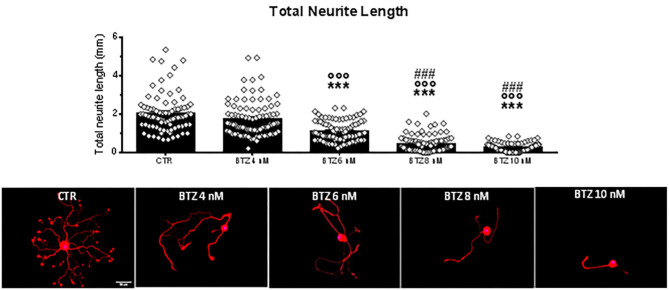
Neurotoxicity is a common side effect of chemotherapeutics that often leads to the development of chemotherapy-induced peripheral neuropathy (CIPN). The peptide Prokineticin 2 (PK2) has a key role in experimental models of CIPN and can be considered an insult-inducible endangering mediator. Since primary afferent sensory neurons are highly sensitive to anticancer drugs, giving rise to dysesthesias, the aim of our study was to evaluate the alterations induced by vincristine (VCR) and bortezomib (BTZ) exposure in sensory neuron cultures and the possible preventive effect of blocking PK2 signaling. Both VCR and BTZ induced a concentration-dependent reduction of total neurite length that was prevented by the PK receptor antagonist PC1. Antagonizing the PK system also reduced the upregulation of PK2, PK-R1, TLR4, IL-6, and IL-10 expression induced by chemotherapeutic drugs. In conclusion, inhibition of PK signaling with PC1 prevented the neurotoxic effects of chemotherapeutics, suggesting a promising strategy for neuroprotective therapies against the sensory neuron damage induced by exposure to these drugs.

Keywords: DRG; chemotherapy; neurons; neurotoxicity; prokineticins.


Figures

Figure 1
Figure 1
Experimental protocol.
Figure 2
Figure 2
Quantification of total neurite length of DRG primary sensory neurons treated in vitro with the vehicle (CTR) or with the following VCR concentrations: 0.01, 0.1, 1, 5, 10, 50, and 100 nM and 1, 5, 10, 20, 50, and 100 μM. In the same figure are reported representative images of β3-tubulin (red) staining in DRG cell cultures. Cell nuclei were counterstained with DAPI (blue). Scale bar = 50 μm. Data are presented as mean ± SEM, n ≥ 80 cells obtained from four independent experiments. One-way ANOVA followed by Bonferroni's post-test. ***p < 0.001 vs. CTR; °°°p < 0.001 vs. VCR 0.01 nM; ###p < 0.001 vs. VCR 0.1 nM; +p < 0.05, ++p < 0.01, +++p < 0.001 vs. VCR 1 nM.
Figure 3
Figure 3
(A) Shows representative images of β3-tubulin (Tuj1; red), PK2 (green), and DAPI (blue) signal in vehicle-treated DRG cell cultures. Scale bar = 10 μm. (B) represents the expression levels of PK2, PK-R1, and PK-R2 that were measured in DRG cultures treated with vehicle (CTR), VCR 1 nM alone, or in combination with PC1 250 nM (VCR + PC1) and PC1 250 nM without the chemotherapeutic agent. mRNA levels, determined by RT-qPCR, were expressed in relation to GAPDH and presented as fold increases over the levels of CTR condition (relative mRNA expression levels). Data are presented as mean ± SEM of eight cultures obtained from eight animals. Statistical analysis was performed by means of one-way ANOVA followed by Bonferroni's post-test. ***p < 0.001 vs. CTR; °°°p < 0.001 vs. VCR 1 nM.
Figure 4
Figure 4
Expression levels of TLR4 (A), IL-1β (B), IL-6 (C), TNF-α (D), IL-10 (E), GFAP (F), and ATF3 (G), measured in DRG cell cultures treated with vehicle, VCR 1 nM alone, or in association with PC1 250 and PC1 250 nM without the chemotherapeutic agent. mRNA levels, determined by RT-qPCR, were expressed in relation to GAPDH and presented as fold increases over the levels of CTR condition (relative mRNA expression levels). Data are the mean ± SEM of eight cultures obtained from eight mice. Statistical analysis was performed by means of one-way ANOVA followed by Bonferroni's post-test. *p < 0.05, **p < 0.01, ***p < 0.001 vs. CTR; °p < 0.05, °°p < 0.01, °°°p < 0.001 vs. VCR 1 nM.
Figure 5
Figure 5
Quantification of total neurite length of DRG primary sensory neurons, when the PK-Rs antagonist was in vitro administered in combination with different VCR nanomolar concentrations (0.01, 0.1, 1, and 50 nM). In the same figure are reported representative images of β3-tubulin (Tuj1; red) staining in DRG cell cultures. Cell nuclei were counterstained with DAPI (blue). Scale bar = 50 μm. Mean ± SEM, n ≥ 80 cells obtained from four independent experiments. One-way ANOVA followed by Bonferroni's post-test. ***p < 0.001 vs. CTR; °°°p < 0.001 vs. VCR relative dose.
Figure 6
Figure 6
Quantification of total neurite length of DRG primary sensory neurons exposed in vitro to the vehicle (CTR) and 4 nanomolar doses of BTZ. In the same figure are reported representative pictures of β3-tubulin (Tuj1; red) staining in DRG cell cultures treated in vitro with the vehicle (CTR) or with the following BTZ concentrations: 4, 6, 8, and 10 nM. Cell nuclei were counterstained with DAPI (blue). Scale bar = 50 μm. Data are presented as mean ± SEM, n ≥ 80 cells obtained from four independent experiments. One-way ANOVA followed by Bonferroni's post-test. ***p < 0.001 vs. CTR; °°°p < 0.001 vs. BTZ 4 nM; p < 0.001 vs. BTZ 6 nM.
Figure 7
Figure 7
Quantification of total neurite length of CTR cells and the effect of different doses (50 nM, 100 nM, 250 nM, 500 nM, and 1 μM) of the PK-Rs antagonist PC1 on DRG primary sensory neurons outgrowth, in vitro administered alone (A) or in combination with BTZ 6 nM (B). In the same figure are reported representative images of β3-tubulin (Tuj1; red) staining in DRG cell cultures exposed to the vehicle (CTR), BTZ 6 nM, and BTZ 6 nM in combination with PC1 50 nM, PC1 100 nM, PC1 250 nM, PC1 500 nM, and PC1 1 μM. Cell nuclei were counterstained with DAPI (blue). Scale bar = 50 μm. Data are presented as mean ± SEM, n ≥ 80 cells obtained from four independent experiments. One-way ANOVA followed by Bonferroni's post-test. ***p < 0.001 vs. CTR; °°p < 0.01, °°°p < 0.001 vs. BTZ 6 nM.

Similar articles

Cited by

References

    1. Colvin LA. Chemotherapy-induced peripheral neuropathy: where are we now? Pain. (2019) 160 (Suppl. 1):S1–10. 10.1097/j.pain.0000000000001540 - DOI - PMC - PubMed
    1. Boyette-Davis JA, Hou S, Abdi S, Dougherty PM. An updated understanding of the mechanisms involved in chemotherapy-induced neuropathy. Pain Manag. (2018) 8:363–75. 10.2217/pmt-2018-0020 - DOI - PMC - PubMed
    1. Flatters S, Dougherty PM, Colvin LA. Clinical and preclinical perspectives on Chemotherapy-Induced Peripheral Neuropathy (CIPN): a narrative review. Br J Anaesth. (2017) 119:737–49. 10.1093/bja/aex229 - DOI - PubMed
    1. Boyette-Davis JA, Walters ET, Dougherty PM. Mechanisms involved in the development of chemotherapy-induced neuropathy. Pain Manag. (2015) 5:285–96. 10.2217/pmt.15.19 - DOI - PMC - PubMed
    1. Han Y, Smith MT. Pathobiology of cancer chemotherapy-induced peripheral neuropathy (CIPN). Front Pharmacol. (2013) 4:156. 10.3389/fphar.2013.00156 - DOI - PMC - PubMed

Publication types

MeSH terms