. 2020 Sep 24:11:559113.
doi: 10.3389/fimmu.2020.559113. eCollection 2020.

The Dynamics of the Ferret Immune Response During H7N9 Influenza Virus Infection

Affiliations

The Dynamics of the Ferret Immune Response During H7N9 Influenza Virus Infection

William S J Horman et al. Front Immunol. .

Abstract

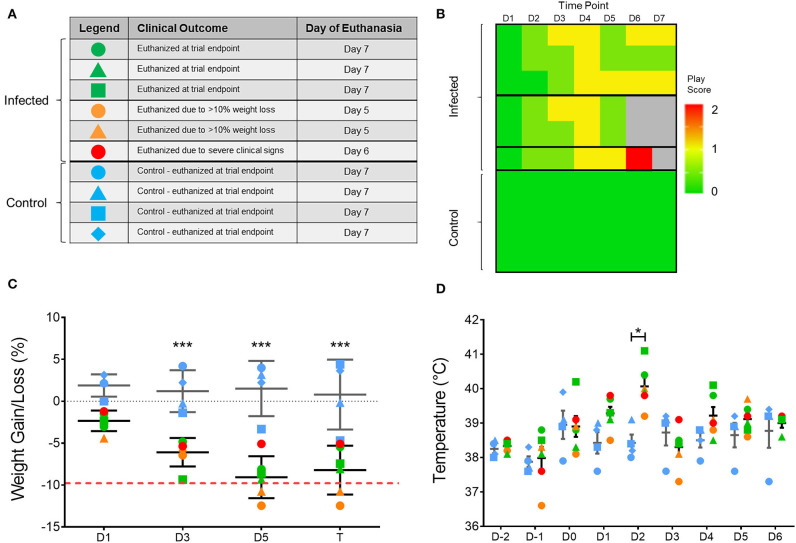
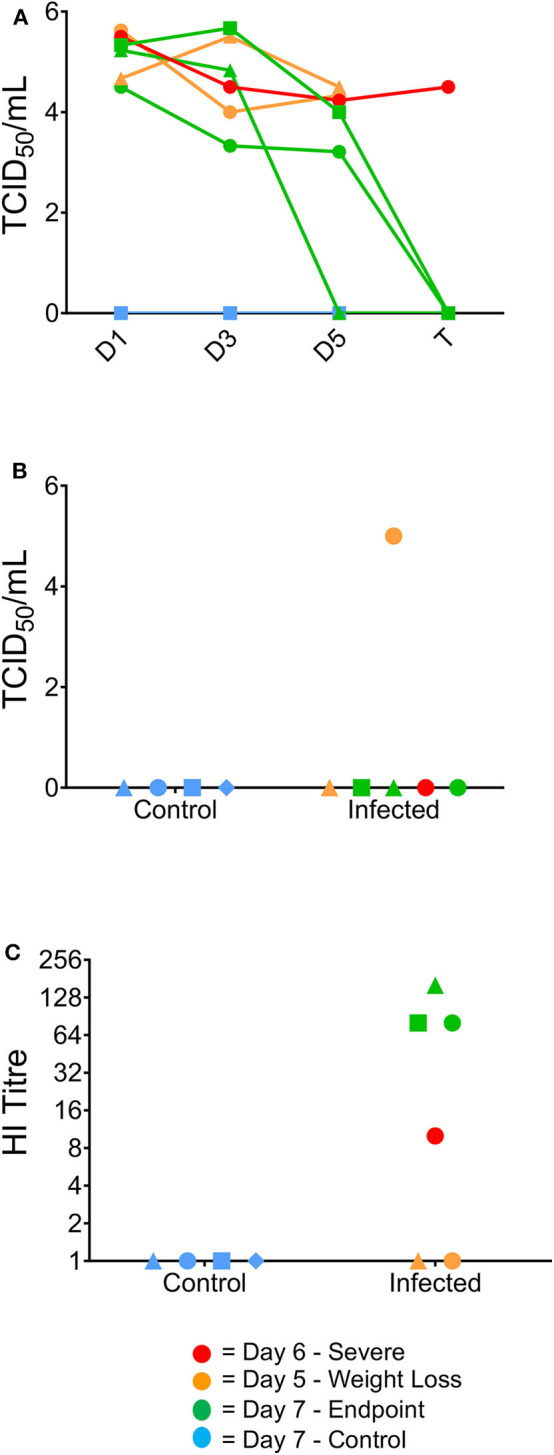
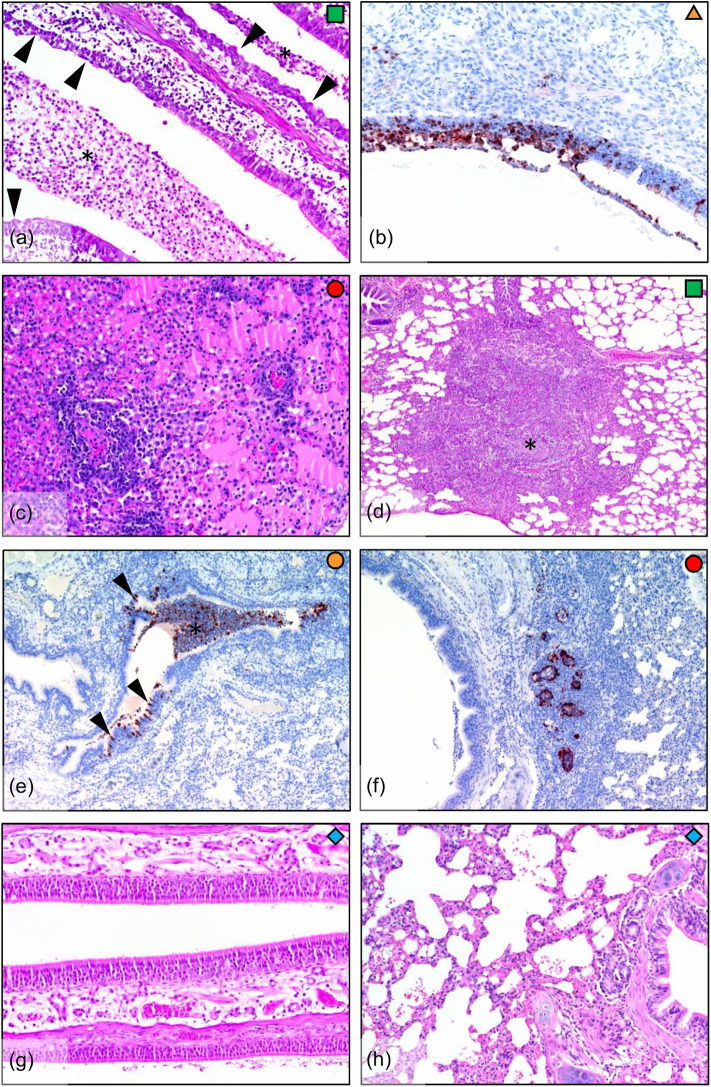
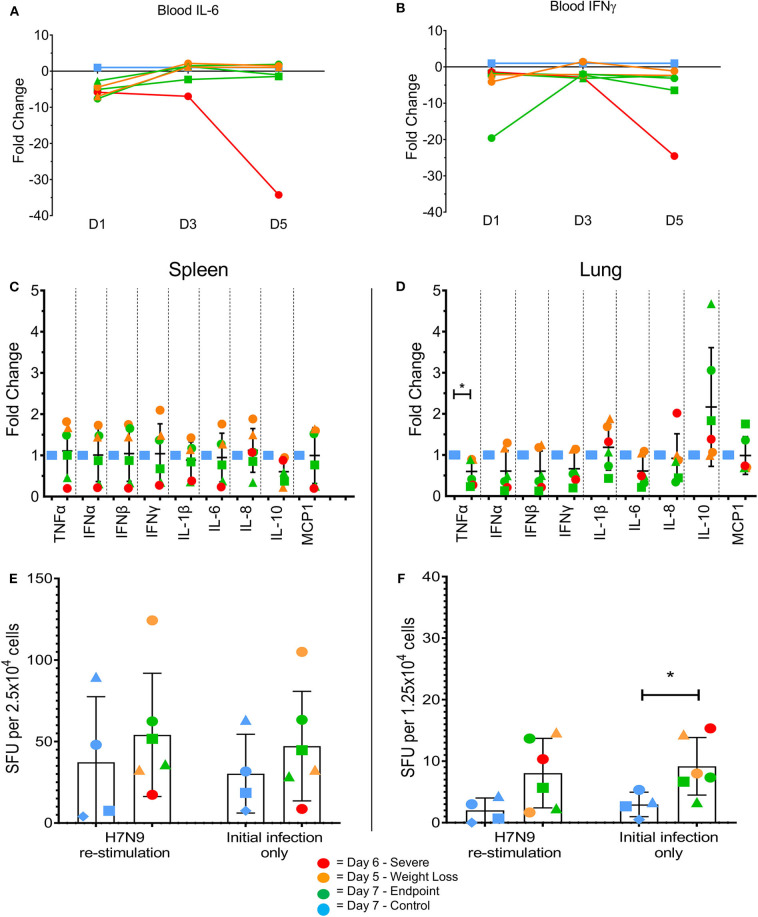
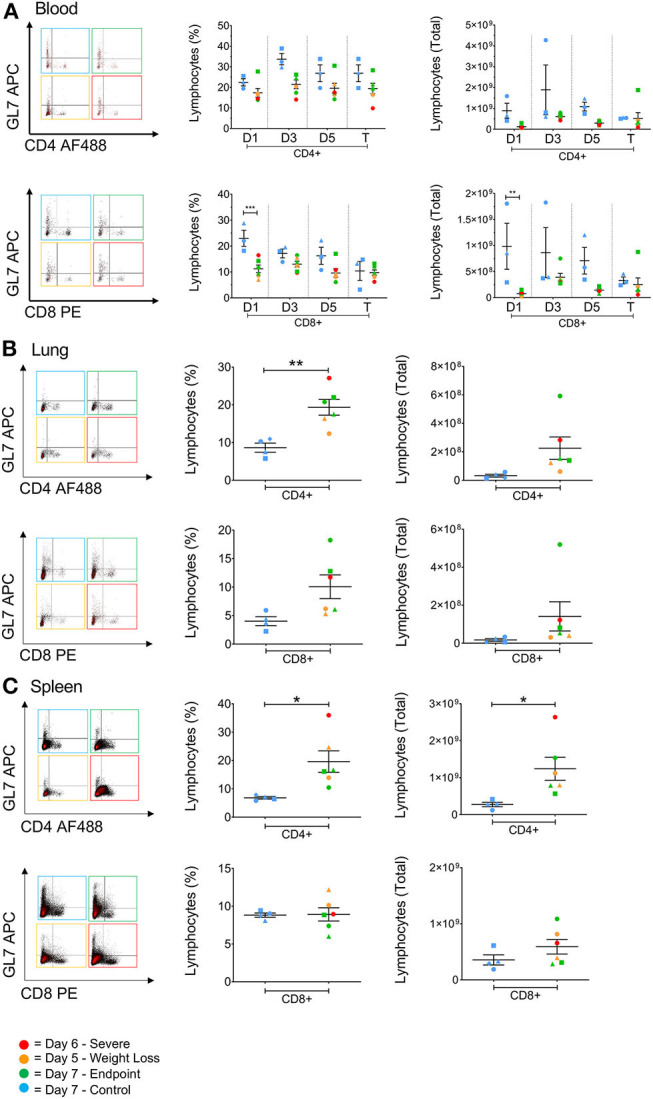
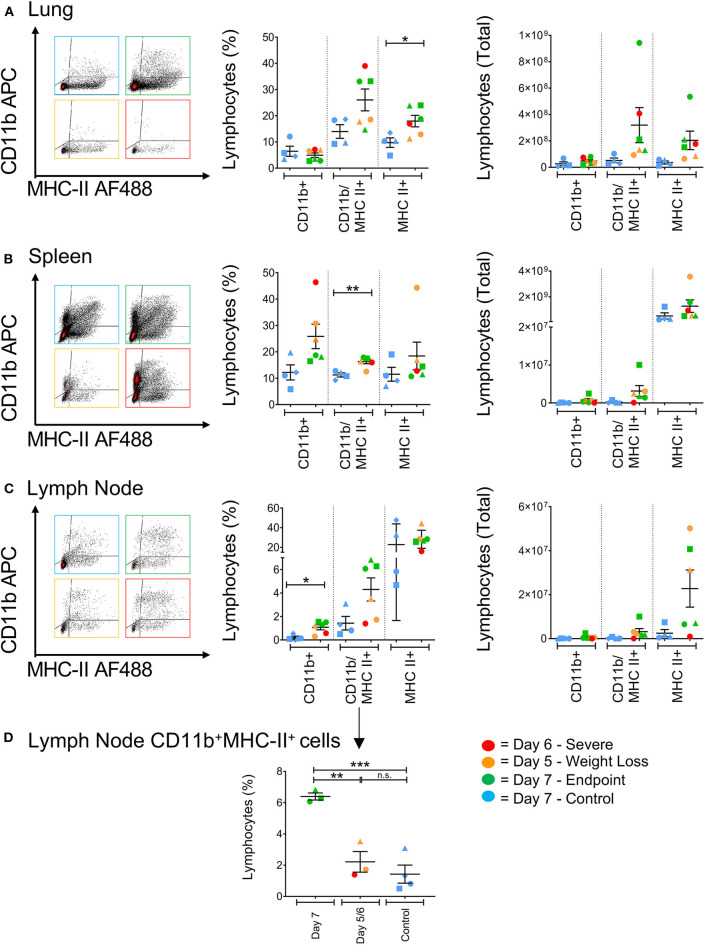
As the recent outbreak of SARS-CoV-2 has highlighted, the threat of a pandemic event from zoonotic viruses, such as the deadly influenza A/H7N9 virus subtype, continues to be a major global health concern. H7N9 virus strains appear to exhibit greater disease severity in mammalian hosts compared to natural avian hosts, though the exact mechanisms underlying this are somewhat unclear. Knowledge of the H7N9 host-pathogen interactions have mainly been constrained to natural sporadic human infections. To elucidate the cellular immune mechanisms associated with disease severity and progression, we used a ferret model to closely resemble disease outcomes in humans following influenza virus infection. Intriguingly, we observed variable disease outcomes when ferrets were inoculated with the A/Anhui/1/2013 (H7N9) strain. We observed relatively reduced antigen-presenting cell activation in lymphoid tissues which may be correlative with increased disease severity. Additionally, depletions in CD8+ T cells were not apparent in sick animals. This study provides further insight into the ways that lymphocytes maturate and traffic in response to H7N9 infection in the ferret model.

Keywords: H7N9; animal model; antigen presenting cells; ferrets; influenza; zoonoses.


Figures

Figure 1
Figure 1
Variation in clinical outcome amongst study ferrets. (A) Summary of ferret characteristics and classification of ferrets according to clinical signs and time of euthanasia. Blue represents the uninfected controls; green represents ferrets which survived until trial endpoint (day 7); yellow represents ferrets with few clinical signs but reached ethical weight loss point (day 5); and red represents the ferret which showed severe clinical signs and was euthanised at (day 6). (B) Individual play scores measured for ferrets daily, with 0 signifying no signs, 1 minor clinical signs, and 2 moderate-to-severe clinical signs. Ferrets reaching a score of 2 were euthanised for ethical reasons. (C) Body weight and (D) temperature of each ferret throughout the study according to the legend shown in (A). Mean and SD are shown, n = 6 for H7N9-infected ferrets, n = 4 for control ferrets. Weight data are plotted as a percentage change from the initial D-3 weight recording on days post-infection. Time points marked with (*) indicate significant differences between infected and controls where p < 0.05, and (***) indicates p < 0.001.
Figure 2
Figure 2
Virological and serological data correlating to clinical outcome. Virus titres (TCID50/ml) in nasal washes collected from the ferrets on days 1, 3, 5, and 7 post-infection (A), and in the lung at the time of humane euthanasia (B). Day 7 ferrets showed viral clearance by study endpoint, whilst earlier timepoint ferrets did not clear the virus by euthanasia. (B) One of the 2 day five ferrets was the only ferret to show live virus in the lungs post-study. (C) Haemagglutination inhibition assay titres in ferret serum samples collected from terminal bleeds. Day 7 ferrets also exhibited elevated serum titres by HI assay from terminally collected samples, whereas the 1 day six ferret was the only culled ferret to have a positive serum sample.
Figure 3
Figure 3
Histopathology in ferrets infected with H7N9 virus. (a) Infected nasal turbinate, showing epithelial metaplasia (arrowheads) and suppurative inflammatory exudate (*) in airways (day 7, HE stain). (b) Nasal turbinate during early infection (day 5) showing viral infection of turbinate epithelium (IHC stain). (c) Diffuse interstitial pneumonia, showing severe alveolar oedema and inflammatory cell infiltration around blood vessels and into the alveolar spaces (lung, day 6). (d) Broncho-interstitial pneumonia, showing a large focal lesion involving an obliterated airway and surrounding inflammation into the interstitium (lung, day 7). (e) Bronchitis, showing infection of bronchial epithelium (arrowheads) and filling of the airway with infected sloughed cells and inflammatory cells (*). In this example, the bronchial inflammatory response is minimal, indicating that the lesion is in the early stages (lung, day 5). (f) Bronchial adenitis, showing viral antigen and necrosis of bronchial glands (lung, day 6). (g) No pathology was observed in the nasal turbinates, or (h) in the lungs of the uninfected controls (day 7).
Figure 4
Figure 4
Changes in pro-inflammatory cytokine levels in multiple tissues by qPCR and ELISpot assay. Immune cytokine levels were determined using TaqMan qPCR assays on cDNA prepared from the RNA of lysed tissues. In the blood samples the day 5 ferret showed large decreases in (A) IL-6 and (B) IFN-γ at day 5 post-infection. (C) In the spleen, little variation was seen between control and infected samples. Levels of IFN-γ producing cells were determined by ELISpot assay. (D) In the lung, H7N9-infected ferrets showed a significant fold change in TNFα. (E) In the lung, H7N9-infected ferrets showed significantly greater levels (p = 0.0389) of spots compared to non-infected controls without re-stimulation with H7N9. (F) In the spleen, little variation was seen between control and infected samples regardless of re-stimulation. Data marked with (*) indicate p < 0.05.
Figure 5
Figure 5
The effect of H7N9 on T lymphocyte subsets. Representative FACS plots of CD4+ and CD8+ T cell subsets plotted against GL7 activation marker, with percentage of positive cells and total cell numbers (A) in the blood over time, (B) in the lung, and (C) in the spleen. Time points marked with (*) indicate p < 0.05, (**) indicates p < 0.01, and (***) indicates p < 0.001. For blood samples, n = 3 for control, rather than n = 4, due to insufficient cell numbers recovered for one ferret.
Figure 6
Figure 6
The effect of H7N9 infection on antigen presenting cell subsets. Representative FACS plots of CD11b+ and MHC-II+ antigen-presenting cell subsets, with percentage of positive cells and total cell numbers (A) in the lung, (B) in the spleen, and (C) in the mediastinal lymph node. (D) Ferrets had significantly greater levels of CD11b+MHC-II+ cells in the lymph node at Day 7 compared to earlier time points and the control animals. Data marked with (*) indicate p < 0.05, (**) indicates p < 0.01, and (***) indicates p < 0.001.

Similar articles

References

    1. Watanabe T, Kiso M, Fukuyama S, Nakajima N, Imai M, Yamada S, et al. . Characterization of H7N9 influenza A viruses isolated from humans. Nature. (2013) 501:551. 10.1038/nature12392 - DOI - PMC - PubMed
    1. Horman WSJ, Nguyen THO, Kedzierska K, Bean AGD, Layton DS. The drivers of pathology in zoonotic avian influenza: the interplay between host and pathogen. Front Immunol. (2018) 9:1812. 10.3389/fimmu.2018.01812 - DOI - PMC - PubMed
    1. World Health Organization Influenza at the Human-Animal Interface: Summary and Assessment, 13 February to 9 April 2019. (2019) Available online at: https://www.who.int/influenza/human_animal_interface/Influenza_Summary_I... (accessed May 20, 2020).
    1. Imai M, Watanabe T, Kiso M, Nakajima N, Yamayoshi S, Iwatsuki-Horimoto K, et al. . A highly pathogenic avian H7N9 influenza virus isolated from a human is lethal in some ferrets infected via respiratory droplets. Cell Host Microbe. (2017) 22:615–26.e8. 10.1016/j.chom.2017.09.008 - DOI - PMC - PubMed
    1. Wang Z, Wan Y, Qiu C, Quiñones-Parra S, Zhu Z, Loh L, et al. . Recovery from severe H7N9 disease is associated with diverse response mechanisms dominated by CD8? T cells. Nat Commun. (2015) 6:6833. 10.1038/ncomms7833 - DOI - PMC - PubMed

Publication types

MeSH terms