. 2020 Sep 24:11:588079.
doi: 10.3389/fimmu.2020.588079. eCollection 2020.

A Holistic View of Berberine Inhibiting Intestinal Carcinogenesis in Conventional Mice Based on Microbiome-Metabolomics Analysis

Affiliations

A Holistic View of Berberine Inhibiting Intestinal Carcinogenesis in Conventional Mice Based on Microbiome-Metabolomics Analysis

Haitao Chen et al. Front Immunol. .

Abstract

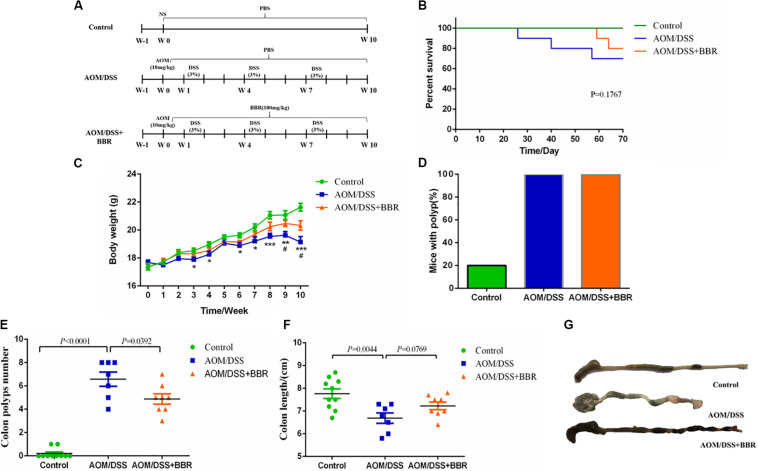
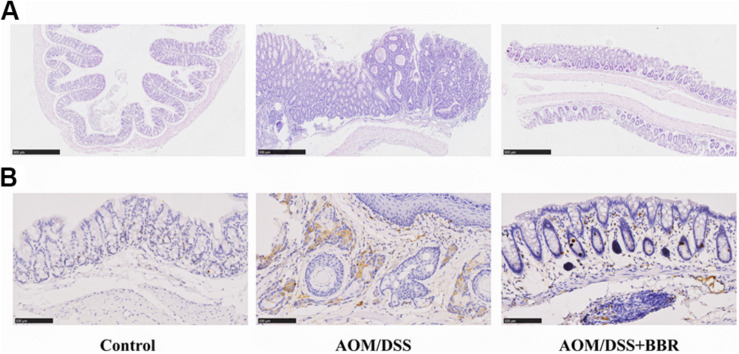
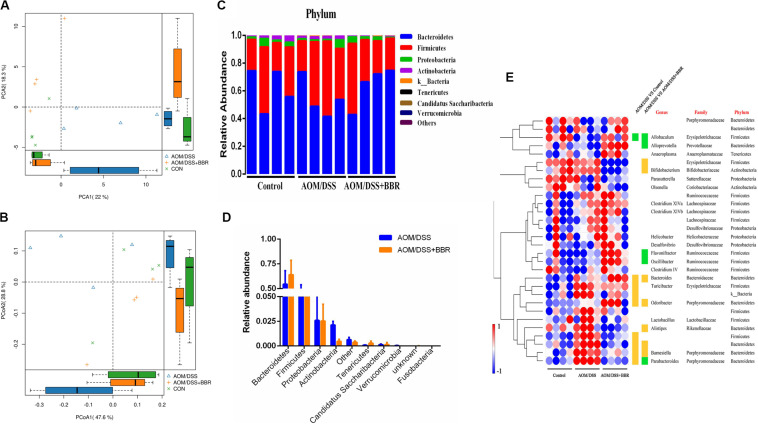
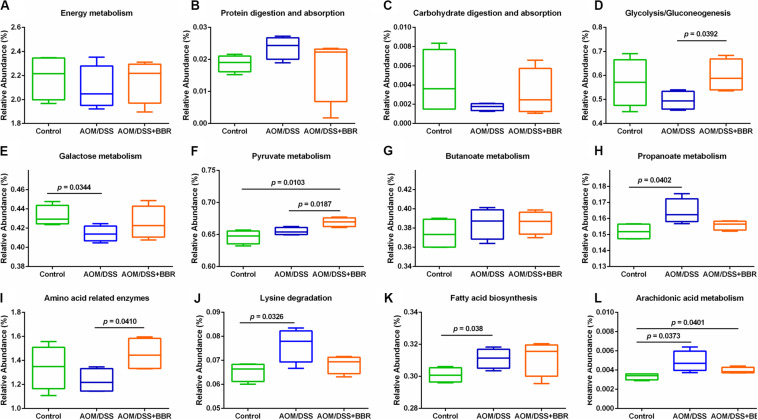
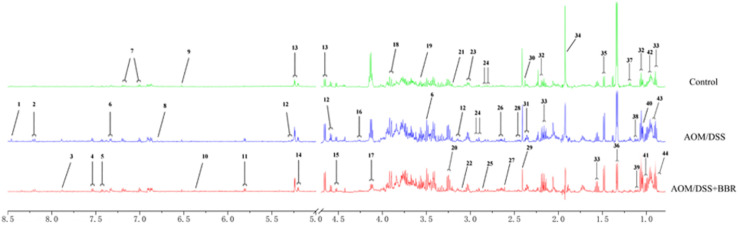
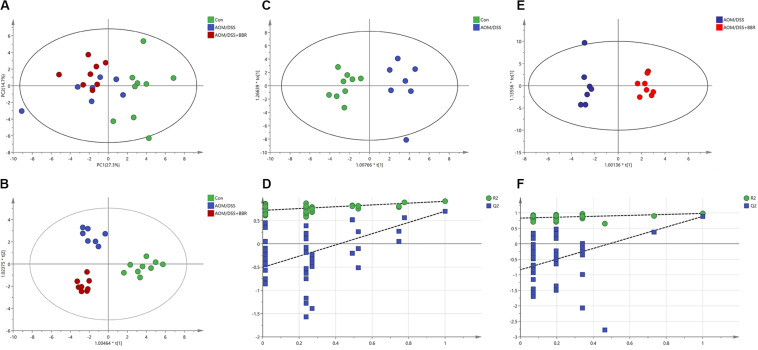
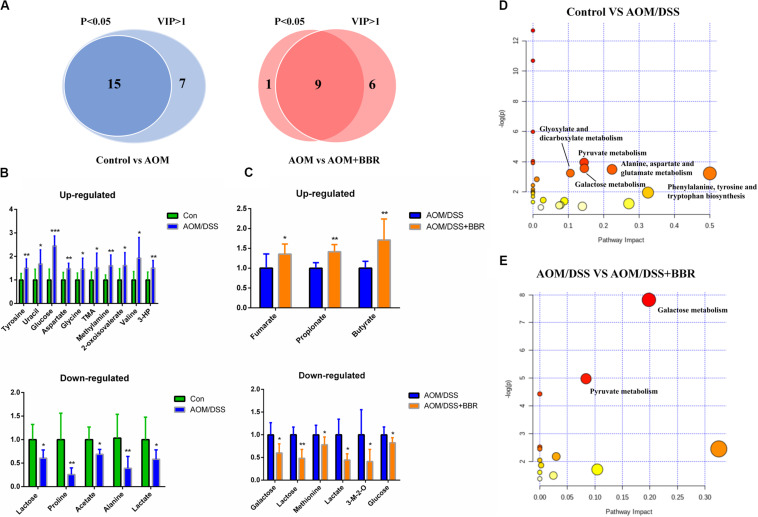
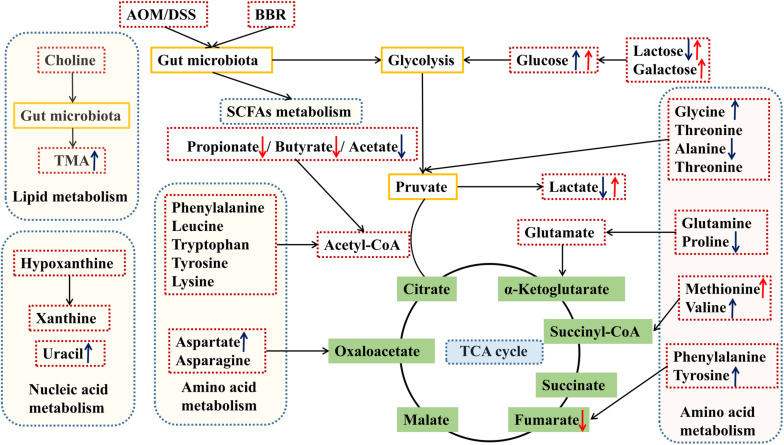
Berberine (BBR) has been reported that it has effects on inhibiting colorectal cancer (CRC). However, the mechanism of BBR on CRC also remains largely unknown. Herein, we investigated the therapeutic effects of BBR on CRC from the perspective of gut microbiota and metabolic alterations, which can provide a holistic view to understand the effects of BBR on CRC. First, azoxymethane (AOM)/dextran sodium sulfate (DSS) mouse was used as CRC animal model, then the degree of colorectal carcinogenesis in AOM/DSS mice with or without BBR administration was measured. The composition and abundance of gut microbiota was investigated by using 16S rRNA. Meanwhile, feces samples were analyzed with 1H NMR spectroscopy to investigate the metabolic alterations. As a result, BBR significantly reduced intestinal tumor development with lower macroscopic polyps and ki-67 expression of intestinal tissue, and better colonic morphology in mice. Moreover, BBR altered the composition of gut microbiota in AOM/DSS mice obviously, which were characterized by a decrease of Actinobacteria and Verrucomicrobia significantly at the phylum level. At the genus level, it was able to suppress pathogenic species, such as f_Erysipelotrichaceae, Alistipes, and elevate some short-chain fatty acids (SCFA)-producing bacteria, including Alloprevotella, Flavonifractor, and Oscillibacter. Metabolic data further revealed that BBR induced metabolic changes in feces focus on regulating glycometabolism, SCFA metabolism and amino acid metabolism, which also provides evidence for alteration of the microbiota because these feces metabolites are the products of interactions between the host and the microbial community. This study showed that BBR induced alterations in microbiota and metabolic in AOM/DSS mice, which might providing new insight into the inhibition effects of BBR on CRC.

Keywords: NMR-based metabolomics; berberine; colorectal cancer; gut microbiota; metabolites.


Figures

FIGURE 1
FIGURE 1
Effects of BBR on intestinal tumorigenesis in the AOM/DSS mouse model. (A) Design of BBR experiment to AOM/DSS mice (n = 10/group). (B) Survival rate of each group was measured. (C) Body weight of mice was recorded. (D) The rate of mice with polyp was detected. (E) Number of colon tumors was observed. (F,G) The colon length was measured. Data are expressed as mean ± SE. AOM/DSS (vs. Control: *P < 0.05, **P < 0.01, ***P < 0.001; vs. AOM/DSS + BBR: #P < 0.05).
FIGURE 2
FIGURE 2
Effects of BBR on AOM/DSS induced colorectal carcinogenesis. (A) H&E staining of colorectal sections. (B) Immunohistochemistry staining of colorectal sections showing the expression of Ki-67 among groups.
FIGURE 3
FIGURE 3
Diversity and composition of gut microbiota among groups (n = 4/group). (A,B) unsupervised PCA scatter plot and weighted uniFrac-based PCoA of feces microbiota. (C) Bacterial taxonomic profiling at the phylum level in different sample. (D) Relative abundances of bacterial phyla level between AOM/DSS group and AOM/DSS + BBR group, and the red marked bacteria have significant differences; (E) Heat map of the relative abundances of various bacterial genera identified in feces samples among groups. Each raw represents one genus with its family and phylum information, and blank means unclassified. Each column represents an individual sample. Red or blue color represents the high relative or low relative of abundance in each sample. Besides, green or orange entry indicates genera that were averagely less or more abundant in AOM/DSS group relative to control group, or to AOM/DSS + BBR group, and there were significant differences between the two groups (P < 0.05).
FIGURE 4
FIGURE 4
Inferred gut microbiome functions by PICRUSt from 16S rRNA gene sequences among groups. (A–C) Overall conditions of basic metabolism; (D–F) gluco-related metabolism; (G,H) SCFAs-related metabolism; (I,J) amino acid-related metabolism. (K,L) Lipid-related metabolism.
FIGURE 5
FIGURE 5
Typical 1H-NMR spectrum of fecal sample in different groups. Typical 600 MHz 1H NMR spectra of feces samples in the different groups. 1, formate; 2, hypoxanthine; 3, xanthine; 4, tryptophan; 5, phenylalanine; 6, 3-hydroxyphenylacetate; 7, tyrosine; 8, homovanillate; 9, fumarate; 10, urocanate; 11, uracil; 12, galactose; 13, glucose; 14, D-xylose; 15, arabinose; 16, threonine; 17, lactose; 18, aspartate; 19, glycine; 20, taurine; 21, methano; 22, choline; 23, lysine; 24, asparagine; 25, trimethylamine; 26, methionine; 27, methylamine; 28, glutamine; 29, succinate; 30, proline; 31, glutamate; 32, propionate; 33, butyrate; 34, acetate; 35, alanine; 36, lactate; 37, ethanol; 38, 3-methyl-2-oxoisovalerate; 39, 2-oxoisovalerate; 40, isobutyrate; 41, valine; 42, leucine; 43, isoleucine; 44, valerate.
FIGURE 6
FIGURE 6
Metabolic analysis. (A,B) The PCA scatter plot and OPLS-DA score plots of the 1H NMR data of feces samples among control, AOM/DSS, and AOM/DSS + BBR group. (C,D) The OPLS-DA score plots and validation plot based on the 1H NMR data of feces samples obtained from control and AOM/DSS group. (E,F) The OPLS-DA score plots and validation plot based on the 1H NMR data of feces samples obtained from AOM/DSS and AOM/DSS + BBR group.
FIGURE 7
FIGURE 7
Differential metabolites and metabolic pathways. (A) Differential metabolites were identified based on P < 0.05 and VIP > 1 as the filter for control and AOM/DSS group, AOM/DSS and AOM/DSS + BBR group. (B,C) The change of differential metabolites in control and AOM/DSS group, AOM/DSS and AOM/DSS + BBR group. (D,E) Meaningful metabolic pathways in the comparison of control and AOM/DSS group, AOM/DSS and AOM/DSS + BBR group. 3-HP, 3-hydroxyphenylacetate; 3-M-2-O, 3-methyl-2-oxoisovalerate. (Control group: n = 9; AOM/DSS group: n = 7; AOM/DSS+BBR group: n = 8). *P < 0.05, **P < 0.01; ***P < 0.001.
FIGURE 8
FIGURE 8
Schematic diagram of the altered pathways in feces samples in the different groups. Metabolites marked with ↑ (up-regulated) or ↓ (down-regulated) are metabolites with significant differences. Blue and red indicates AOM/DSS group vs. control group, and AOM/DSS+BBR group, respectively. TMA, trimethylamine.
FIGURE 9
FIGURE 9
Heatmap of the correlation between the altered microbial community and significantly changed metabolites. The color indicates Spearman’s correlation coefficient, and significant correlations are noted by adjusted P (P < 0.05, ∗∗P < 0.01).

References

    1. Kwon S, Chan AT. Extracting the benefits of berberine for colorectal cancer. Lancet Gastroenterol Hepatol. (2020) 5:231–3. 10.1016/S2468-1253(19)30430-3 - DOI - PubMed
    1. Habtemariam S. Berberine and inflammatory bowel disease: a concise review. Pharmacol Res. (2016) 113:592–9. 10.1016/j.phrs.2016.09.041 - DOI - PubMed
    1. Kong WJ, Vernieri C, Foiani M, Jiang JD. Berberine in the treatment of metabolism-related chronic diseases: a drug cloud (dCloud) effect to target multifactorial disorders. Pharmacol Ther. (2020) 209:107496. 10.1016/j.pharmthera.2020.107496 - DOI - PubMed
    1. Jeyakkumar P, Zhang L, Avula SR, Zhou CH. Design, synthesis and biological evaluation of berberine-benzimidazole hybrids as new type of potentially DNA-targeting antimicrobial agents. Eur J Med Chem. (2016) 122:205–15. 10.1016/j.ejmech.2016.06.031 - DOI - PubMed
    1. Wang A, Yang W, Yang X, Mei X, Hu T, Liang R, et al. MgAl monolayer hydrotalcite increases the hypoglycemic effect of berberine by enhancing its oral bioavailability. Biomed Pharmacother. (2020) 127:110–40. 10.1016/j.biopha.2020.110140 - DOI - PubMed

Publication types

MeSH terms