. 2020 Oct 15:16:139.
doi: 10.1186/s13007-020-00682-6. eCollection 2020.

Development of a novel and rapid phenotype-based screening method to assess rice seedling growth

Affiliations

Development of a novel and rapid phenotype-based screening method to assess rice seedling growth

Lena Vlaminck et al. Plant Methods. .

Abstract

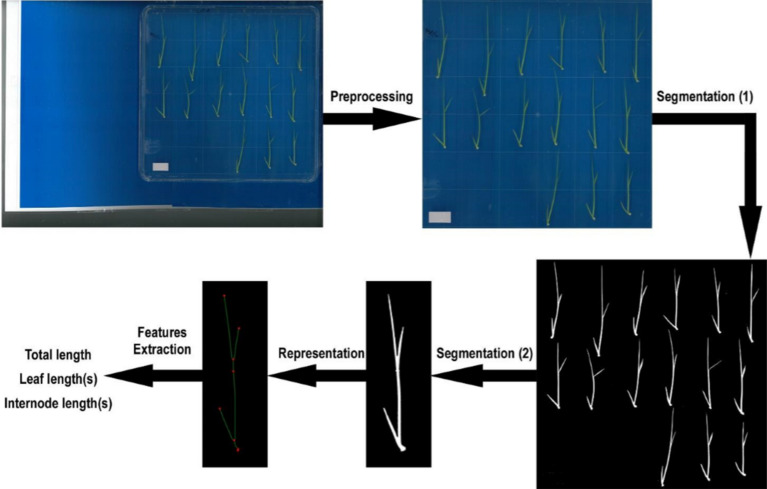
Background: Rice (Oryza sativa) is one of the most important model crops in plant research. Despite its considerable advantages, (phenotypic) bioassays for rice are not as well developed as for Arabidopsis thaliana. Here, we present a phenotype-based screening method to study shoot-related parameters of rice seedlings via an automated computer analysis.

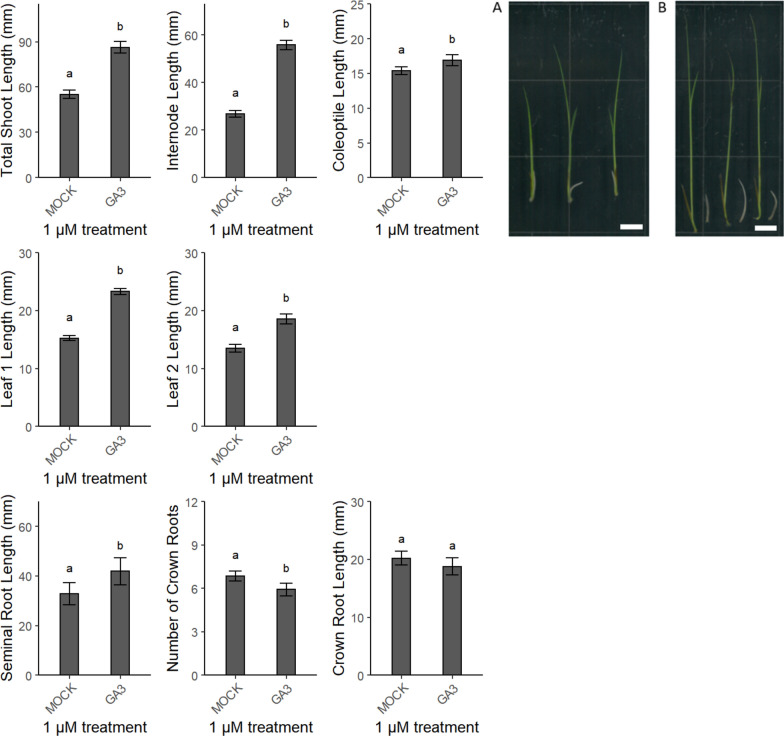
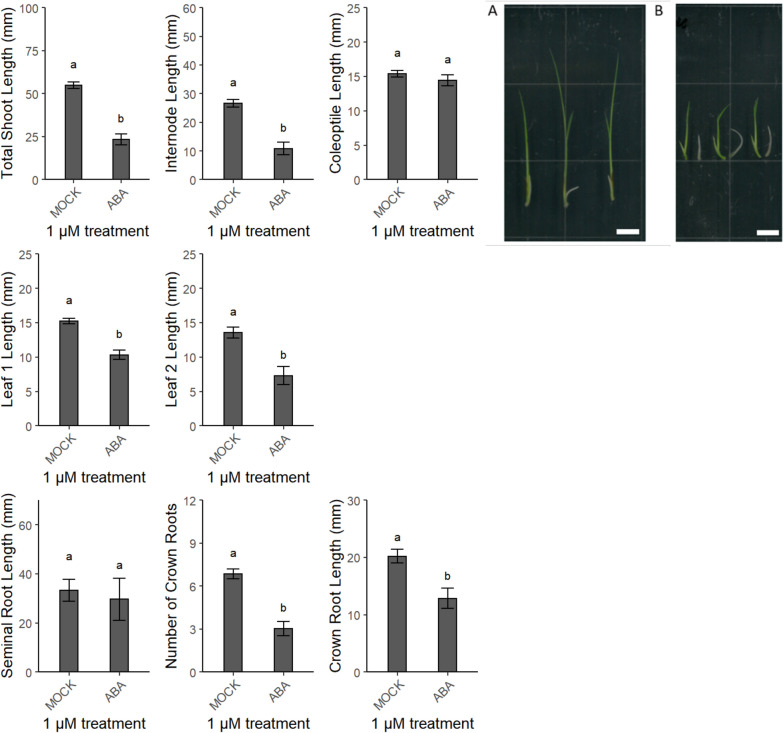
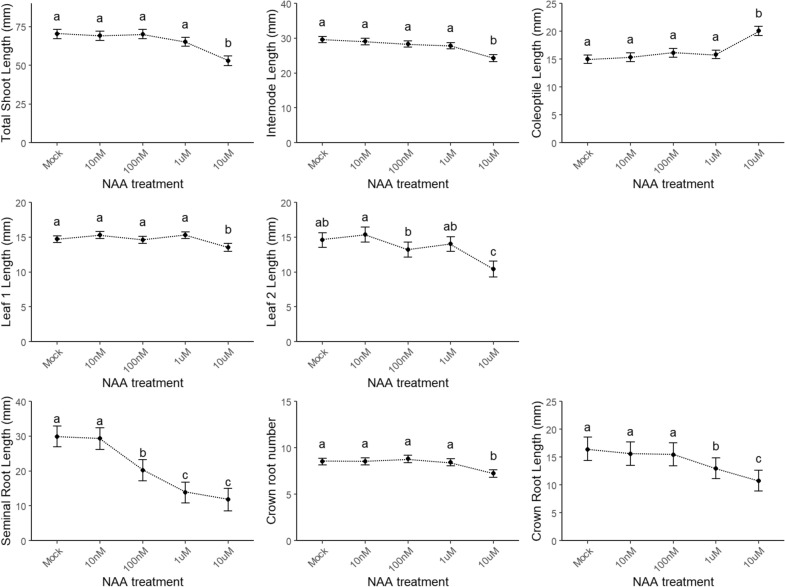
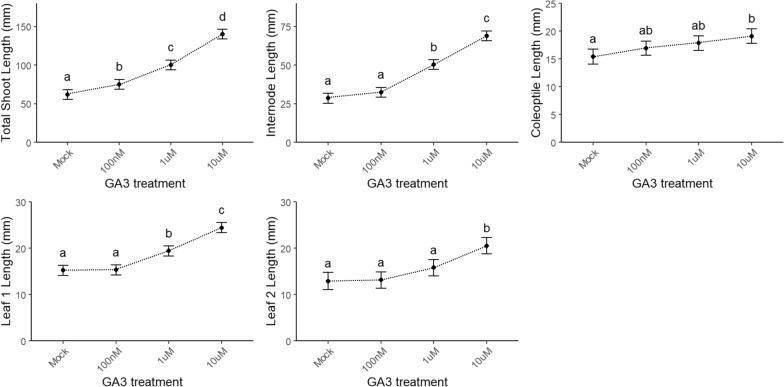
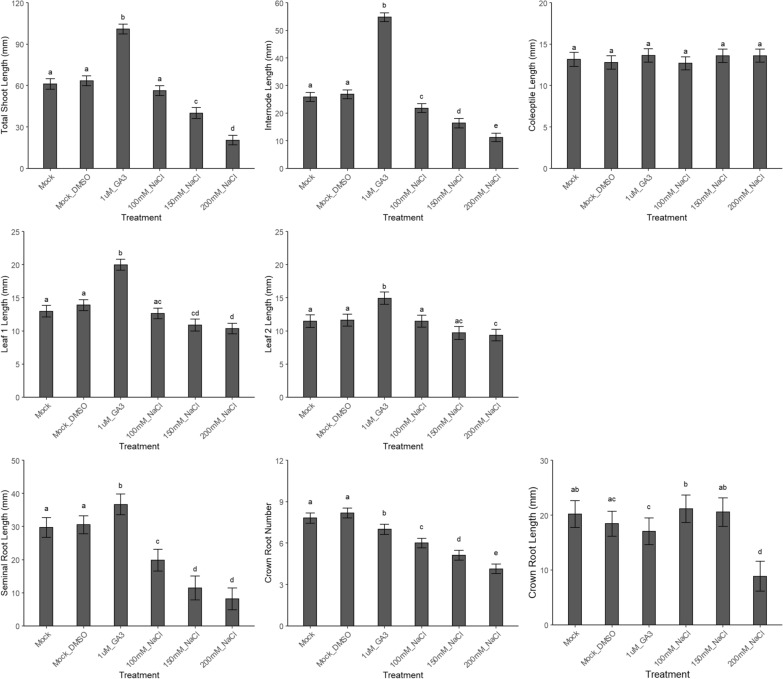
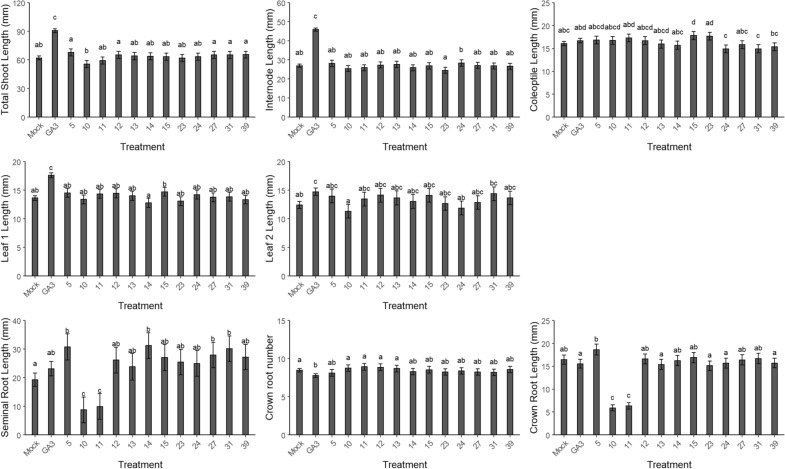
Results: The phenotype-based screening method was validated by testing several compounds in pharmacological experiments that interfered with hormone homeostasis, confirming that the assay was consistent with regard to the anticipated plant growth regulation and revealing the robustness of the set-up in terms of reproducibility. Moreover, abiotic stress tests using NaCl and DCMU, an electron transport blocker during the light dependent reactions of photosynthesis, confirmed the validity of the new method for a wide range of applications. Next, this method was used to screen the impact of semi-purified fractions of marine invertebrates on the initial stages of rice seedling growth. Certain fractions clearly stimulated growth, whereas others inhibited it, especially in the root, illustrating the possible applications of this novel, robust, and fast phenotype-based screening method for rice.

Conclusions: The validated phenotype-based and cost-efficient screening method allows a quick and proper analysis of shoot growth and requires only small volumes of compounds and media. As a result, this method could potentially be used for a whole range of applications, ranging from discovery of novel biostimulants, plant growth regulators, and plant growth-promoting bacteria to analysis of CRISPR knockouts, molecular plant breeding, genome-wide association, and phytotoxicity studies. The assay system described here can contribute to a better understanding of plant development in general.

Keywords: Automated computer analysis; Marine natural products; Oryza sativa; Phenotype-based screening; Plength; RIVA; Seedling growth.


Conflict of interest statement

Competing interestsThe authors declare that they have no competing interests.

Figures

Fig. 1
Fig. 1
Overview of the image analysis pipeline. The sample image was preprocessed, segmented, and represented as a graph. Features of interest, namely lengths of total shoot, leaves, and internode, were extracted from the graph
Fig. 2
Fig. 2
Validation of the screening method by means of 1 µM gibberellic acid (GA3). The shoot parameters (in mm) are lengths of total shoot, internode, coleoptile, and leaves 1 and 2. The root parameters are lengths (in mm) of the seminal and crown roots and the number of emerged crown roots. Different letters indicate statistically significant differences between the treatments (see “Methods”). The picture shows shoots of harvested rice seedlings with a clear difference between treatments, a Mock and b 1 µM gibberellic acid. Scale bar = 1 cm
Fig. 3
Fig. 3
Validation of the screening method by means of 1 µM abscisic acid (ABA). The shoot parameters (in mm) are lengths of total shoot, internode, coleoptile, and leaves 1 and 2. The root parameters are lengths (in mm) of the seminal and crown roots and the number of emerged crown roots. Different letters indicate statistically significant differences between the treatments (see “Methods”). The picture shows shoots of harvested rice seedlings with a clear difference between treatments, a Mock and b 1 µM abscisic acid. Scale bar 1 = cm
Fig. 4
Fig. 4
Validation of the screening method by means of a concentration range of 1-naphthaleneacetic acid (NAA). The shoot parameters (in mm) are lengths of total shoot, internode, coleoptile, and leaves 1 and 2. The root parameters are lengths (in mm) of the seminal and crown roots and the number of emerged crown roots. Different letters indicate statistically significant differences between the treatments (see “Methods”)
Fig. 5
Fig. 5
Validation of the screening method by means of a concentration range of gibberellic acid (GA3). The shoot parameters (in mm) are lengths of total shoot, internode, coleoptile, and leaves 1 and 2. The root parameters are lengths (in mm) of the seminal and crown roots and the number of emerged crown roots. Different letters indicate statistically significant differences between the treatments (n ≥ 14) (see “Methods”)
Fig. 6
Fig. 6
Validation of the screening method by means of a concentration range of NaCl in Oryza sativa (L.) cv. (New) Dongjin. Also 1 µM GA3 was added in the test tubes. Mock_DMSO corresponds to GA3 as this is also dissolved in DMSO, while NaCl is dissolved in sterile dH2O. The shoot parameters (in mm) are lengths of total shoot, internode, coleoptile, and leaves 1 and 2. The root parameters are lengths (in mm) of the seminal and crown roots and the number of emerged crown roots. Different letters indicate statistically significant differences between the treatments (see “Methods”)
Fig. 7
Fig. 7
Application of the screening method by means of 0.5 µg/mL of the MICL library fractions. After one repeat, only the fractions that differed from the mock were repeated two more times and are presented. The shoot parameters (in mm) are lengths of total shoot, internode, coleoptile, and leaves 1 and 2. The root parameters are lengths (in mm) of the seminal and crown roots and the number of emerged crown roots. Different letters indicate statistically significant differences between the treatments (see “Methods”). As a control, 1 µM gibberellic acid (GA3) was used

References

    1. Singh K, Ishii T, Parco A, Huang N, Brar DS, Khush GS. Centromere mapping and orientation of the molecular linkage map of rice (Oryza sativa L.) Proc Natl Acad Sci USA. 1996;93:6163–6168. doi: 10.1073/pnas.93.12.6163. - DOI - PMC - PubMed
    1. Goff SA, Ricke D, Lan TH, Presting G, Wang RL, Dunn M, et al. A draft sequence of the rice genome (Oryza sativa L. ssp japonica) Science. 2002;296:92–100. doi: 10.1126/science.1068275. - DOI - PubMed
    1. Messeguer J, Fogher C, Guiderdoni E, Marfa V, Catala MM, Baldi G, et al. Field assessments of gene flow from transgenic to cultivated rice (Oryza sativa L.) using a herbicide resistance gene as tracer marker. Theor Appl Genet. 2001;103:1151–1159. doi: 10.1007/s001220100713. - DOI
    1. Köhl K. Growing rice in controlled environments. Ann Appl Biol. 2015;167:157–177. doi: 10.1111/aab.12220. - DOI
    1. Hiei Y, Komari T, Kubo T. Transformation of rice mediated by Agrobacterium tumefaciens. Plant Mol Biol. 1997;35:205–218. doi: 10.1023/A:1005847615493. - DOI - PubMed