. 2020 Sep 22:8:555378.
doi: 10.3389/fcell.2020.555378. eCollection 2020.

Mesenchymal Stromal Cell-Produced Components of Extracellular Matrix Potentiate Multipotent Stem Cell Response to Differentiation Stimuli

Affiliations

Mesenchymal Stromal Cell-Produced Components of Extracellular Matrix Potentiate Multipotent Stem Cell Response to Differentiation Stimuli

Ekaterina Novoseletskaya et al. Front Cell Dev Biol. .

Abstract

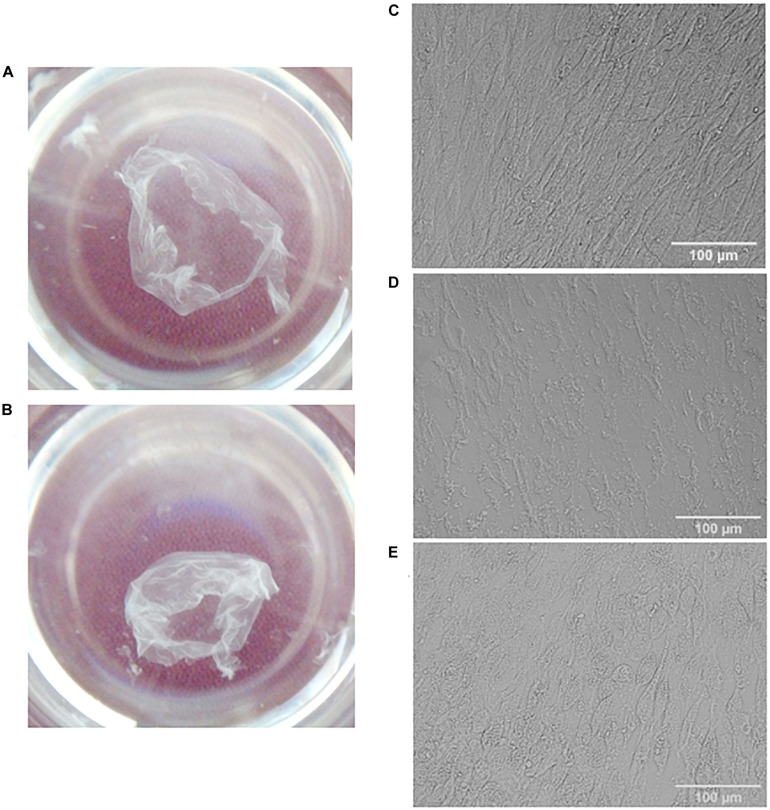
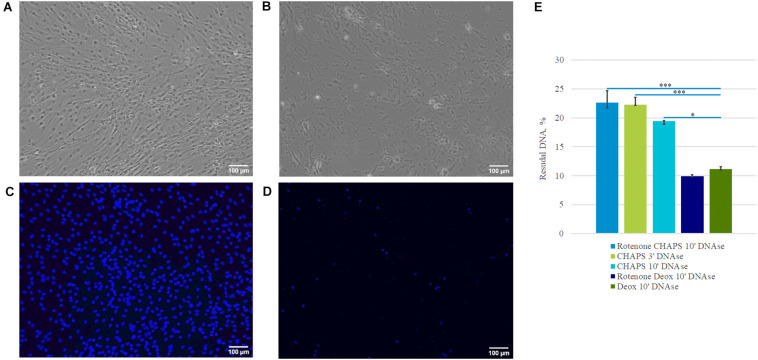
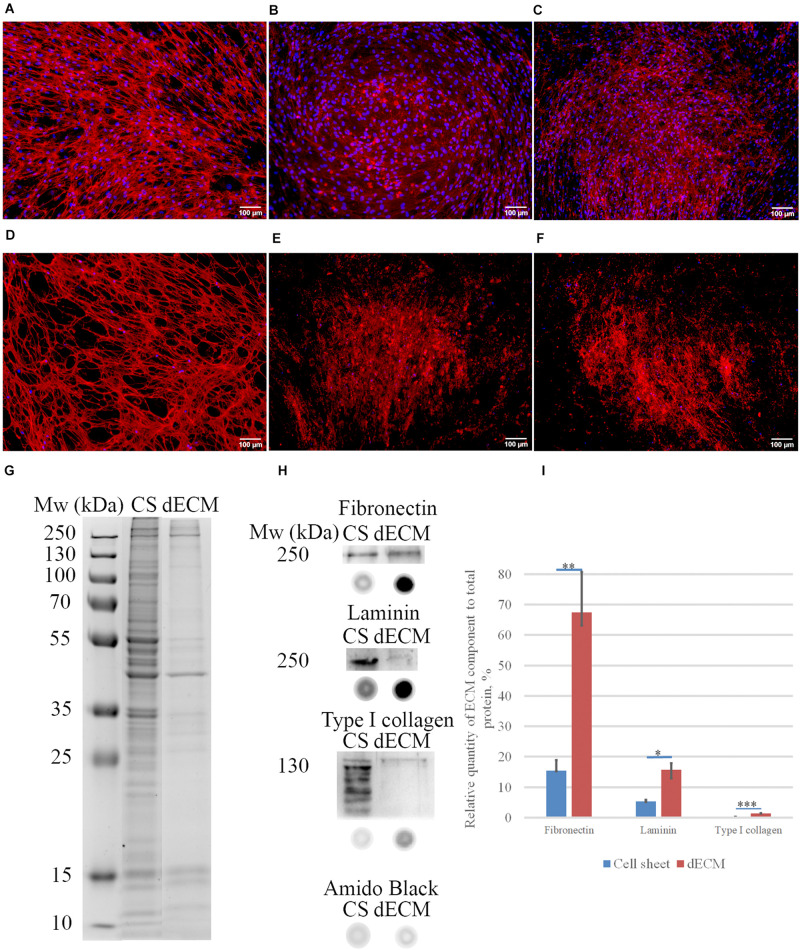
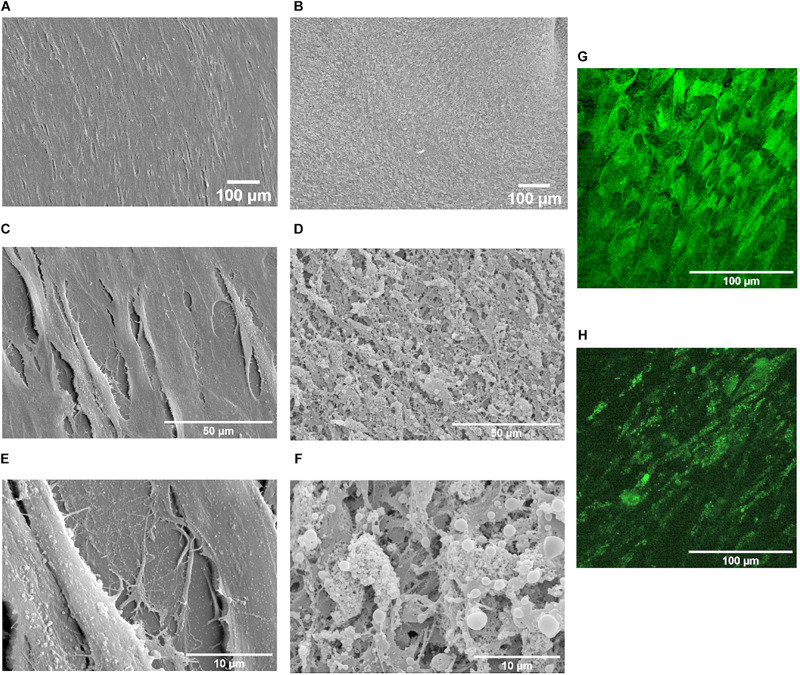
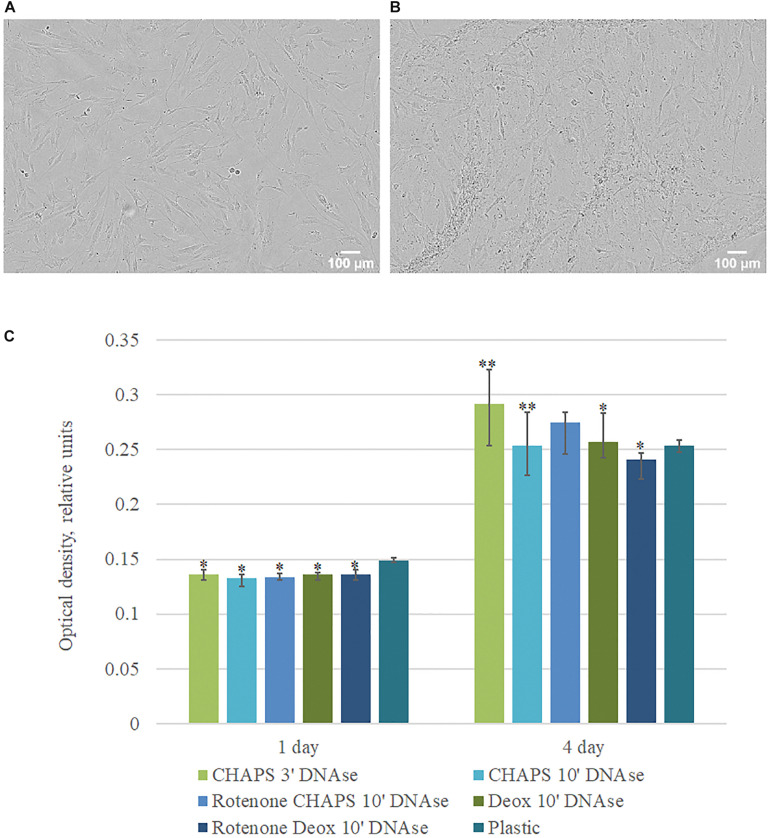
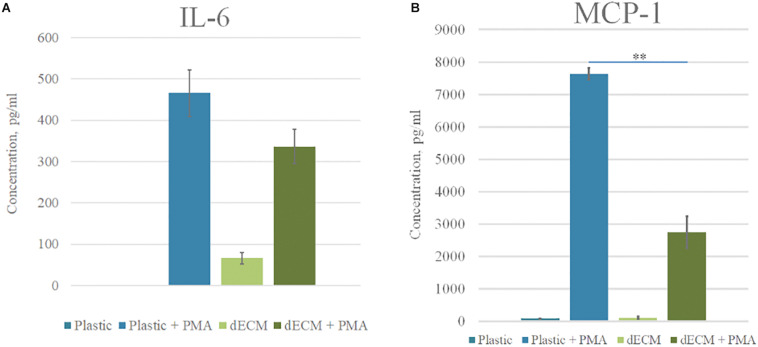
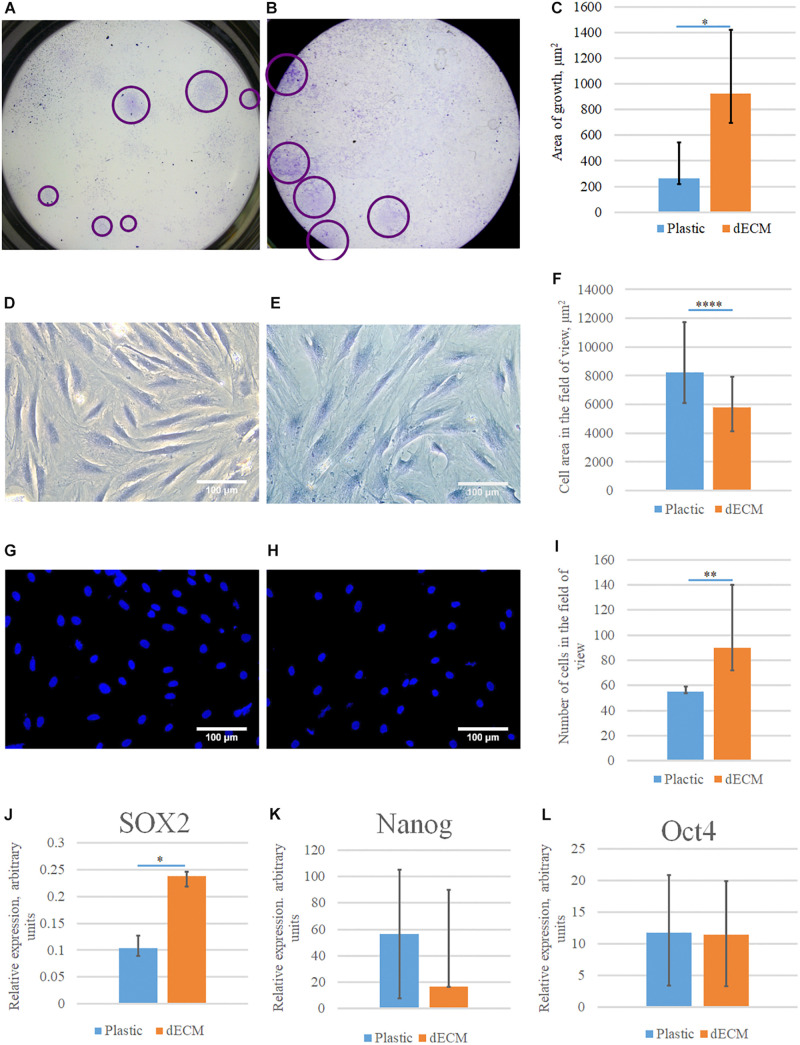
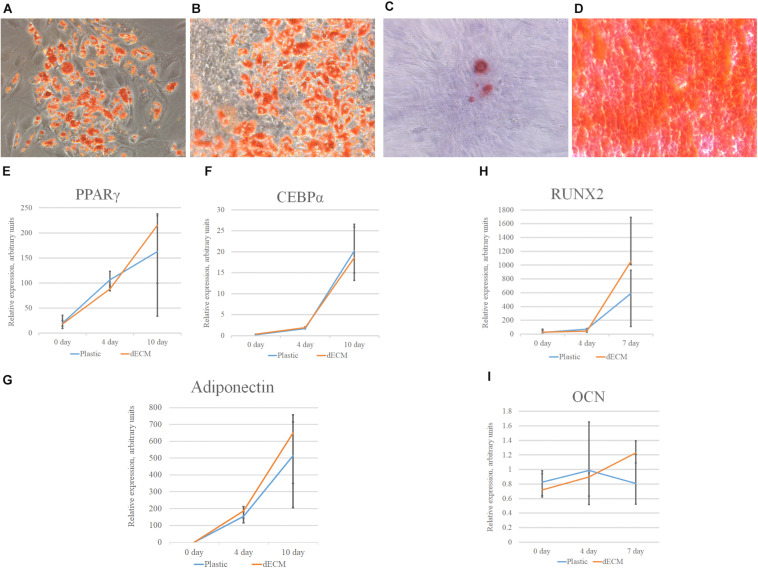
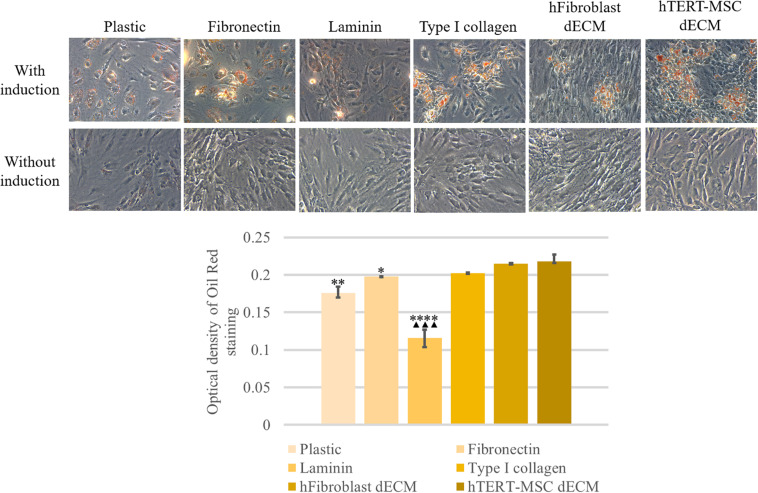
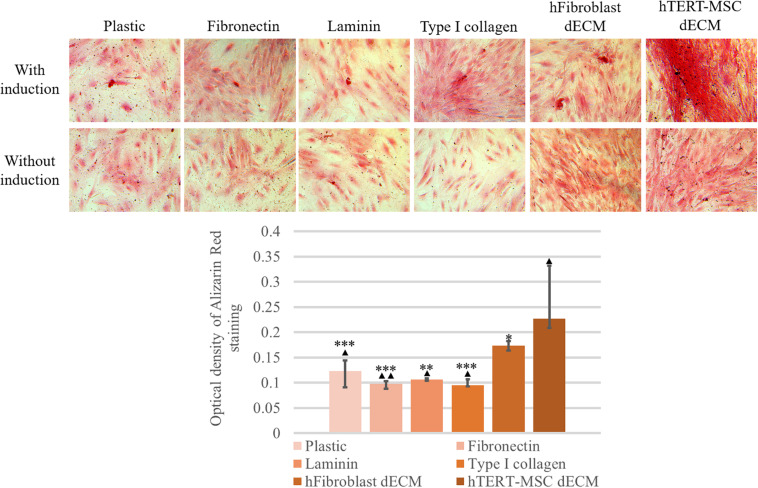
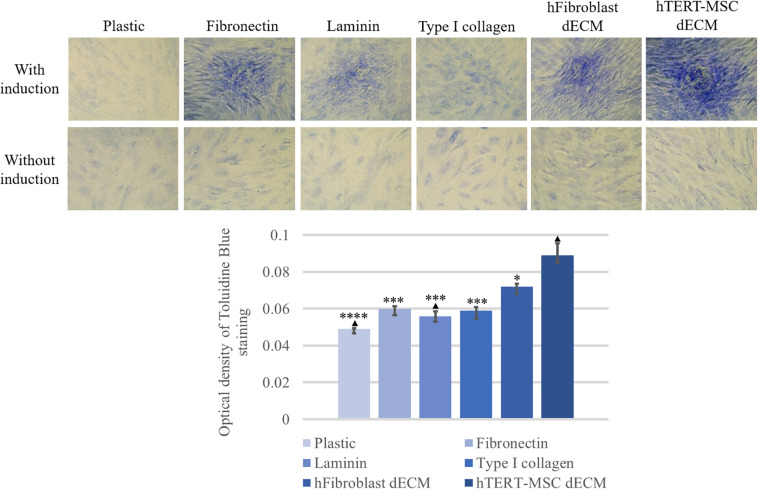
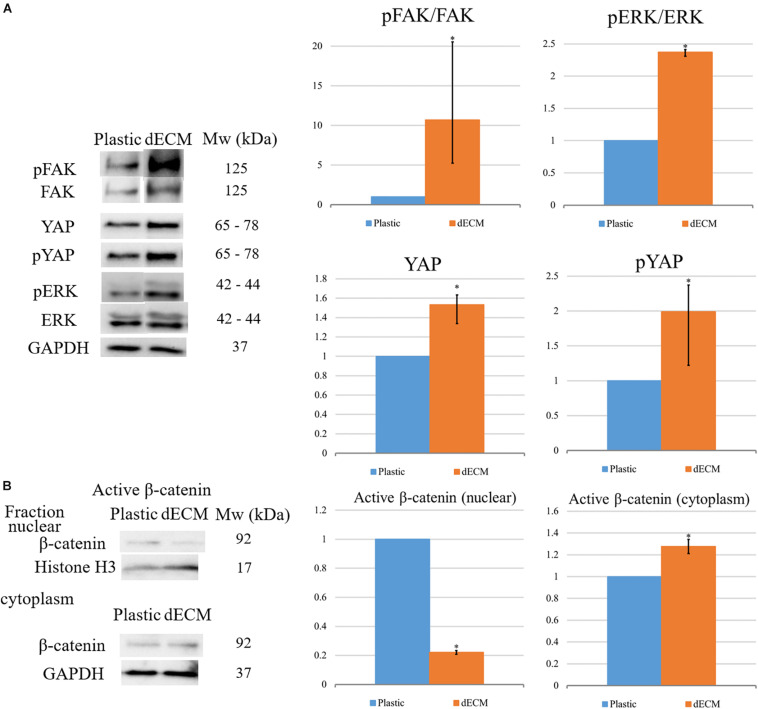
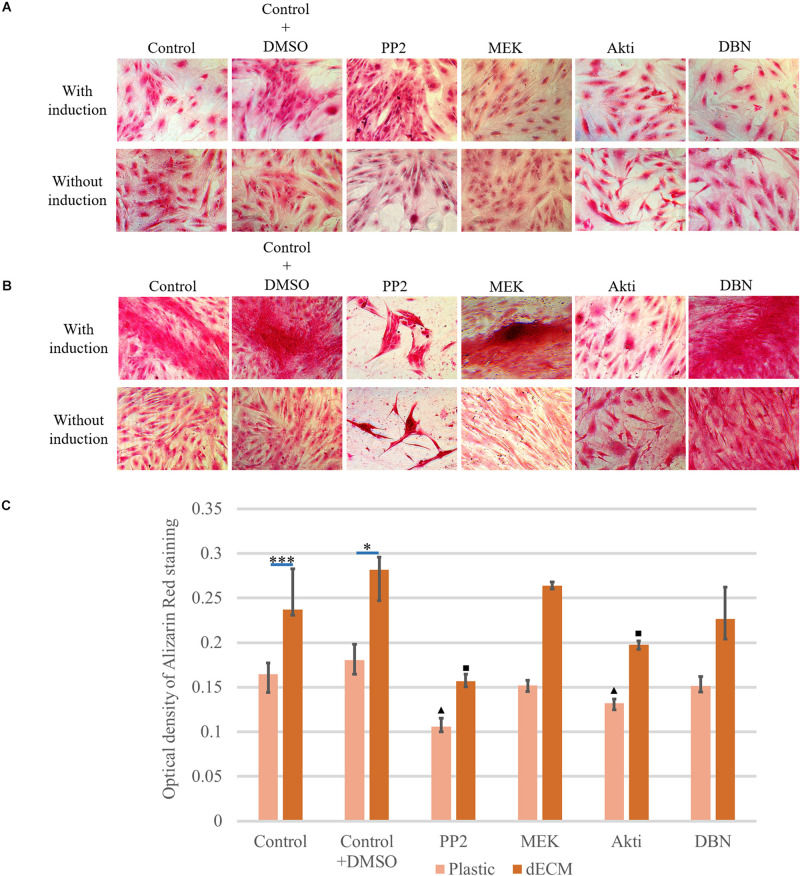
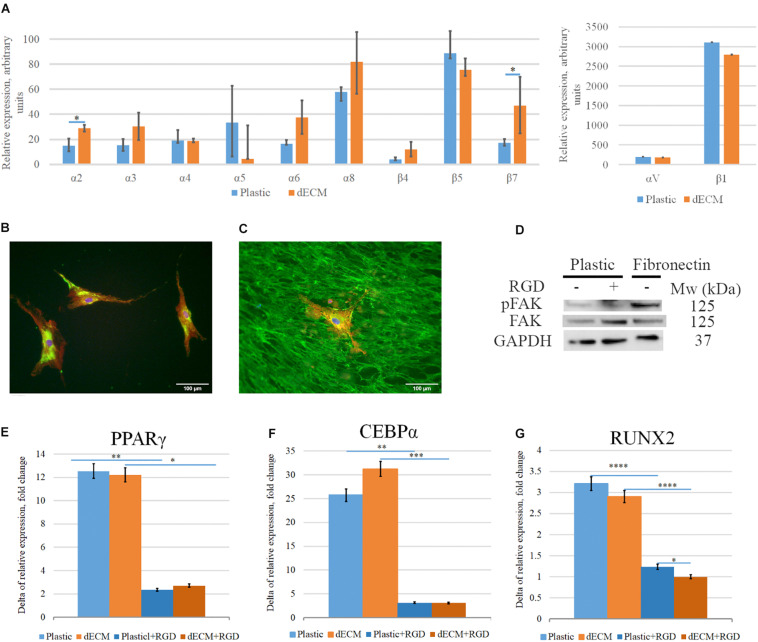
Extracellular matrix (ECM) provides both structural support and dynamic microenvironment for cells regulating their behavior and fate. As a critical component of stem cell niche ECM maintains stem cells and activates their proliferation and differentiation under specific stimuli. Mesenchymal stem/stromal cells (MSCs) regulate tissue-specific stem cell functions locating in their immediate microenvironment and producing various bioactive factors, including ECM components. We evaluated the ability of MSC-produced ECM to restore stem and progenitor cell microenvironment in vitro and analyzed the possible mechanisms of its effects. Human MSC cell sheets were decellularized by different agents (detergents, enzymes, and apoptosis inductors) to select the optimized combination (CHAPS and DNAse I) based on the conservation of decellularized ECM (dECM) structure and effectiveness of DNA removal. Prepared dECM was non-immunogenic, supported MSC proliferation and formation of larger colonies in colony-forming unit-assay. Decellularized ECM effectively promoted MSC trilineage differentiation (adipogenic, osteogenic, and chondrogenic) compared to plastic or plastic covered by selected ECM components (collagen, fibronectin, laminin). Interestingly, dECM produced by human fibroblasts could not enhance MSC differentiation like MSC-produced dECM, indicating cell-specific functionality of dECM. We demonstrated the significant integrin contribution in dECM-cell interaction by blocking the stimulatory effects of dECM with RGD peptide and suggested the involvement of key intracellular signaling pathways activation (pERK/ERK and pFAK/FAK axes, pYAP/YAP and beta-catenin) in the observed processes based on the results of inhibitory analysis. Taken together, we suppose that MSC-produced dECM may mimic stem cell niche components in vitro and maintain multipotent progenitor cells to insure their effective response to external differentiating stimuli upon activation. The obtained data provide more insights into the possible role of MSC-produced ECM in stem and progenitor cell regulation within their niches. Our results are also useful for the developing of dECM-based cell-free products for regenerative medicine.

Keywords: decellularization; extracellular matrix; mesenchymal stromal cells; progenitor; stem cell niche.


Figures

FIGURE 1
FIGURE 1
Visualization of MSC cell sheets (A,C) and decellularized cell sheets (B,D,E). General view (A,B) and representative microphotographs of a cell sheet (C), dECM prepared with sodium deoxycholate and DNAse I treatment (D) or with additional pre-incubation with rotenone (E). Pictures were obtained using differential interference contrast (DIC) microscopy (objective magnification, ×10).
FIGURE 2
FIGURE 2
Effectiveness of decellularization accessed by the percentage of residual DNA. Representative microphotographs of a cell sheet (A,C), dECM prepared with CHAPS and DNAse I treatment (B,D). Pictures were obtained using phase-contrast (A,B) and fluorescence microscopy (C,D) – (blue is DAPI) (objective magnification, ×10). Examination of DNA content in dECM prepared by different methods was performed using PicoGreen assay and normalized to DNA content in the cell sheets (E). The quantitative data are represented as median (25%, 75%), (p value < 0.05), ∗∗∗(p value < 0.0005).
FIGURE 3
FIGURE 3
Expression of ECM proteins [fibronectin (A,D), laminin (B,E), type I collagen (C,F)] in MSC cell sheets and dECM evaluated by immunohistochemistry without permeabilization (objective magnification, ×10). Control immunostaining with isotype IgG is presented in Supplementary Figure S4. Silverstain analysis of electrophoretically separated proteins in cell sheet (CS) and dECM (G). Immunoblot analysis of total fibronectin, total laminin and type I collagen expression levels in CS and dECM (H). Also, dot-blot results performed (H), and data analysis of quantity expression is shown (I). The quantitative data are represented as median (25%, 75%), *(p value < 0.05), *(p value < 0.005), ∗∗∗(p value < 0.0005).
FIGURE 4
FIGURE 4
Scanning electron microscopy of MSC cell sheets (A,C,E) and dECM prepared by the treatment with CHAPS and DNAse I (B,D,F). Magnification: ×100 (A,B), ×1000 (C,D), ×4000 (E,F). Study of second harmonic generation (SHG): (G) MSC cell sheet, (H) dECM prepared by the treatment with CHAPS and DNAse I.
FIGURE 5
FIGURE 5
Proliferation activity of hMSCs cultured on plastic and dECM. (A,B) Representative microphotographs of hMSCs cultured on plastic (A) and dECM (B) for 4 days (phase contrast, objective magnification – ×10), (C) MTT assay of hMSCs cultured on plastic and dECM for 1 and 4 days. The quantitative data are represented as median (25%, 75%). Significant differences marked by (p value < 0.05), ∗∗(p value < 0.005) compared to cells cultured on plastic.
FIGURE 6
FIGURE 6
Cytokine profile of monocytes cultured on plastic and dECM. Level of IL-6 (A) and MCP-1 (B) secreted by monocytes/macrophages with or without PMA treatment measured by ELISA are presented. The quantitative data are represented as median (25%, 75%), ∗∗(p value < 0.005).
FIGURE 7
FIGURE 7
Evaluation of the colony formation and stemness maintenance of hMSCs cultured on plastic or dECM. CFU-F assay was performed for hMSCs cultured on plastic (A,D,G) or dECM (B,E,H), quantification of differences between cell colony sizes, cell area in field of view or number of cells in the field of view are demonstrated on diagrams (C,F,I). Relative expression of pluripotency genes SOX2 (J), NANOG (K), and POU5F1 (Oct4) (L) in hMSCs measured by real-time PCR normalized to housekeeping gene (RPLP0). The quantitative data are represented as median (25%, 75%), (p value < 0.05), ∗∗(p value < 0.005), *⁣*⁣**(p value < 0.0001).
FIGURE 8
FIGURE 8
Induction of adipogenic and osteogenic differentiation of hMSCs cultured on plastic (A,C) or dECM (B,D) for 10 days assessed by cytochemical staining with Oil Red (A,B) or Alizarin Red (C,D) and expression of adipogenic [PPARγ(PPARG) (E), CEBPα(CEBPA) (F), adiponectin (ADIPOQ) (G)] or osteogenic [RUNX2 (H), osteocalcin(OCN) (I)] differentiation markers measured by real-time PCR normalized to housekeeping gene (RPLP0). Objective magnification, ×10. The quantitative data are represented as median (25%, 75%).
FIGURE 9
FIGURE 9
Induction of adipogenic differentiation of hMSCs cultured on plastic, plastic covered by fibronectin, or laminin, or type I collagen and dECM produced by human fibroblasts or MSCs for 4 days assessed by histological staining with Oil Red. Objective magnification, ×20. The dye was extracted, and Oil Red O staining was quantified by measuring the optical density at 530 nm (lower panel) (n = 4). The quantitative data are represented as median (25%, 75%), (p value < 0.05), ∗∗(p value < 0.005), *⁣*⁣**(p value < 0.0001) compared to cells cultured on hTERT-MSC dECM and ▲▲▲(p value < 0.0005) compared to cells cultured on hFibroblast dECM.
FIGURE 10
FIGURE 10
Induction of osteogenic differentiation of hMSCs cultured on plastic, plastic covered by fibronectin, or laminin, or type I collagen and dECM produced by human fibroblasts or MSCs for 4 days assessed by histological staining with Alizarin Red. Objective magnification, ×20. The dye was extracted, and Alizarin Red staining was quantified by measuring the optical density at 560 nm (lower panel) (n = 6). The quantitative data are represented as median (25%, 75%), (p value < 0.05), ∗∗(p value < 0.005), ***(p value < 0.0005) compared to cells cultured on hTERT-MSC dECM and (p value < 0.05), ▲▲(p value < 0.005) compared to cells cultured on hFibroblast dECM.
FIGURE 11
FIGURE 11
Induction of chondrogenic differentiation of hMSCs cultured on plastic, plastic covered by fibronectin, or laminin, or type I collagen and dECM produced by human fibroblasts or MSCs for 4 days assessed by histological staining with Toluidine Blue. Objective magnification, ×20. The dye was extracted, and Toluidine Blue staining was quantified by measuring the optical density at 608 nm (lower panel) (n = 6). The quantitative data are represented as median (25%, 75%), (p value < 0.05), ∗∗∗(p value < 0.0005) compared to cells cultured on hTERT-MSC dECM and (p value < 0.05) compared to cells cultured on hFibroblast dECM.
FIGURE 12
FIGURE 12
Evaluation of differentiation-related intracellular signaling pathways activation in hMSCs cultured on plastic or dECM in total lysate of samples for targets: (A) Evaluation of activation of FAK, ERK, pYAP and YAP. The quantitative data are represented as folds of protein expression in hMSCs cultured on dECM vs. hMSCs cultured on plastic, data are median (25%, 75%), *p < 0.05; (B) Analysis of distribution of active β-catenin between nucleus and cytoplasm. The quantitative data are represented as folds of protein expression in hMSCs cultured on dECM vs. hMSCs cultured on plastic, data are median (25%, 75%), (p value < 0.05). Figure shows representative blots, n = 3.
FIGURE 13
FIGURE 13
Inhibition study of induction mechanism of osteogenic differentiation with inhibitor treatment (PP2 as Src kinase inhibitor, MEK as ERK inhibitor, Akti VIII(Akti) as protein kinase B (Akt) inhibitor and dobutamine (DBN) as YAP inhibitor) of hMSCs cultured on plastic (A) or dECM produced by hTERT-MSCs (B) for 4 days assessed by histological staining with Alizarin Red. Objective magnification, ×20. The dye was extracted, and Alizarin Red staining was quantified by measuring the optical density at 560 nm (lower panel C) (n = 3). The quantitative data are represented as median (25%, 75%), (p value < 0.05), ∗∗∗(p value < 0.0005), triangle and square signs represent the significant changes compared to the corresponding controls (p value < 0.05).
FIGURE 14
FIGURE 14
Impact of interaction of hMSCs with dECM via integrins into dECM-mediated hMSCs differentiation stimulation. (A–C) Expression of integrins in hMSCs cultured on plastic (A,B) or dECM (A,C) estimated by real-time PCR (A) including α2(ITGA2), α3(ITGA3), α4(ITGA4), α5(ITGA5), αV(ITGAV), α6(ITGA6), α8(ITGA8), β1(ITGB1), β4(ITGB4), β5(ITGB5), β7(ITGB7) and immunocytochemical staining for integrin β1 subunit (B,C). (D) Activation of pFAK/FAK signaling pathway in hMSCs in suspension (1) on the presence of RGD peptide (2) or after 1-h attachment to fibronectin (3). (E–G) Relative fold change of hMSC differentiation induction (4 days) measured as increased expression of differentiation markers for adipogenic [PPARγ(PPARG) (E), CEBPα(CEBPA) (F)], and osteogenic [RUNX2 (G)] differentiation by real-time PCR normalized to housekeeping gene (RPLP0) in hMSCs cultured on plastic or dECM with or without blocking of integrin interaction via RGD sequence using RGD peptide. The quantitative data are represented as median (25%, 75%), (p value < 0.05), ∗∗(p value < 0.005), ∗∗∗(p value < 0.0005), *⁣*⁣**(p value < 0.0001).

Similar articles

Cited by

References

    1. Ahmed M., Ffrench-Constant C. (2016). Extracellular matrix regulation of stem cell behavior. Curr. Stem Cell Rep. 2 197–206. 10.1007/s40778-016-0056-2 - DOI - PMC - PubMed
    1. Andreotti J. P., Silva W. N., Costa A. C., Picoli C. C., Bitencourt F. C. O., Coimbra-Campos L. M. C., et al. (2019). Neural stem cell niche heterogeneity. Semin. Cell Dev. Biol. 95 42–53. 10.1016/j.semcdb.2019.01.005 - DOI - PMC - PubMed
    1. Baker N., Sohn J., Tuan R. S. (2015). Promotion of human mesenchymal stem cell osteogenesis by PI3-kinase/Akt signaling, and the influence of caveolin-1/cholesterol homeostasis. Stem Cell Res. Ther. 6:238. - PMC - PubMed
    1. Bao Y., Nakagawa K., Yang Z., Ikeda M., Withanage K., Ishigami-Yuasa M., et al. (2011). A cell-based assay to screen stimulators of the hippo pathway reveals the inhibitory effect of dobutamine on the YAP-dependent gene transcription. J. Biochem. 150 199–208. 10.1093/jb/mvr063 - DOI - PubMed
    1. Baron W., Colognato H., ffrench-Constant C. (2005). Integrin-growth factor interactions as regulators of oligodendroglial development and function. Glia 49 467–479. 10.1002/glia.20132 - DOI - PubMed