. 2020 Sep 17:7:499.
doi: 10.3389/fmed.2020.00499. eCollection 2020.

Near-Single-Cell Proteomics Profiling of the Proximal Tubular and Glomerulus of the Normal Human Kidney

Affiliations

Near-Single-Cell Proteomics Profiling of the Proximal Tubular and Glomerulus of the Normal Human Kidney

Tara K Sigdel et al. Front Med (Lausanne). .

Erratum in

Abstract

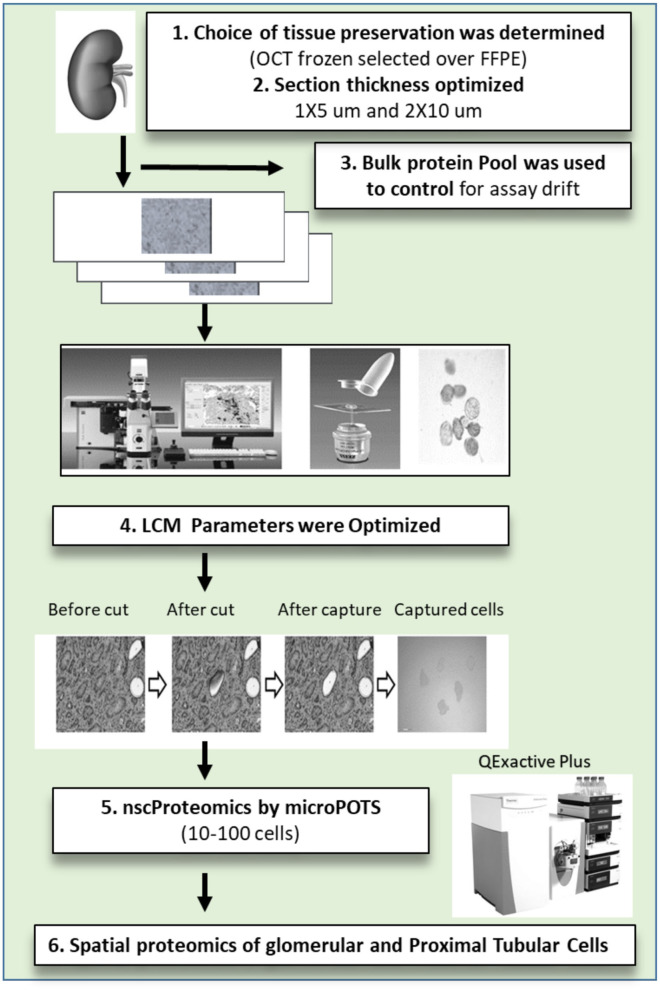
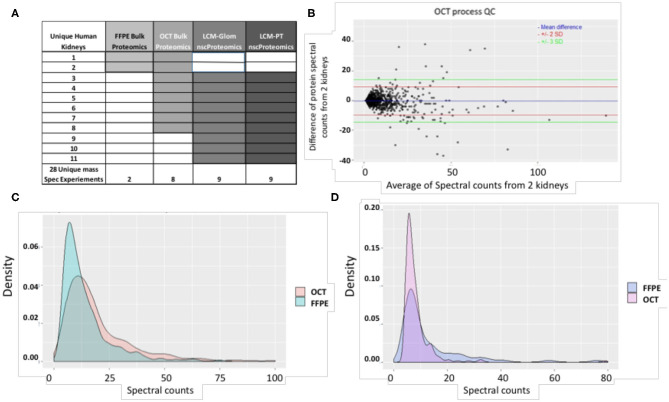
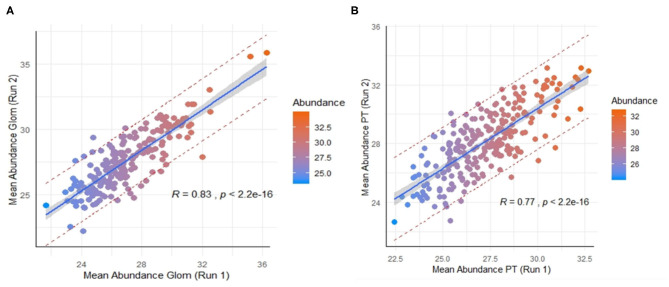
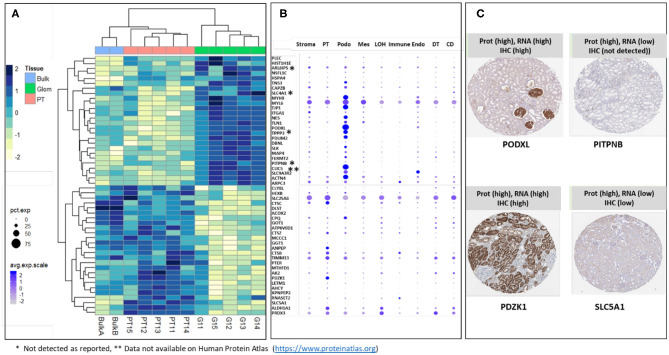
Molecular assessments at the single cell level can accelerate biological research by providing detailed assessments of cellular organization and tissue heterogeneity in both disease and health. The human kidney has complex multi-cellular states with varying functionality, much of which can now be completely harnessed with recent technological advances in tissue proteomics at a near single-cell level. We discuss the foundational steps in the first application of this mass spectrometry (MS) based proteomics method for analysis of sub-sections of the normal human kidney, as part of the Kidney Precision Medicine Project (KPMP). Using ~30-40 laser captured micro-dissected kidney cells, we identified more than 2,500 human proteins, with specificity to the proximal tubular (PT; n = 25 proteins) and glomerular (Glom; n = 67 proteins) regions of the kidney and their unique metabolic functions. This pilot study provides the roadmap for application of our near-single-cell proteomics workflow for analysis of other renal micro-compartments, on a larger scale, to unravel perturbations of renal sub-cellular function in the normal kidney as well as different etiologies of acute and chronic kidney disease.

Keywords: glomerulus; kidney; mass spectrometry; proteomics; single cell analysis.


Figures

Figure 1
Figure 1
The near single cell proteomics (nscProteomics) workflow optimized for processing human kidney tissues. The workflow includes the identification of optimal kidney tissue collection and storage, the quality controls for laser capture microdissection establishment of nscProteomics method for kidney cells.
Figure 2
Figure 2
(A) A summary of study samples and assays. (B) The QC plot for reproducibility of the process using OCT tissue. Spectral count differences between proteins for 2 separate runs using OCT tissue was plotted against average protein spectral count for 1,257 proteins. In the plot, the blue line depicts mean difference; the red and green lines depict 2 SD and 3 SD limits respectively. 97.96% of proteins are within the calculated reproducibility limit of 13.52 indicating a high degree of reproducibility. It is also seen that the inter-run variability of the process involving OCT tissue is lower than that of the process involving FFPE tissue (calculated reproducibility limit: 24.43). (C) Comparison of spectral count distributions of 374 common proteins in OCT and FFPE. Larger number of proteins from OCT tissue show high spectral counts while a higher preponderance of low spectral counts is seen for proteins from FFPE tissue. (D) Comparison of spectral count distributions of 76 unique proteins in FFPE and 244 unique proteins in OCT. Higher preponderance of low spectral count proteins is seen in OCT tissue. This may indicate that OCT tissue technique is better for detection of low-abundant proteins in the current scenario. The correlation coefficient between proteins identified from 2 OCT frozen tissues was 0.96 (P < 0.001).
Figure 3
Figure 3
(A) Correlation of a set of 210 proteins significantly enriched in glomerulus between two different batches of independent kidney samples. Batch 1 (run 1) was from 2 kidneys and Batch 2 (run 2) was from 4 kidneys. Color scale was selected for visual depiction of abundance. A strong positive correlation of 0.83 between the mean abundances of the same set proteins from two different batches The red dashed lines give a measure of the spread by depicting the 95% prediction interval for mean abundance values of these proteins in future repeat experiments. (B) Correlation of 246 proteins significantly enriched in proximal tubules vs. glomerulus between the two batches. A positive correlation of 0.77 between the mean abundances of these same proteins between the two batches.
Figure 4
Figure 4
(A) Heatmap showing differential distribution of protein abundances in 5 normal kidneys (batch 2), of 26 proteins (out of 372) most significantly enriched in G (vs T) and 26 proteins (out of 411) most significantly enriched in T (vs G), with corresponding values in 2 Bulk samples shown for comparison. Protein abundances are measured as log 2 transformed relative intensities. Unsupervised clustering of significant proteins highlights sets of proteins related by Euclidean distance similarity measure within the larger differentiated enriched sets. It is noted that Bulk samples cluster together with PT samples; this is expected since proximal tubules are abundantly dispersed within the kidney. (B) Correlation of gene expression plot of scRNA-seq data from human kidney. Genes encoding Glom-specific and PT-specific proteins presented on the heatmap were selected. Increasing dot size corresponds to a larger percentage of cells in the cell population expressing the gene, while a darker color corresponds to a higher expression of the gene. PT, proximal tubular; Podo, podocytes; Mes, mesangial cells; LOH, Loop of Henle, Immune cells; Endo, endothelial cells; DT, distal tubules; CD, collecting duct. *Sign next to the gene symbol indicates that the protein was not detected on glomeruli as reported by Human Protein Atlas (https://www.proteinatlas.org), **Data not available on Human Protein Atlas (https://www.proteinatlas.org). (C) Representative proteins that demonstrate how nscProteomics not only identifies positive markers such as PODXL and PDZK1 but also identifies protein markers such as that are otherwise missed by transcriptomics or immunohistochemistry.

References

    1. Lee JW, Chou CL, Knepper MA. Deep sequencing in microdissected renal tubules identifies nephron segment-specific transcriptomes. J Am Soc Nephrol. (2015) 26:2669–77. 10.1681/ASN.2014111067 - DOI - PMC - PubMed
    1. Cisek K, Krochmal M, Klein J, Mischak H. The application of multi-omics and systems biology to identify therapeutic targets in chronic kidney disease. Nephrol Dial Transplant. (2016) 31:2003–11. 10.1093/ndt/gfv364 - DOI - PubMed
    1. Wu H, Humphreys BD. The promise of single-cell RNA sequencing for kidney disease investigation. Kidney Int. (2017) 92:1334–42. 10.1016/j.kint.2017.06.033 - DOI - PMC - PubMed
    1. Hohne M, Frese CK, Grahammer F, Dafinger C, Ciarimboli G, Butt L, et al. Single-nephron proteomes connect morphology and function in proteinuric kidney disease. Kidney Int. (2018) 93:1308–19. 10.1016/j.kint.2017.12.012 - DOI - PubMed
    1. Wu H, Malone AF, Donnelly EL, Kirita Y, Uchimura K, Ramakrishnan SM, et al. Single-cell transcriptomics of a human kidney allograft biopsy specimen defines a diverse inflammatory response. J Am Soc Nephrol. (2018) 29:2069–80. 10.1681/ASN.2018020125 - DOI - PMC - PubMed