

Impact of COVID-19 on the social, economic, environmental and energy domains: Lessons learnt from a global pandemic
- PMID: 33072833
- PMCID: PMC7556229
- DOI: 10.1016/j.spc.2020.10.016
Impact of COVID-19 on the social, economic, environmental and energy domains: Lessons learnt from a global pandemic
Abstract
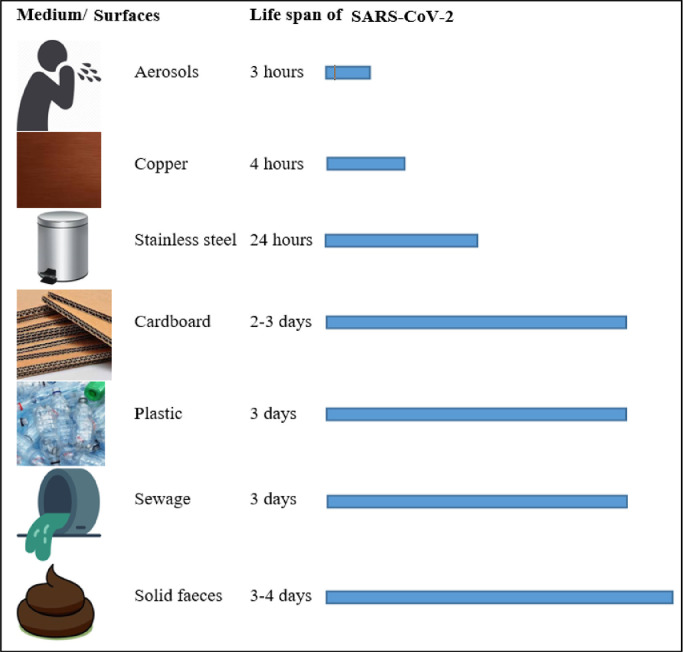
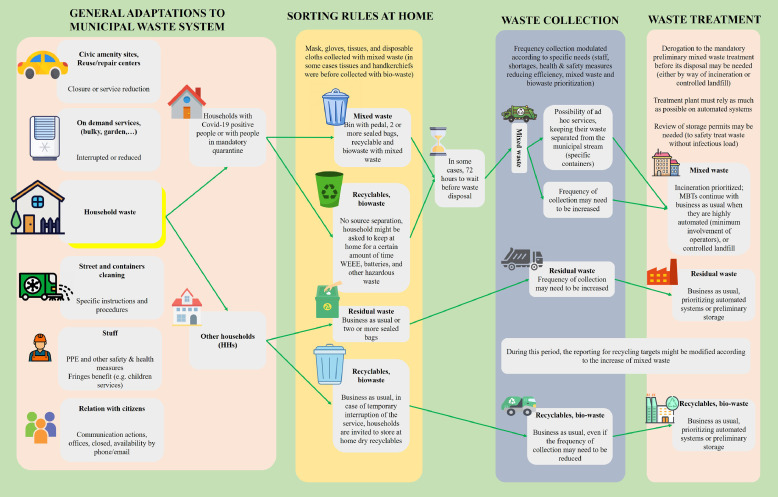
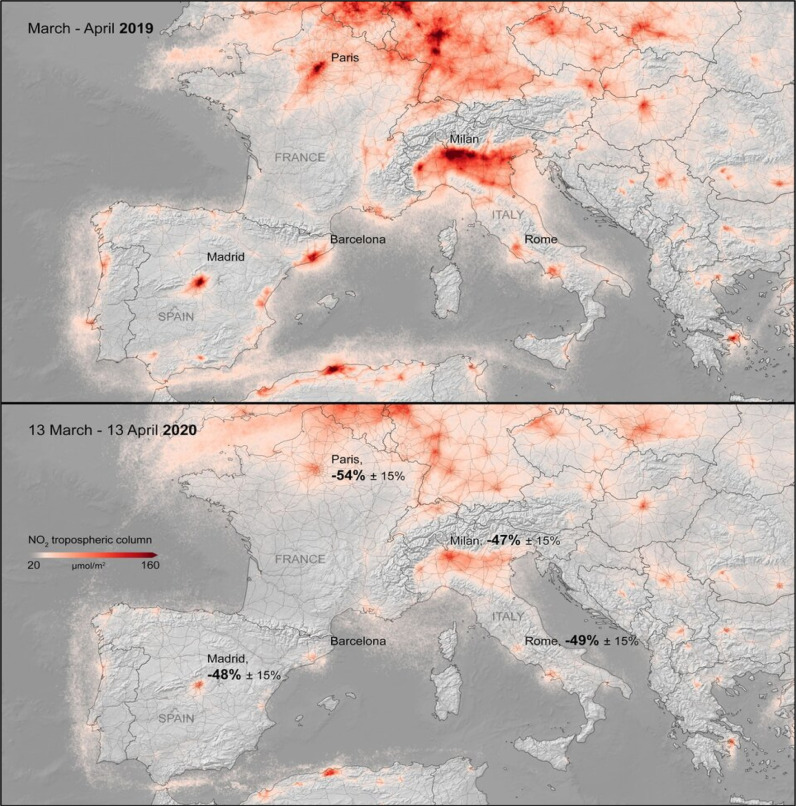
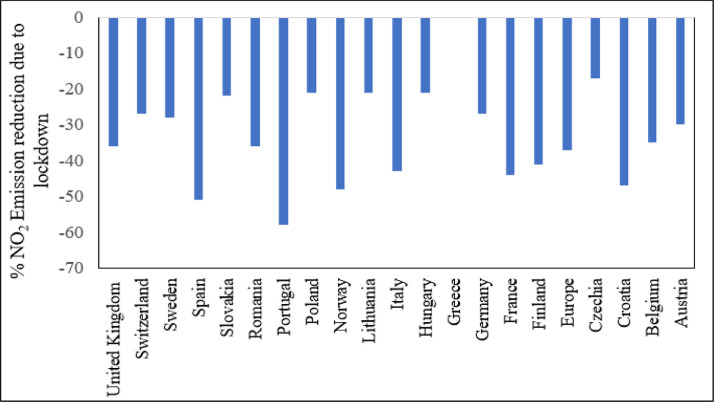
COVID-19 has heightened human suffering, undermined the economy, turned the lives of billions of people around the globe upside down, and significantly affected the health, economic, environmental and social domains. This study aims to provide a comprehensive analysis of the impact of the COVID-19 outbreak on the ecological domain, the energy sector, society and the economy and investigate the global preventive measures taken to reduce the transmission of COVID-19. This analysis unpacks the key responses to COVID-19, the efficacy of current initiatives, and summarises the lessons learnt as an update on the information available to authorities, business and industry. This review found that a 72-hour delay in the collection and disposal of waste from infected households and quarantine facilities is crucial to controlling the spread of the virus. Broad sector by sector plans for socio-economic growth as well as a robust entrepreneurship-friendly economy is needed for the business to be sustainable at the peak of the pandemic. The socio-economic crisis has reshaped investment in energy and affected the energy sector significantly with most investment activity facing disruption due to mobility restrictions. Delays in energy projects are expected to create uncertainty in the years ahead. This report will benefit governments, leaders, energy firms and customers in addressing a pandemic-like situation in the future.
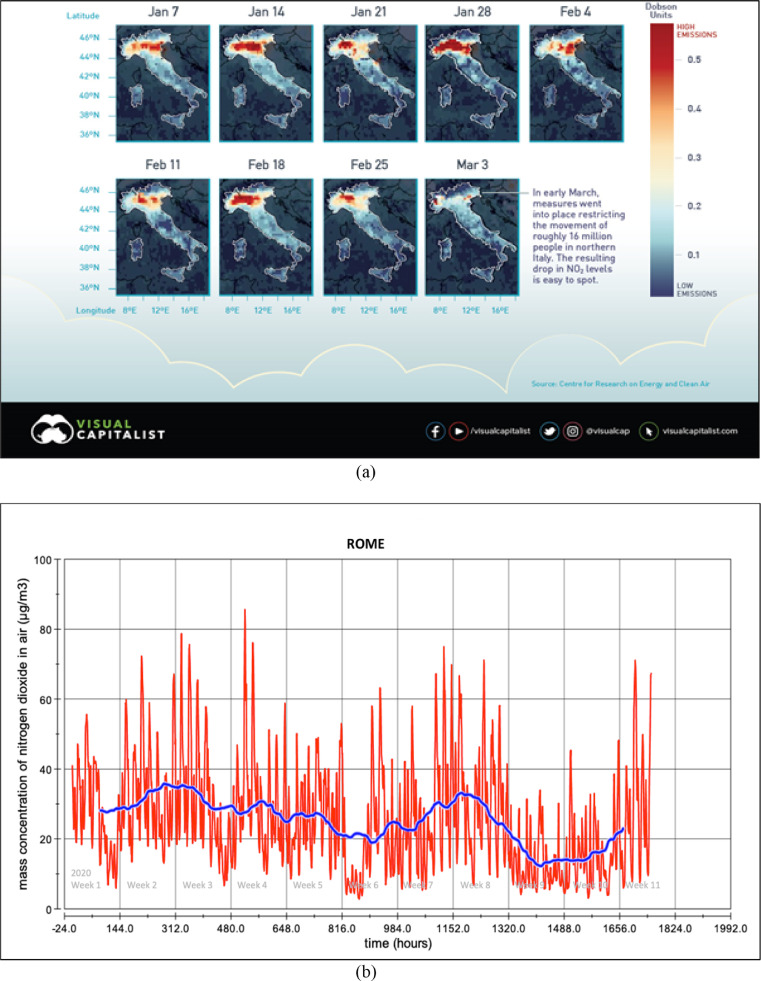
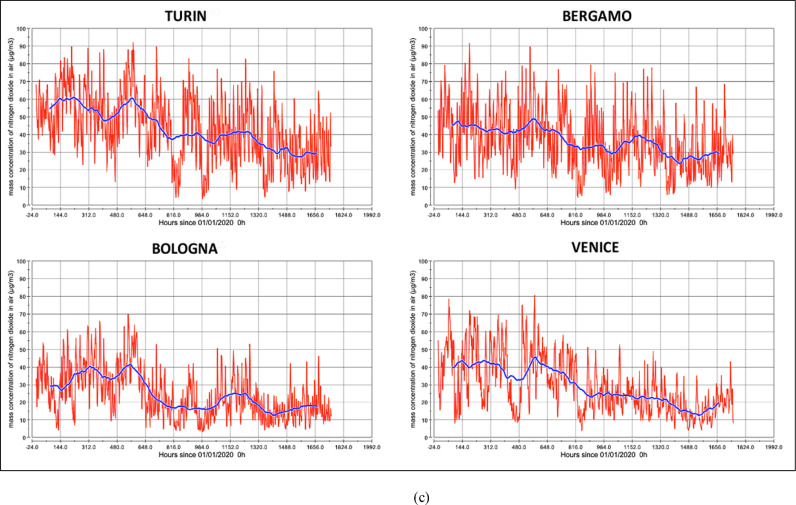
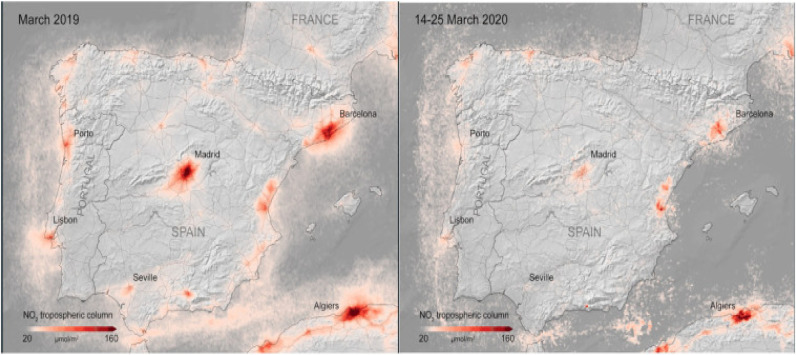
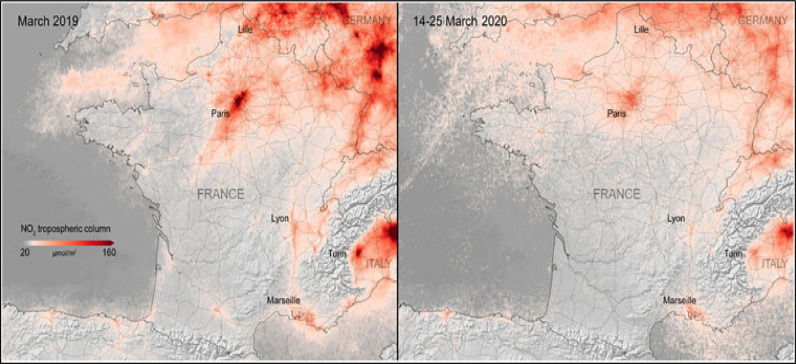
Keywords: Coronavirus vaccine; Environmental pollution; Global Pandemic; NO2 emission; PM emission; SARS-CoV-2; Waste generation.
© 2020 Institution of Chemical Engineers. Published by Elsevier B.V. All rights reserved.
Conflict of interest statement
The authors declare that they have no known competing financial interests or personal relationships that could have appeared to influence the work reported in this paper.
Figures
References
-
- ACR+, Municipal waste management and COVID-19. URL: https://www.acrplus.org/en/municipal-waste-management-covid-19. Date accessed: 22nd September, 2020. 2020.
-
- AEMO, COVID-19 demand impact in Australia. https://aemo.com.au/en/news/demand-impact-australia-covid19. Date accessed: 21st September, 2020. 2020.
Publication types
LinkOut - more resources
Full Text Sources
Other Literature Sources
Miscellaneous