

Impact of population density on Covid-19 infected and mortality rate in India
- PMID: 33072850
- PMCID: PMC7553801
- DOI: 10.1007/s40808-020-00984-7
Impact of population density on Covid-19 infected and mortality rate in India
Abstract
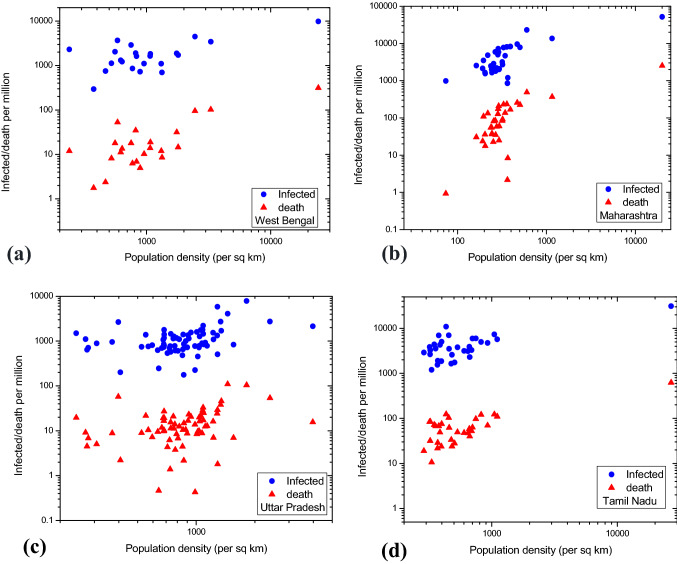
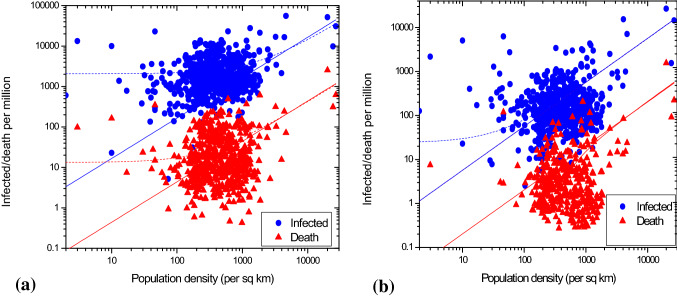
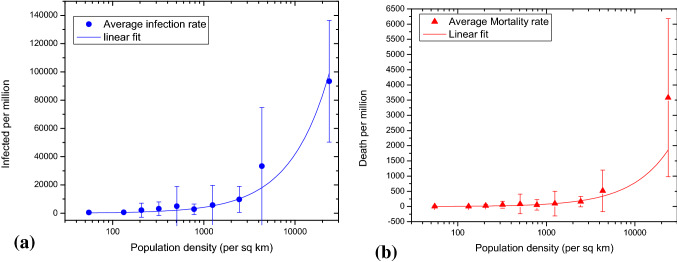
The Covid-19 is a highly contagious disease which becomes a serious global health concern. The residents living in areas with high population density, such as big or metropolitan cities, have a higher probability to come into close contact with others and consequently any contagious disease is expected to spread rapidly in dense areas. However, recently, after analyzing Covid-19 cases in the USA researchers at the Johns Hopkins Bloomberg School of Public Health, London school of economics, and IZA-Institute of Labour Economics conclude that the spread of Covid-19 is not linked with population density. Here, we investigate the influence of population density on Covid-19 spread and related mortality in the context of India. After a detailed correlation and regression analysis of infection and mortality rates due to Covid-19 at the district level, we find moderate association between Covid-19 spread and population density.
Keywords: Covid-19; India; Infection and mortality rate; Population density.
© Springer Nature Switzerland AG 2020.
Conflict of interest statement
Conflict of interestThere is no conflict of interest between the authors.
Figures
References
-
- Carozzi F, Provenzano S, Roth S (2020) Urban density and COVID-19, discussion paper series, IZA Institure of Labor economics, IZA DP No. 13440
LinkOut - more resources
Full Text Sources