

Validation of a Fast, Robust, Inexpensive, Two-Tiered Neonatal Screening Test algorithm on Dried Blood Spots for Spinal Muscular Atrophy
- PMID: 33072980
- PMCID: PMC7510214
- DOI: 10.3390/ijns5020021
Validation of a Fast, Robust, Inexpensive, Two-Tiered Neonatal Screening Test algorithm on Dried Blood Spots for Spinal Muscular Atrophy
Abstract
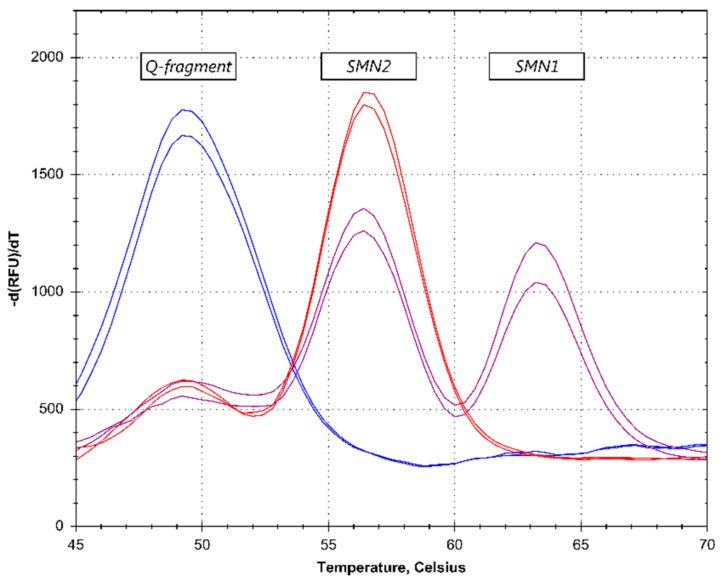
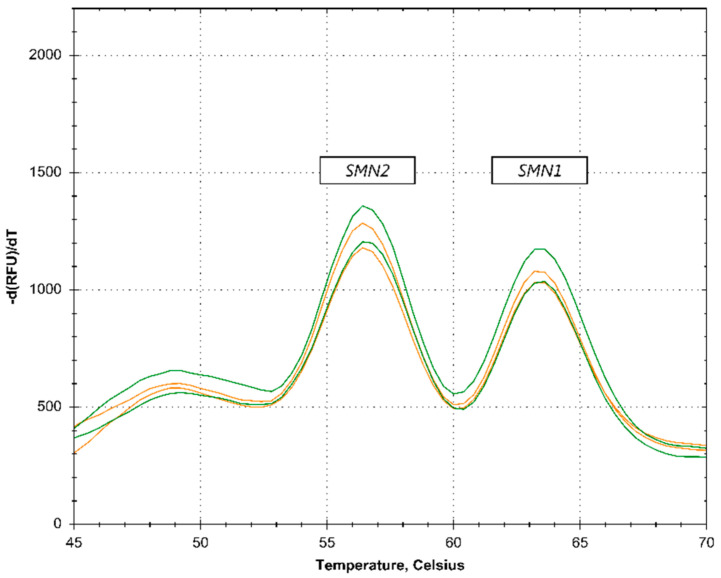
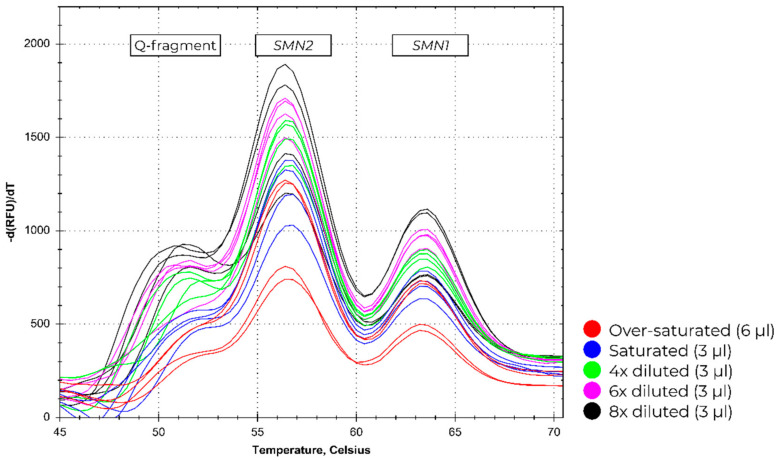
Spinal muscular atrophy (SMA) is one of the leading genetic causes of infant mortality with an incidence of 1:10,000. The recently-introduced antisense oligonucleotide treatment improves the outcome of this disease, in particular when applied at an early stage of progression. The genetic cause of SMA is, in >95% of cases, a homozygous deletion of the survival motor neuron 1 (SMN1) gene, which makes the low-cost detection of SMA cases as part of newborn screening programs feasible. We developed and validated a new SALSA MC002 melting curve assay that detects the absence of the SMN1 exon 7 DNA sequence without detecting asymptomatic carriers and reliably discriminates SMN1 from its genetic homolog SMN2 using crude extracts from newborn screening cards. Melting curve analysis shows peaks specific for both the SMN1 gene and the disease modifying SMN2 homolog. The detection of the SMN2 homolog, of which the only clinically relevant difference from the SMN1 gene is a single nucleotide in exon 7, was only used to confirm a correct reaction in samples that lacked the SMN1 gene, and not for SMN2 quantification. We retrieved 47 DBS samples from children with genetically-confirmed SMA, after informed consent from parents, and 375 controls from the national archive of the Dutch National Institute for Public Health and the Environment (RIVM). The assay correctly identified all anonymized and randomized SMA and control samples (i.e., sensitivity and specificity of 100%), without the detection of carriers, on the three most commonly-used PCR platforms with melting curve analysis. This test's concordance with the second-tier 'golden standard' P021 SMA MLPA test was 100%. Using the new P021-B1 version, crude extracts from DBS cards could also be used to determine the SMN2 copy number of SMA patients with a high level of accuracy. The MC002 test showed the feasibility and accuracy of SMA screening in a neonatal screening program.
Keywords: SMA; copy numbers SMN1 and SMN2 gene; melting curve; newborn screening; two-tiered testing.
© 2019 by the authors.
Conflict of interest statement
Conflicts of InterestAuthors A.R.S., C.H., E.M.S., and R.S. are employees at MRC-Holland. Author J.S. is a founder and co-owner of MRC-Holland. All other authors declare no conflict of interest.
Figures

References
-
- Darras B.T. Spinal muscular atrophies. Pediatr. Clin. N. Am. 2015;62:743–766. - PubMed
-
- Lefebvre S., Burglen L., Reboullet S., Clermont O., Burlet P., Viollet L., Benichou B., Cruaud C., Millasseau P., Zeviani M., et al. Identification and characterization of a spinal muscular atrophy-determining gene. Cell. 1995;80:155–165. - PubMed
LinkOut - more resources
Full Text Sources
