. 2020 Aug 27;5(40):25655-25667.
doi: 10.1021/acsomega.0c02760. eCollection 2020 Oct 13.

Molecular View into the Cyclodextrin Cavity: Structure and Hydration

Affiliations

Molecular View into the Cyclodextrin Cavity: Structure and Hydration

Avilasha A Sandilya et al. ACS Omega. .

Abstract

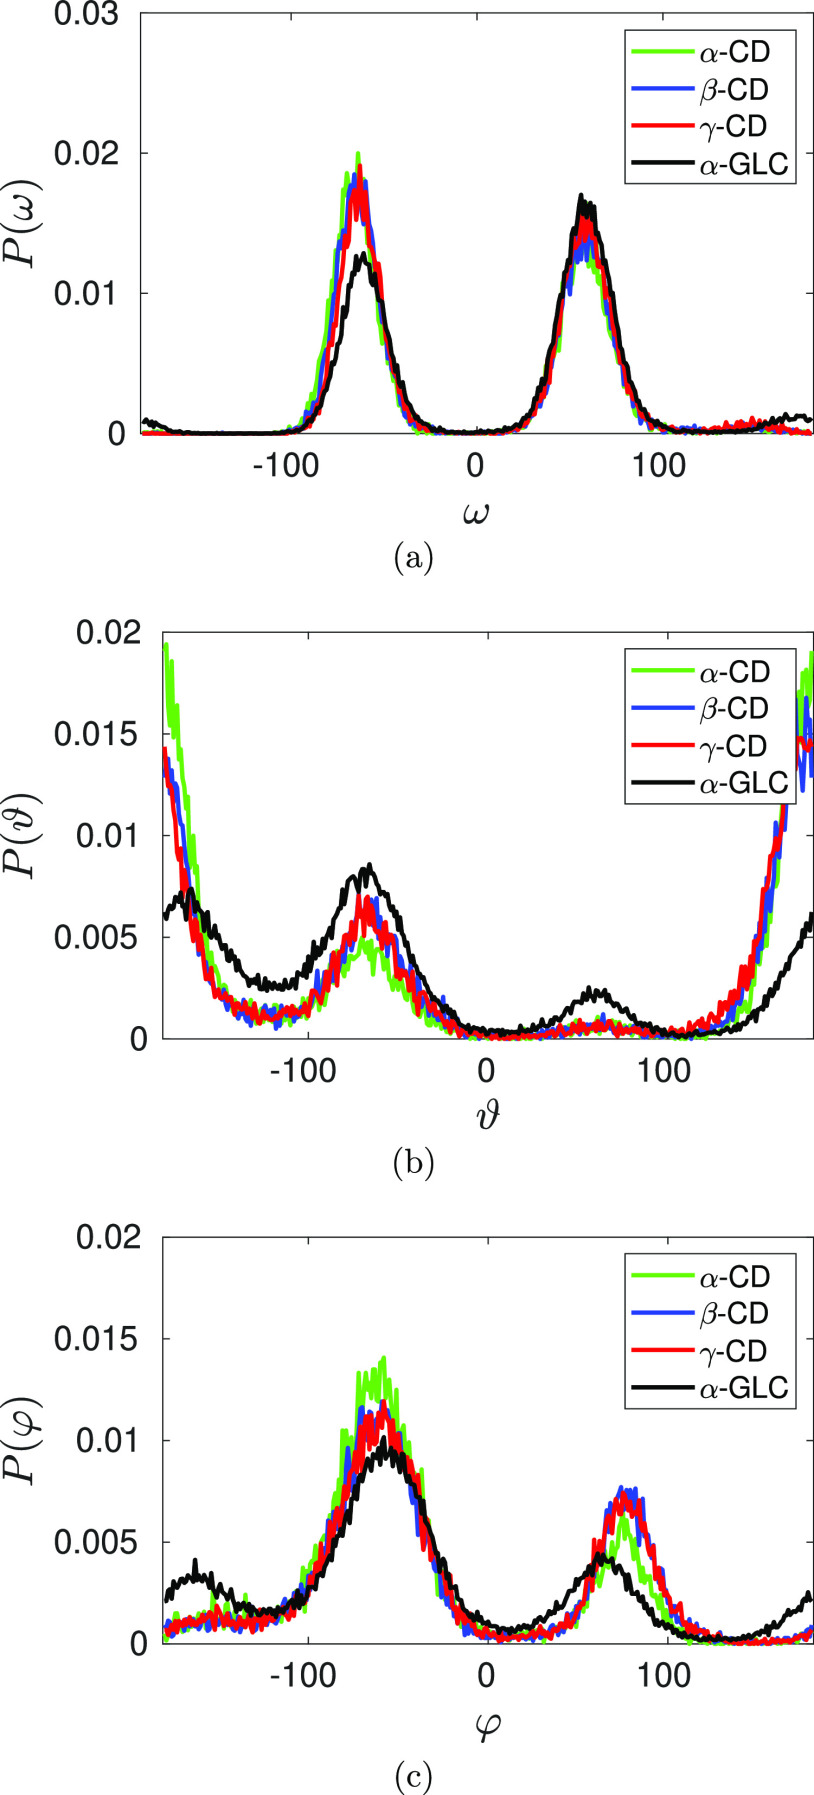
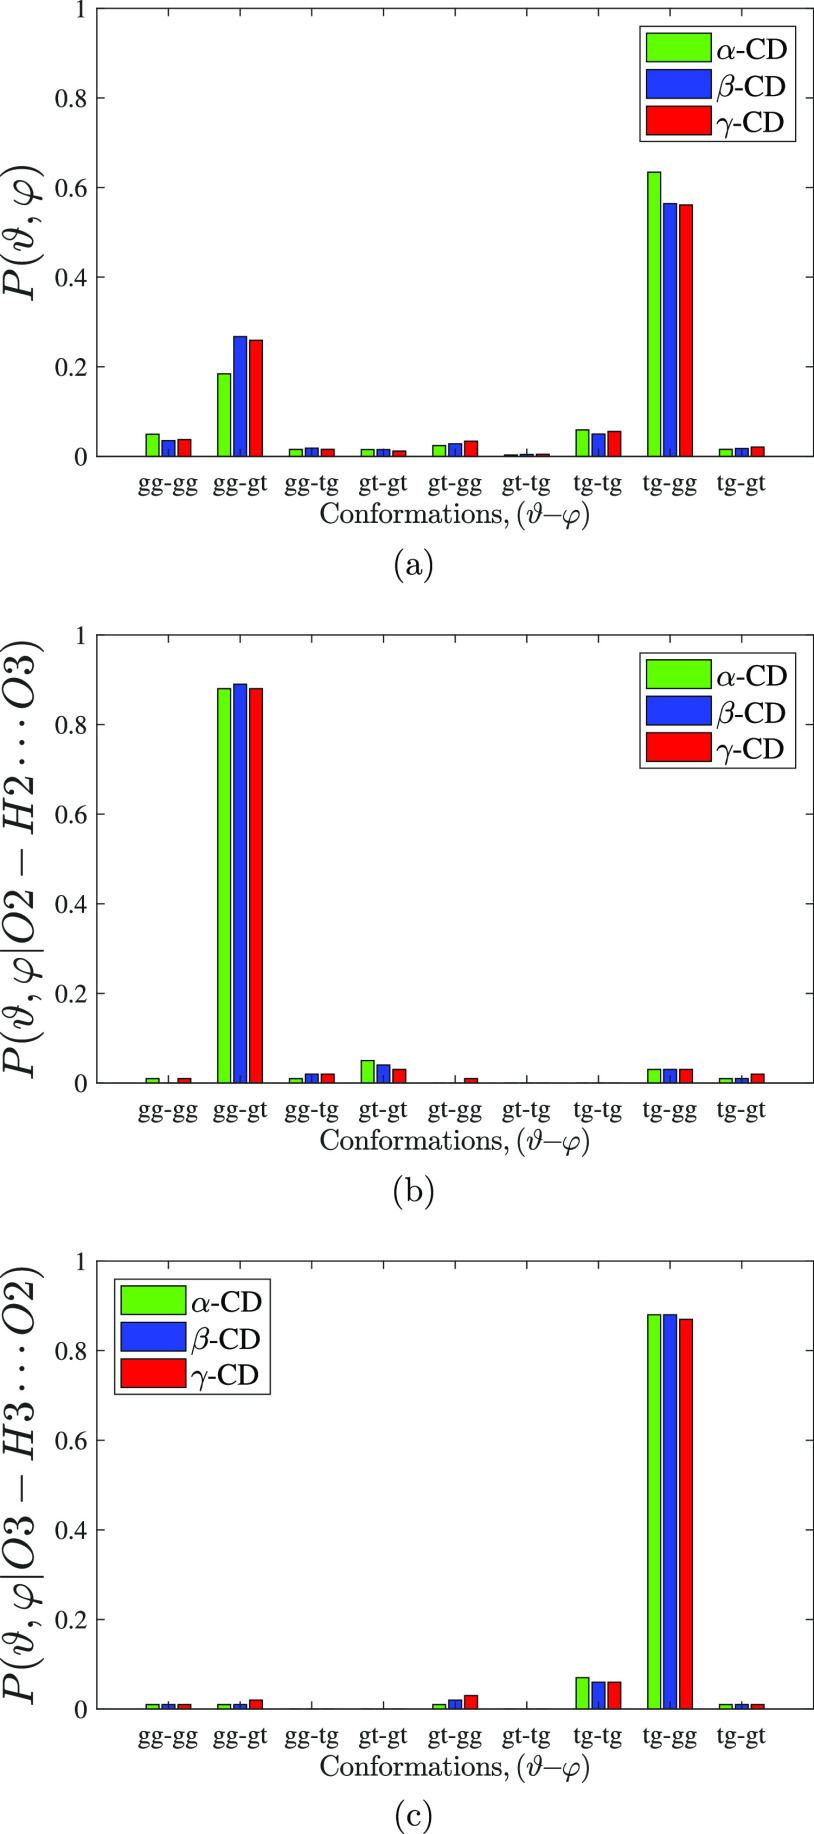
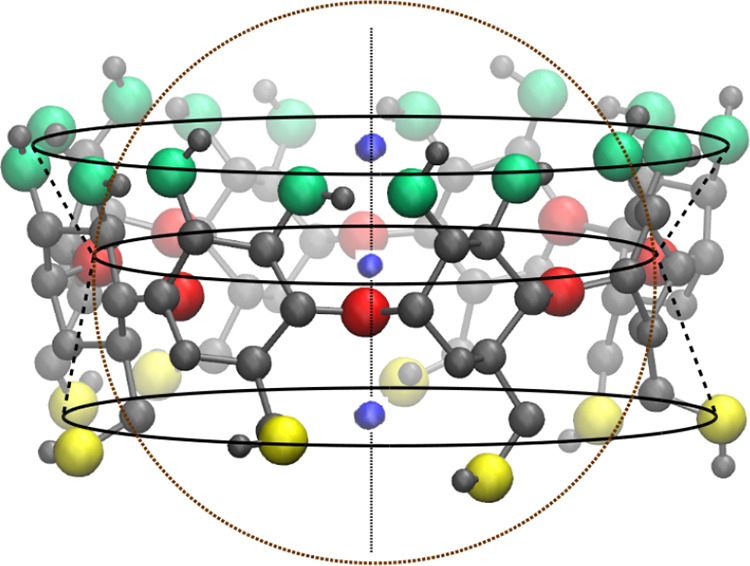
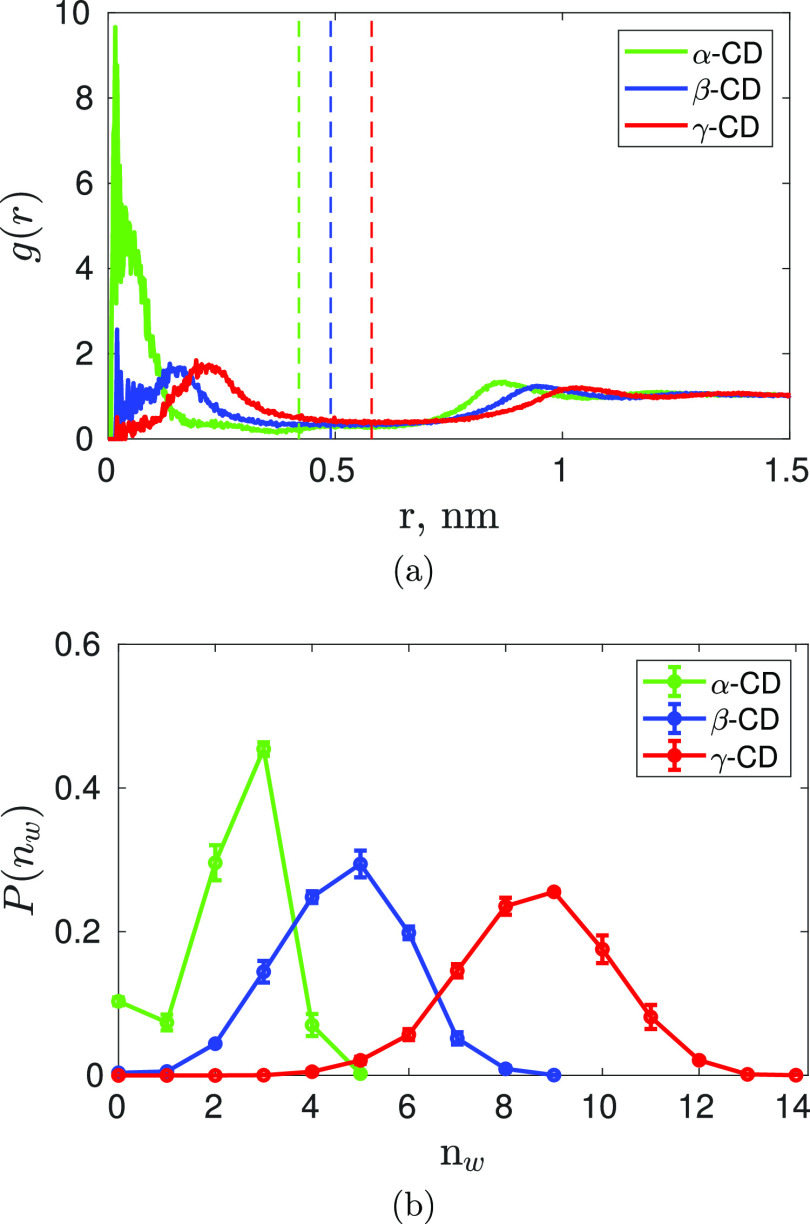
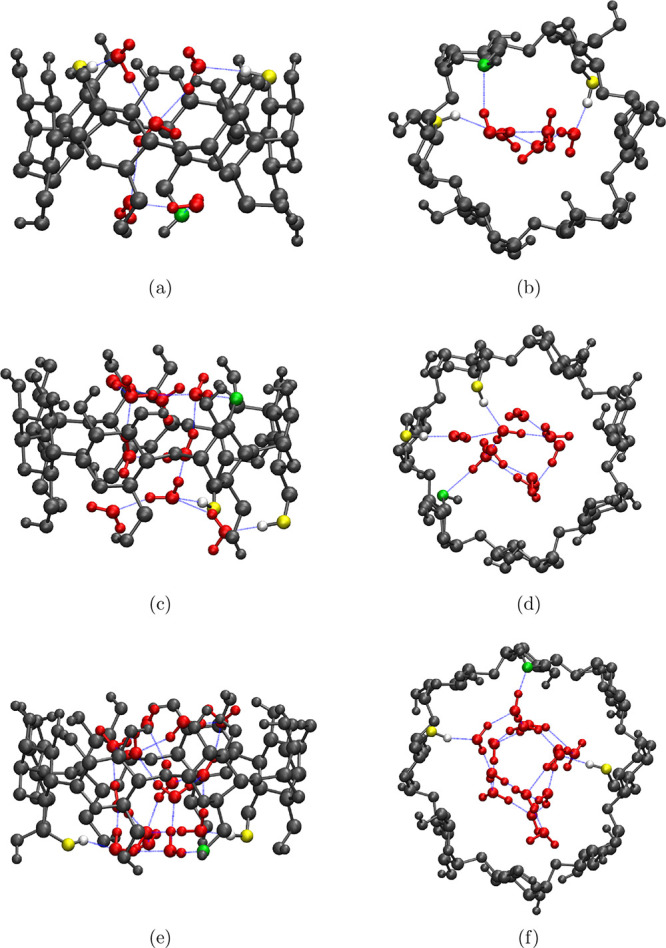
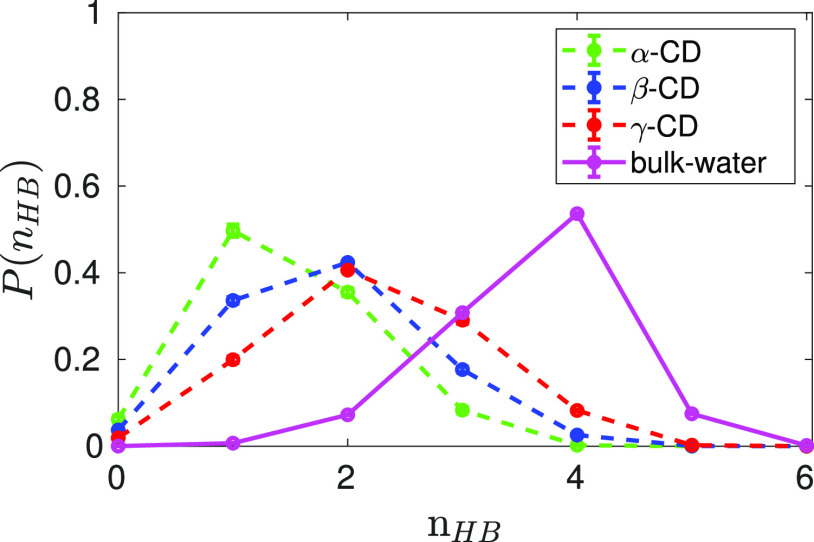
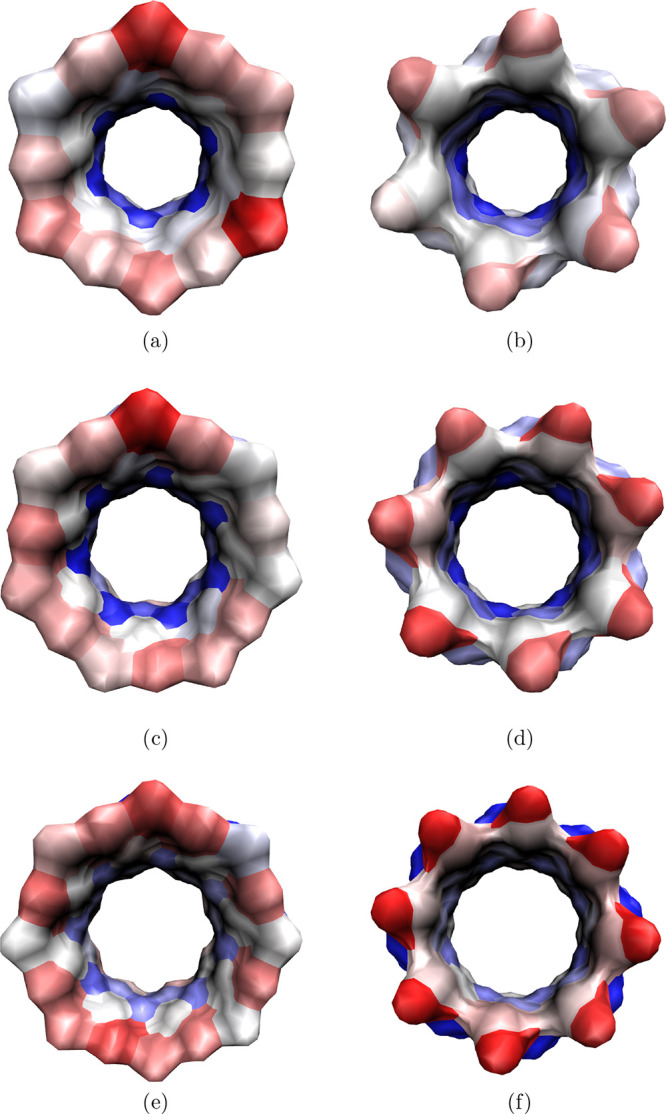
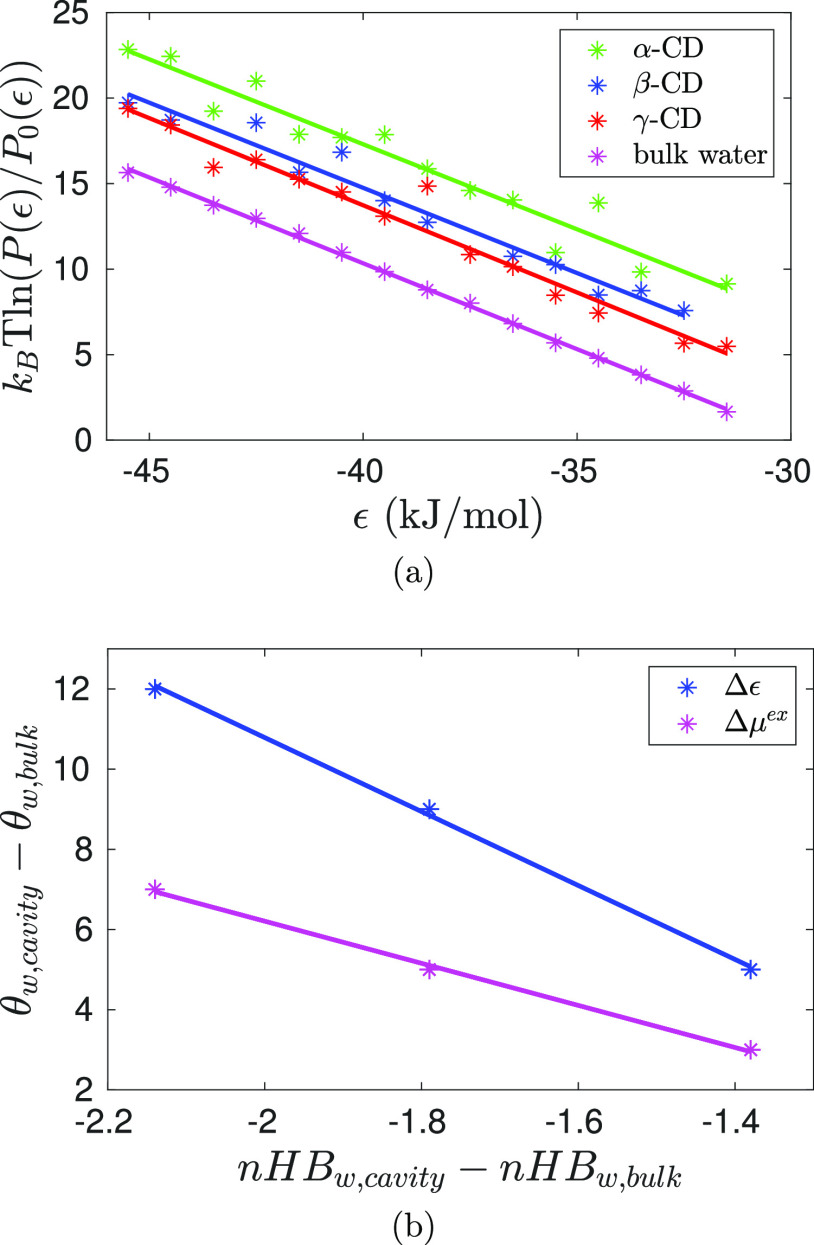
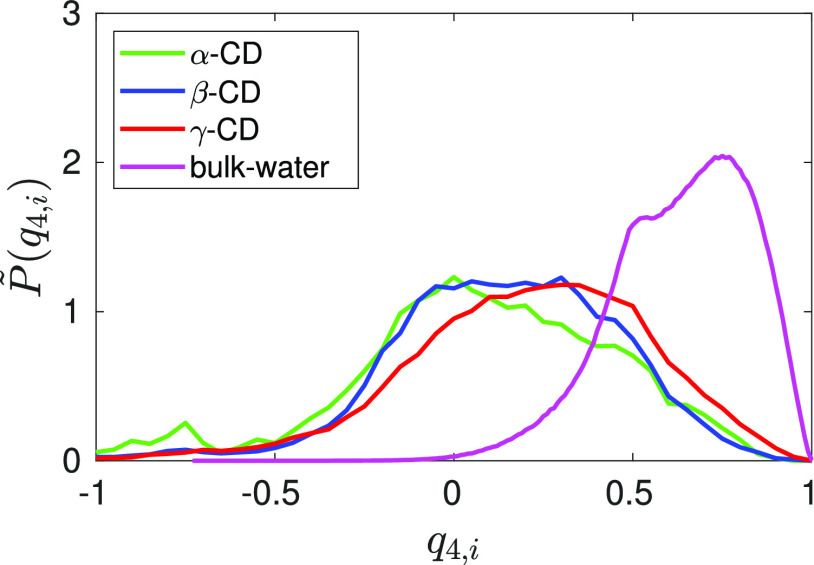
We find, through atomistic molecular dynamics simulation of native cyclodextrins (CDs) in water, that although the outer surface of a CD appears like a truncated cone, the inner cavity resembles a conical hourglass because of the inward protrusion of the glycosidic oxygens. Furthermore, the conformations of the constituent α-glucose molecules are found to differ significantly from a free monomeric α-glucose molecule. This is the first computational study that maps the conformational change to the preferential hydrogen bond donating capacity of one of the secondary hydroxyl groups of CD, in consensus with an NMR experiment. We have developed a simple and novel geometry-based technique to identify water molecules occupying the nonspherical CD cavity, and the computed water occupancies are in close agreement with the experimental and density functional theory studies. Our analysis reveals that a water molecule in CD cavity loses out about two hydrogen bonds and remains energetically frustrated but possesses higher orientational degree of freedom compared to bulk water. In the context of CD-drug complexation, these imply a nonclassical, that is, enthalpically driven hydrophobic association of a drug in CD cavity.


Conflict of interest statement

The authors declare no competing financial interest.

Figures

Figure 1
Figure 1
Comparison of the conformational distribution of the primary hydroxyl groups defined by the dihedral angle ω ≡ O5–C5–C6–O6 (a) and of the secondary hydroxyl groups defined by the dihedral angles ϑ ≡ H3–O3–C3–C2 (b) and φ ≡ H2–O2–C2–C3 (c) of the constituent α-glucose molecules in native CD with that of a free α-glucose monomer in water. Color code: green—α-CD; blue—β-CD; red—γ-CD, and black—α-glucose monomer.
Figure 2
Figure 2
Joint probability distribution of the secondary hydroxyl groups in all possible combinations of the conformations defined by the dihedral angles ϑ ≡ H3–O3–C3–C2 and φ ≡ H2–O2–C2–C3, observed during the simulation (a); and conditional joint probability distribution when the hydrogen bond of types O2–H2···O3 (b) and O3–H3···O2 (c) exists. Conformations are classified as gg, gt, and tg when the characterizing dihedral angle is in the range (−120, 0), (0, 120), and (120, −120), respectively.
Figure 3
Figure 3
VMD snapshot of γ-CD showing the conical hourglass structure of the CD cavity as radius of glycosidic rim (O1 atoms—red spheres) is smaller than the outer secondary hydroxyl rim (O2 and O3 atoms—green spheres) and the primary hydroxyl rim (O6 atoms—yellow spheres). The small blue spheres are the centers of mass of O2 atoms, O1 atoms, and O6 atoms; the three centers of mass are collinear. The height of the bottom cone (0.31 nm) is larger than the height of the top cone (0.24 nm). The dotted circle represents the spherical region of O1 rim radius, demonstrating that such spherical approximation of cavity significantly deviates from the actual cavity geometry.
Figure 4
Figure 4
(a) Radial distribution function for oxygen of water molecules around the geometric center (center of mass) of native CDs. The dashed vertical lines represent the radial cut-off distances corresponding to the CD wall from their respective centers, used to calculate the water coordination number in the inner region of CD ring. (b) Probability distribution of water occupancy (nw) inside the cavity of native CDs as identified by our geometry-based approach. Color code: green—α-CD; blue—β-CD, and red—γ-CD.
Figure 5
Figure 5
VMD snapshots showing the structure of native CDs (gray CPK representation) when maximum number of water molecules (red CPK representation)—5 in α-CD (a,b); 9 in β-CD (c,d); and 14 in γ-CD (e,f)—are occupying their cavity. Blue lines correspond to hydrogen bonds, green and yellow spheres are the CD heavy atoms accepting and donating (the associated hydrogen is shown in white) hydrogen bonds, respectively, with the cavity waters. Side view—a,c and e; the bottom view—b,d and f.
Figure 6
Figure 6
Comparing the probability distribution of number of hydrogen bonds, nHB, per water molecule inside CD cavity to that in bulk water. Color code: green—α-CD; blue—β-CD; red—γ-CD; and magenta—bulk water.
Figure 7
Figure 7
VMD snapshots showing the colored surface of the cavity of native CDs—α-CD (a,b); β-CD (c,d); and γ-CD (e,f)—showing the gradient in the average binding energy of water proximal to the CD surface relative to the average binding energy of water in bulk medium. Top view (perspective through the secondary hydroxyl rim)—a,c and e; the bottom view (perspective through the primary hydroxyl rim)—b,d and f. The colors red, white, and blue correspond to favorable, comparable, and unfavorable binding energies, respectively, with respect to the average binding energy in bulk water.
Figure 8
Figure 8
(a) Estimation of the excess solvation chemical potential of a water molecule, inside CD cavity and in bulk water, from the histogram overlap method. Color code: green—α-CD; blue—β-CD; red—γ-CD, and magenta—bulk water. (b) Difference in the binding energies (Δϵ = ϵw,cavity – ϵw,bulk) and the excess chemical potentials of solvation (Δμex = μw,cavityex – μw,bulkex) of a water molecule in CD cavity and in bulk water are strongly correlated to the hydrogen bond deficiency of the intra cavity water molecule. Color code: blue—Δϵ and magenta—Δμex. Symbols are the simulation data, and the lines are the linear fit.
Figure 9
Figure 9
Comparing the probability density of tetrahedral order parameter, q4,i, of a water molecule inside CD cavity to that in bulk water. The probability of finding the parameter, q4,i, in an interval (a,b) can be obtained by integrating the probability density distribution: P(aq4,ib) = ∫ab(q4,i)dq4,i. Color code: green—α-CD; blue—β-CD; red—γ-CD; and magenta—bulk water.

References

    1. Saenger W. Cyclodextrin Inclusion Compounds in Research and Industry. Angew. Chem., Int. Ed. 1980, 19, 344–362. 10.1002/anie.198003441. - DOI
    1. Szejtli J. Introduction and General Overview of Cyclodextrin Chemistry. Chem. Rev. 1998, 98, 1743–1754. 10.1021/cr970022c. - DOI - PubMed
    1. Connors K. A. The Stability of Cyclodextrin Complexes in Solution. Chem. Rev. 1997, 97, 1325–1358. 10.1021/cr960371r. - DOI - PubMed
    1. Saenger W.; Jacob J.; Gessler K.; Steiner T.; Hoffmann D.; Sanbe H.; Koizumi K.; Smith S. M.; Takaha T. Structures of the Common Cyclodextrins and Their Larger Analogues Beyond the Doughnut. Chem. Rev. 1998, 98, 1787–1802. 10.1021/cr9700181. - DOI - PubMed
    1. Betzel C.; Saenger W.; Hingerty B. E.; Brown G. M. Topography of cyclodextrin inclusion complexes, part 20. Circular and flip-flop hydrogen bonding in .beta.-cyclodextrin undecahydrate: a neutron diffraction study. J. Am. Chem. Soc. 1984, 106, 7545–7557. 10.1021/ja00336a039. - DOI