. 2020 Sep 29;5(40):25868-25881.
doi: 10.1021/acsomega.0c03209. eCollection 2020 Oct 13.

Final-State Simulations of Core-Level Binding Energies at Metal-Organic Hybrid Interfaces: Artifacts Caused by Spurious Collective Electrostatic Effects

Affiliations

Final-State Simulations of Core-Level Binding Energies at Metal-Organic Hybrid Interfaces: Artifacts Caused by Spurious Collective Electrostatic Effects

Thomas C Taucher et al. ACS Omega. .

Abstract

Core-level energies are frequently calculated to explain the X-ray photoelectron spectra of metal-organic hybrid interfaces. The current paper describes how such simulations can be flawed when modeling interfaces between physisorbed organic molecules and metals. The problem occurs when applying periodic boundary conditions to correctly describe extended interfaces and simultaneously considering core hole excitations in the framework of a final-state approach to account for screening effects. Since the core hole is generated in every unit cell, an artificial dipole layer is formed. In this work, we study methane on an Al(100) surface as a deliberately chosen model system for hybrid interfaces to evaluate the impact of this computational artifact. We show that changing the supercell size leads to artificial shifts in the calculated core-level energies that can be well beyond 1 eV for small cells. The same applies to atoms at comparably large distances from the substrate, encountered, for example, in extended, upright-standing adsorbate molecules. We also argue that the calculated work function change due to a core-level excitation can serve as an indication for the occurrence of such an artifact and discuss possible remedies for the problem.


Conflict of interest statement

The authors declare no competing financial interest.

Figures

Figure 1
Figure 1
Largest supercell of the methane/Al(100) interface investigated in the present study. The black box indicates the smallest considered supercell (2 × 2 surface unit cell of Al(100); base area of 33 Å2), while the colored box shows the biggest supercell (12 × 12, with a base area of 1181 Å2 and containing 36 methane molecules). In the bottom image, only a part of the vacuum gap is shown.
Figure 2
Figure 2
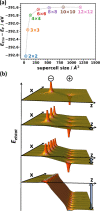
(a) C 1s core-level binding energy of methane adsorbed on Al(100) as a function of the chosen supercell size for calculations employing the final-state approach within the Slater–Janak transition-state approximation. (b) Electrostatic energy landscape for an electron generated by an isolated pair of a negative and a positive point charge (top panel) and by two oppositely charged, square periodic, 2D arrays of point charges (three lower panels). The distances between the charges in the arrays in the three lower panels scale as 3:2:1, and their packing densities scale as 1/9:1/4:1. While the electron electrostatic energy becomes constant for the isolated dipole in the top panel, there is a step in energy for the pairs of periodic charge arrays. These steps are schematically indicated by the blue arrows.
Figure 3
Figure 3
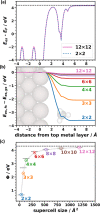
(a) Plane-averaged electrostatic energy of the methane/Al(100) interface for the smallest (2 × 2; dotted blue line) and largest (12 × 12; solid pink line) cells. The work function on the methane side of the slab amounts to 4.31 eV, while on the Al side it is 4.40 eV (yielding an adsorption-induced work function change of 0.09 eV; see the dashed horizontal line). (b) Calculated change in the plane-averaged electrostatic energy between a final-state calculation (including a half core-hole excitation), Ees,fs, and the ground state, Ees,gs for different excitation densities caused by different supercell sizes. The latter are denoted directly in the graph (the lines for the 8 × 8 (violet) and 10 × 10 (brown) cells are not labeled due to the limited available space). (c) Work function, Φ, of the systems with a half core-hole excitation per supercell on the methane side of the slab. The work function obtained in the ground-state calculation is indicated by the dashed black line at 4.31 eV. The work functions on the Al side essentially do not change, as shown in the Supporting Information (Section 7). The values obtained with the simple electrostatic model in the main text are indicated as short horizontal lines for the corresponding supercells.
Figure 4
Figure 4
Calculated difference in electrostatic energy between the final-state and the ground-state calculations for the 2 × 2 (top) and the 12 × 12 (bottom) cells. The values are plotted for a plane parallel to one of the unit cell axes, containing the nuclei of the C atoms. The overlaid atomic structure of the interface is shaded in the right half of the plots to better resolve changes in electrostatic energy close to the nuclei. Furthermore, only part of the 12 × 12 supercell is shown and the 2 × 2 unit cell is repeated four times in the vertical direction.
Figure 5
Figure 5
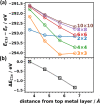
(a) C 1s core-level energies for methane on Al(100) relative to the Fermi level for different unit cell sizes and different adsorption heights of the methane molecule (blue: 2 × 2 unit cell, orange: 3 × 3 supercell, green: 4 × 4 supercell, red: 6 × 6 supercell, violet: 8 × 8 supercell, brown: 10 × 10 supercell). No data points for 12 × 12 supercells could be included in this plot, as for this very large cell we failed to converge the SCF cycle in the calculations for increased adsorption distances. (b) Difference in core-level energies between the 10 × 10 and the 4 × 4 supercells.
Figure 6
Figure 6
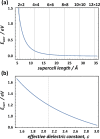
(a) Dependence of the point-charge-derived correction energy calculated employing eq 1, Ecorr, on the size of the unit cell, with ε set to 2.1. The vertical lines denote supercells considered in the present manuscript. In the simulation, the actual lattice constant of our model system (5.728 Å), the optimized adsorption distance of 3.678 Å, an image plane of 1.59 Å above the topmost Al layer, and half an elementary charge at every point charge position have been used. (b) Dependence of the point charge-derived correction energy calculated employing eq 1, Ecorr, on the effective dielectric constant describing screening processes at the interface. The vertical line at a dielectric constant of 2.1 indicates the situation quoted in the main manuscript. The simulations have been performed using Mathematica.

References

    1. Egelhoff W. F. Core-Level Binding-Energy Shifts at Surfaces and in Solids. Surf. Sci. Rep. 1987, 6, 253–415. 10.1016/0167-5729(87)90007-0. - DOI
    1. Bagus P. S.; Ilton E. S.; Nelin C. J. The Interpretation of XPS Spectra: Insights into Materials Properties. Surf. Sci. Rep. 2013, 68, 273–304. 10.1016/j.surfrep.2013.03.001. - DOI
    1. Abu-Husein T.; Schuster S.; Egger D. A.; Kind M.; Santowski T.; Wiesner A.; Chiechi R.; Zojer E.; Terfort A.; Zharnikov M. The Effects of Embedded Dipoles in Aromatic Self-Assembled Monolayers. Adv. Funct. Mater. 2015, 25, 3943–3957. 10.1002/adfm.201500899. - DOI
    1. Taucher T. C.; Hehn I.; Hofmann O. T.; Zharnikov M.; Zojer E. Understanding Chemical versus Electrostatic Shifts in X-Ray Photoelectron Spectra of Organic Self-Assembled Monolayers. J. Phys. Chem. C 2016, 120, 3428–3437. 10.1021/acs.jpcc.5b12387. - DOI - PMC - PubMed
    1. Zojer E.; Taucher T. C.; Hofmann O. T. The Impact of Dipolar Layers on the Electronic Properties of Organic/Inorganic Hybrid Interfaces. Adv. Mater. Interfaces 2019, 6, 190058110.1002/admi.201900581. - DOI