

A Prediction Model to Prioritize Individuals for a SARS-CoV-2 Test Built from National Symptom Surveys
- PMID: 33073258
- PMCID: PMC7547576
- DOI: 10.1016/j.medj.2020.10.002
A Prediction Model to Prioritize Individuals for a SARS-CoV-2 Test Built from National Symptom Surveys
Abstract
Background: The gold standard for COVID-19 diagnosis is detection of viral RNA through PCR. Due to global limitations in testing capacity, effective prioritization of individuals for testing is essential.
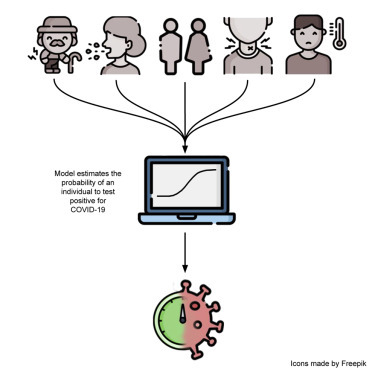
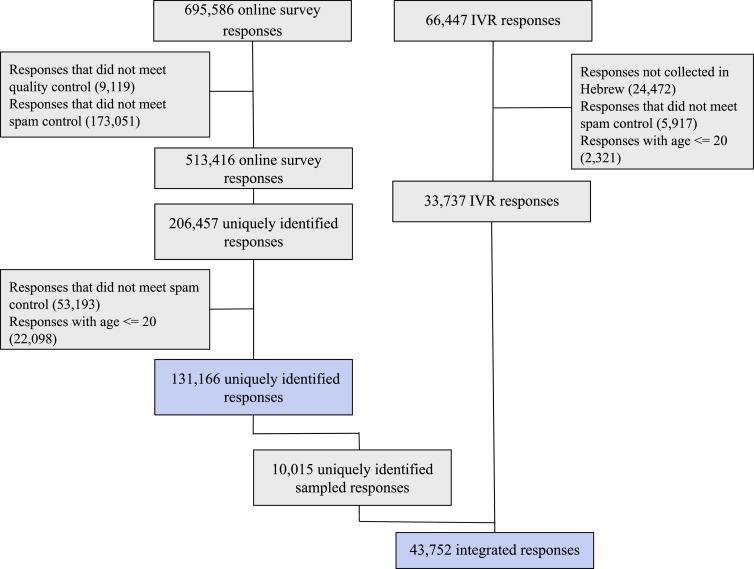
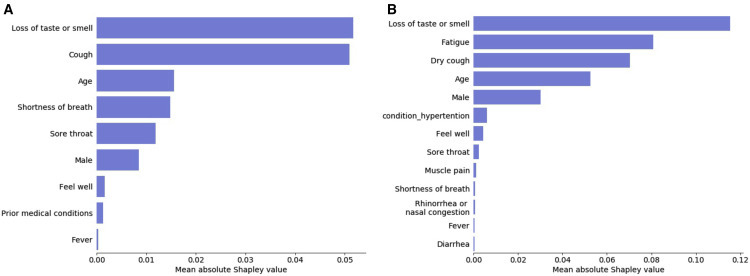
Methods: We devised a model estimating the probability of an individual to test positive for COVID-19 based on answers to 9 simple questions that have been associated with SARS-CoV-2 infection. Our model was devised from a subsample of a national symptom survey that was answered over 2 million times in Israel in its first 2 months and a targeted survey distributed to all residents of several cities in Israel. Overall, 43,752 adults were included, from which 498 self-reported as being COVID-19 positive.
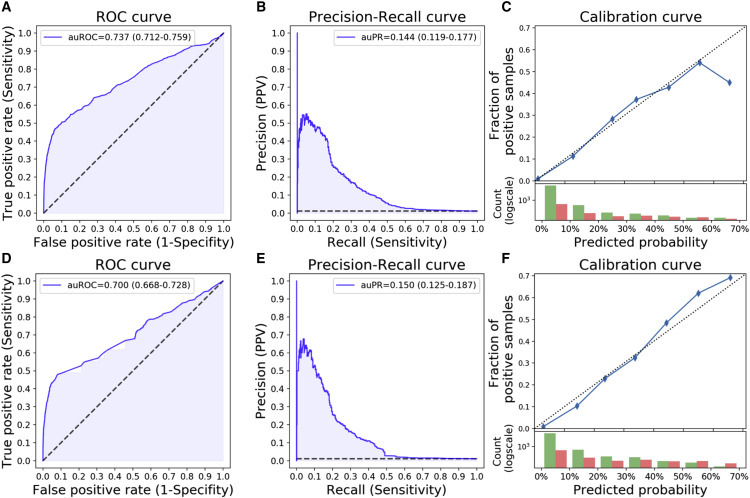
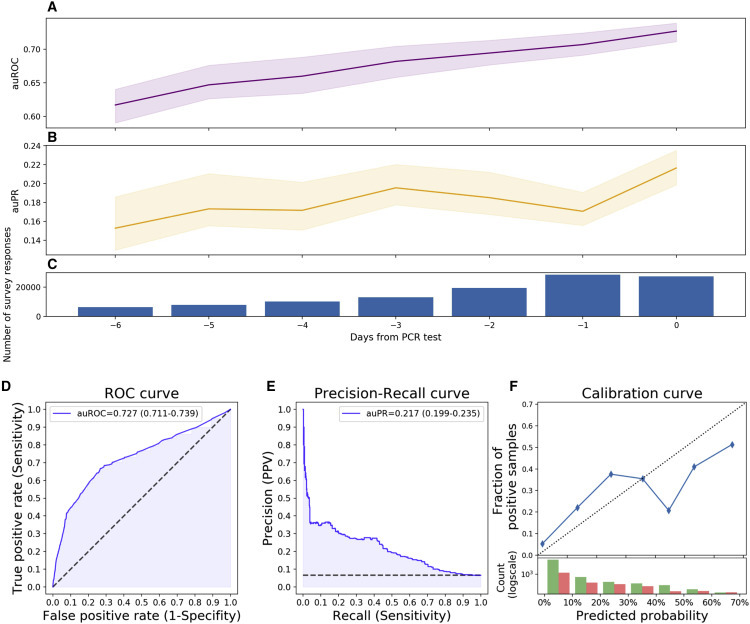
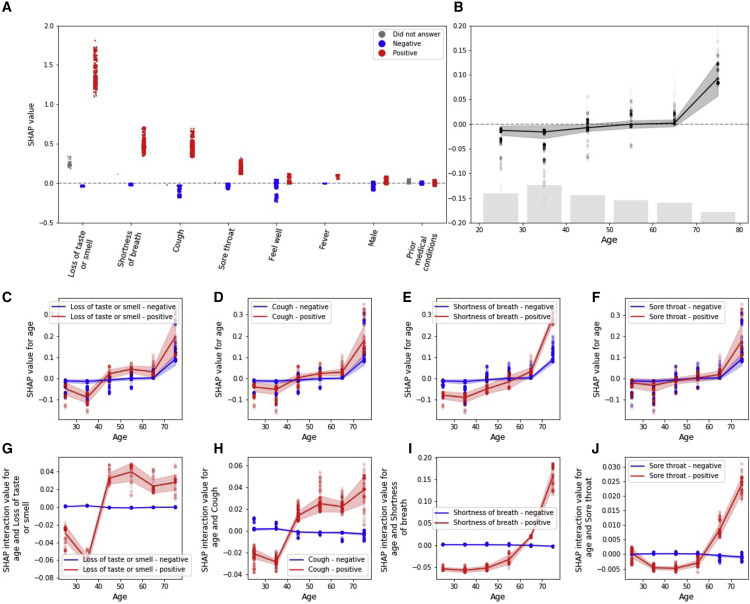
Findings: Our model was validated on a held-out set of individuals from Israel where it achieved an auROC of 0.737 (CI: 0.712-0.759) and auPR of 0.144 (CI: 0.119-0.177) and demonstrated its applicability outside of Israel in an independently collected symptom survey dataset from the US, UK, and Sweden. Our analyses revealed interactions between several symptoms and age, suggesting variation in the clinical manifestation of the disease in different age groups.
Conclusions: Our tool can be used online and without exposure to suspected patients, thus suggesting worldwide utility in combating COVID-19 by better directing the limited testing resources through prioritization of individuals for testing, thereby increasing the rate at which positive individuals can be identified. Moreover, individuals at high risk for a positive test result can be isolated prior to testing.
Funding: E.S. is supported by the Crown Human Genome Center, Larson Charitable Foundation New Scientist Fund, Else Kroener Fresenius Foundation, White Rose International Foundation, Ben B. and Joyce E. Eisenberg Foundation, Nissenbaum Family, Marcos Pinheiro de Andrade and Vanessa Buchheim, Lady Michelle Michels, and Aliza Moussaieff and grants funded by the Minerva foundation with funding from the Federal German Ministry for Education and Research and by the European Research Council and the Israel Science Foundation. H.R. is supported by the Israeli Council for Higher Education (CHE) via the Weizmann Data Science Research Center and by a research grant from Madame Olga Klein - Astrachan.
Keywords: Artificial Intelligence; COVID-19; Diagnosis; Health Policies; Machine Learning; SARS-CoV-2.
© 2020 Elsevier Inc.
Conflict of interest statement
The study protocol was approved by the Weizmann Institute of Science review board (IRB). Informed consent was waived by the IRB, as all identifying details of the participants were removed before the computational analysis. Participants were made fully aware of the way in which the data will be stored, handled, and shared, which was provided to them and is in accordance with the privacy and data-protection policy of the Weizmann Institute of Science (https://www.weizmann.ac.il/pages/privacy-policy).
Figures
References
-
- Grasselli G., Pesenti A., Cecconi M. Critical Care Utilization for the COVID-19 Outbreak in Lombardy, Italy: Early Experience and Forecast During an Emergency Response. JAMA. 2020;323:1545–1546. - PubMed
-
- Coronavirus Testing Basics https://www.fda.gov/consumers/consumer-updates/coronavirus-testing-basics.
-
- Sheridan C. COVID-19 spurs wave of innovative diagnostics. Nat. Biotechnol. 2020;38:769–772. - PubMed
Publication types
MeSH terms
LinkOut - more resources
Full Text Sources
Other Literature Sources
Medical
Miscellaneous
