Protein structure, amino acid composition and sequence determine proteome vulnerability to oxidation-induced damage
- PMID: 33073387
- PMCID: PMC7705453
- DOI: 10.15252/embj.2020104523
Protein structure, amino acid composition and sequence determine proteome vulnerability to oxidation-induced damage
Abstract
Oxidative stress alters cell viability, from microorganism irradiation sensitivity to human aging and neurodegeneration. Deleterious effects of protein carbonylation by reactive oxygen species (ROS) make understanding molecular properties determining ROS susceptibility essential. The radiation-resistant bacterium Deinococcus radiodurans accumulates less carbonylation than sensitive organisms, making it a key model for deciphering properties governing oxidative stress resistance. We integrated shotgun redox proteomics, structural systems biology, and machine learning to resolve properties determining protein damage by γ-irradiation in Escherichia coli and D. radiodurans at multiple scales. Local accessibility, charge, and lysine enrichment accurately predict ROS susceptibility. Lysine, methionine, and cysteine usage also contribute to ROS resistance of the D. radiodurans proteome. Our model predicts proteome maintenance machinery, and proteins protecting against ROS are more resistant in D. radiodurans. Our findings substantiate that protein-intrinsic protection impacts oxidative stress resistance, identifying causal molecular properties.
Keywords: Deinococcus radiodurans; oxidative stress; protein carbonyl; radioresistance; structural systems biology.
© 2020 The Authors. Published under the terms of the CC BY NC ND 4.0 license.
Conflict of interest statement
The authors declare that they have no conflict of interest.
Figures

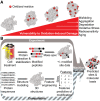
Relationship between carbonylation site distribution, protein vulnerability to reactive oxygen species, and stress phenotypes.
Structural systems biology workflow for proteome‐wide carbonyl site prediction. Red circles = carbonyl sites (CS); black circles = non‐oxidized RKPT residues; gray protein regions = non‐RKPT residues.

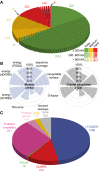
Total carbonyl‐bearing proteins detected by shotgun redox proteomic measurement in three biological replicates each of E. coli and D. radiodurans with and without irradiation. The left axis is the number of sequence‐unique proteins detected as carbonylated. The right axis is the number of sites in total detected as carbonylated (red) or not oxidized (black) in peptides bearing at least one carbonyl. Stripes indicate carbonylated proteins and carbonylatable sites detected only in irradiated samples. See also Appendix Fig S1.
Volcano plots for relative protein abundance changes measured by mass spectrometry in E. coli (left) and D. radiodurans (right) after irradiation using the same biological replicates as in Fig 2A. Black‐circled points are those proteins with significant changes (paired, 2‐sided t‐test P‐value < 0.05) of > 2‐fold or < 0.5‐fold. Red points are proteins with at least one carbonylated peptide detected. Fold change and P‐value cutoffs considered for significance are indicated by dashed lines. See also Fig EV1.

Survival rates (based on CFU counts) of irradiated E. coli and D. radiodurans corresponding to biological triplicate samples from which proteomic data were acquired. Absolutely no colonies were recovered from E. coli cultures that had been irradiated, even without diluting the samples before plating.
Carbonyl site measurement saturation curves for biological triplicate shotgun redox proteomic measurements in E. coli and D. radiodurans. Exponential saturation functions were fit by minimizing the sum of squared errors with the triplicate data points; the bolded term in each function is the estimated number of total non‐redundant carbonyl sites in our samples.

Prevalence of individual RKPT residues and prevalence of carbonylated form in experimentally measured peptides combining all three biological replicates of both conditions for each organism. Ratios are given above each pair of bars. All proportions are significantly different between each RKPT and their respective carbonylation state by two‐tailed z‐test of two proportions (P‐values < 0.01; see Materials and Methods), and meaning carbonylated proportions are not determined simply by relative prevalence of RKPT. See also Appendix Fig S1.
Prevalence of all canonical amino acids before irradiation of E. coli and D. radiodurans, combining all three biological replicates for each condition. Ratios are given above each pair of bars. All proportions are significantly different between species by two‐tailed z‐test of two proportions (P‐values < 0.01). See also Figs EV1 and EV2.


Three‐dimensional feature engineering from molecular properties. Initial properties that can be determined only with an atomic resolution structure, in the context of an amino acid sequence, or that depend only on amino acid identity are denoted at left. This property list is a non‐redundant abbreviated set of all properties considered (see Appendix Table S4 and Materials and Methods for full detail). Columns of the feature matrix at right are alternating property sums and means at spatial scales denoted below matrix. p = a molecular property; i = RKPT residue; k = neighbor residues of i; r = radius length. See also Fig EV3.
Sequence homology‐based features for machine learning were derived by performing sequence alignments of all RKPT sites (± 10 residues) anchored at the central residue to compute alignment scores that were then reduced to a computationally manageable number of features by principal component analysis (PCA).

Distribution of D. radiodurans proteins by difficulty of template‐based homology modeling and size regimes relevant for determining structure modeling algorithm applicability. Easy signifies ≥ 10 high‐confidence homologous templates available. Medium signifies ≥ 1 high‐confidence homologous template available. Hard signifies no high‐confidence homologous templates available. Proteins ≤ 200 residues long are amenable to ab initio folding. Proteins ≤ 800 residues long are amenable to homology modeling.
Structure quality evaluation criteria and percentage of D. radiodurans protein structures that satisfy published criteria thresholds. Blue plot represents best representative models for D. radiodurans proteins. Gray plot represents best available crystal structures from the PDB for D. radiodurans proteins.
Distribution of methods used to derive best representative protein structures for D. radiodurans. “None” indicates the proteins for which no PDB structure exists, and no modeling method is applicable.

Residue‐scale validation: Receiver operating characteristic (ROC) curves for CS predictors derived by leave‐1-out validation. The dashed black line at y=x corresponds to performance expected by chance. Top left = final predictor trained by stacking structure‐ and sequence‐based models. Top middle = predictor trained only on structure‐based features. Top right = predictor trained only on sequence‐based features. Bottom left = theoretical maximum predictive power for a probability estimator (AUC = 0.98). Bottom middle = same algorithm as used for final predictor but with all features shuffled beforehand. Bottom right = CSPD model developed using metal‐catalyzed oxidation (MCO) site data from E. coli. See also Figs EV3 and EV4.
Protein‐scale validation: Comparison between predicted CS enrichment from leave‐1-out validation to CS enrichment computed from all carbonylated peptides measured for E. coli (left) and D. radiodurans (right). Each point represents a different protein species. Predicted probability‐weighted CS enrichment = (sum of carbonylation probabilities across training set sites)/(number of residues in corresponding peptides from experiments). Experimentally measured probability‐weighted CS enrichment = (sum of empirical oxidation probabilities across training set sites)/(number of residues in corresponding peptides from experiments). The solid line is the fitted regression line, and dashed lines indicate the boundaries of the 95% confidence interval.

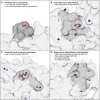
- A–D
Example sites prone to carbonylation. (A) DRA0302_P252, (B) DR0099_P51, and (C) b0911_K411; and example robust site (D) b3313_P69.


References
-
- Airo A, Chan SL, Martinez Z, Platt MO, Trent JD (2004) Heat shock and cold shock in Deinococcus radiodurans . Cell Biochem Biophys 40: 277–288 - PubMed
-
- Altschul SF, Gish W, Miller W, Myers EW, Lipman DJ (1990) Basic local alignment search tool. J Mol Biol 215: 403–410 - PubMed
-
- Anaganti N, Basu B, Apte SK (2016) In situ real‐time evaluation of radiation‐responsive promoters in the extremely radioresistant microbe Deinococcus radiodurans . J Biosci 41: 193–203 - PubMed

