

Microtubule poleward flux in human cells is driven by the coordinated action of four kinesins
- PMID: 33073400
- PMCID: PMC7705458
- DOI: 10.15252/embj.2020105432
Microtubule poleward flux in human cells is driven by the coordinated action of four kinesins
Abstract
Mitotic spindle microtubules (MTs) undergo continuous poleward flux, whose driving force and function in humans remain unclear. Here, we combined loss-of-function screenings with analysis of MT-dynamics in human cells to investigate the molecular mechanisms underlying MT-flux. We report that kinesin-7/CENP-E at kinetochores (KTs) is the predominant driver of MT-flux in early prometaphase, while kinesin-4/KIF4A on chromosome arms facilitates MT-flux during late prometaphase and metaphase. Both these activities work in coordination with kinesin-5/EG5 and kinesin-12/KIF15, and our data suggest that the MT-flux driving force is transmitted from non-KT-MTs to KT-MTs by the MT couplers HSET and NuMA. Additionally, we found that the MT-flux rate correlates with spindle length, and this correlation depends on the establishment of stable end-on KT-MT attachments. Strikingly, we find that MT-flux is required to regulate spindle length by counteracting kinesin 13/MCAK-dependent MT-depolymerization. Thus, our study unveils the long-sought mechanism of MT-flux in human cells as relying on the coordinated action of four kinesins to compensate for MT-depolymerization and regulate spindle length.
Keywords: kinesins; kinetochore; microtubules; mitosis; mitotic spindle.
© 2020 The Authors.
Conflict of interest statement
The authors declare that they have no conflict of interest.
Figures
- A
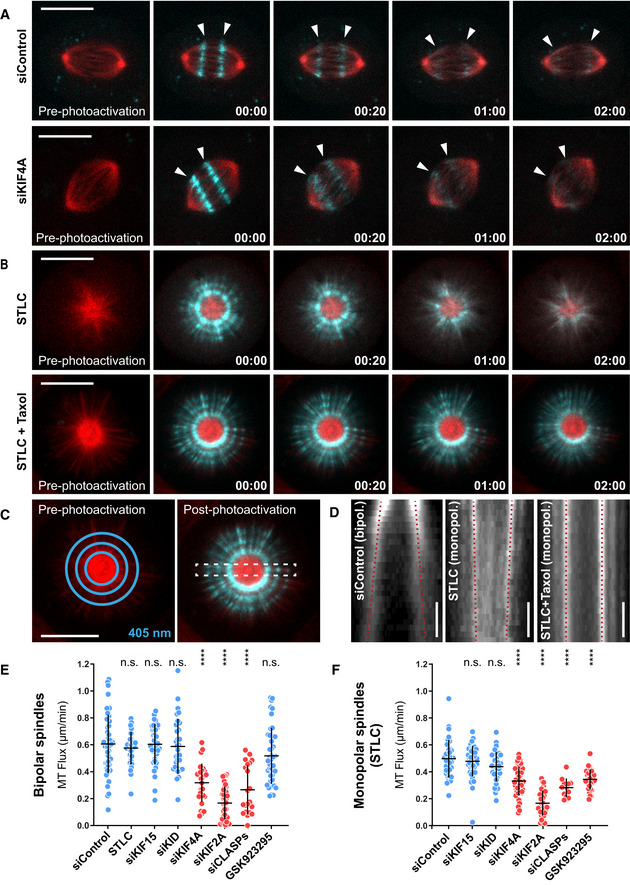
Representative spinning disk confocal live‐cell imaging time series of U2OS cells stably co‐expressing PA‐GFP-α‐tubulin (cyan) and mCherry‐α‐tubulin (red), treated with control and KIF4A siRNAs. White arrowheads highlight poleward motion of the photoactivated regions due to MT‐flux. Scale bars, 10 μm. Time, min:s.
- B
Representative spinning disk confocal live‐cell imaging time series images of S‐trityl‐
l ‐cysteine (STLC)‐treated U2OS cells stably co‐expressing PA‐GFP-α‐tubulin (cyan) and mCherry‐α‐tubulin (red). Note that MT‐flux is abrogated in the presence of taxol (lower panel). Scale bars, 10 μm. Time, min:s. - C
Illustration of 405 nm laser‐photoactivated regions in monopolar spindles (blue circles, left). The effect of photoactivation and region selected for kymograph generation (dashed white rectangle, right). Scale bar, 10 μm.
- D
Corresponding kymograph profiles of the photoactivated regions in bipolar and monopolar spindles used for quantification of the flux rates (red dotted lines highlight MT‐flux slopes). Scale bars, 30 s.
- E, F
Quantification of MT‐flux in bipolar (E) and monopolar (F) spindles subjected to indicated treatments. Graphs represent MT‐flux of individual cells with mean ± SD. N (number of cells, number of independent experiments): – bipolar spindles: siControl (49, 5), STLC (31, 3), siKIF15 (39, 3), siKID (32, 3), siKIF4A (28, 3), siKIF2A (36, 3), siCLASPs (21, 2), GSK923295 (44, 3); – monopolar spindles: siControl (35, 3), siKIF15 (44, 3), siKID (38, 3), siKIF4A (44, 3), siKIF2A (38, 3), siCLASPs (12, 2), GSK923295 (33, 3). P‐values were calculated against control using one‐way ANOVA and Kruskal–Wallis H‐test. n.s.—not significant, ****P ≤ 0.0001.
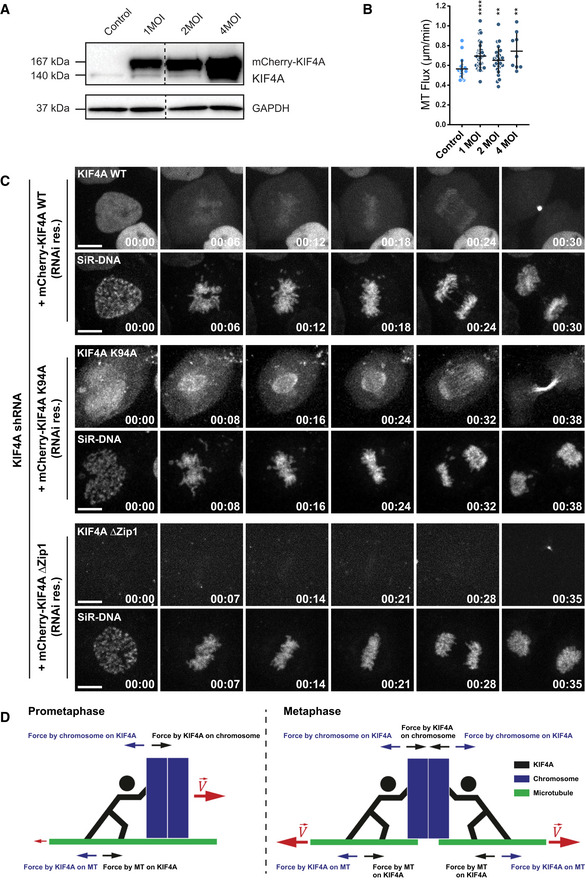
Immunoblot analysis of cell lysates obtained from U2OS cells stably expressing PA‐GFP-α‐tubulin infected with different multiplicity of infection (MOI) ratios of mCherry‐KIF4A expressing adenovirus. Expression levels of KIF4A upon adenoviral titration were detected using anti‐KIF4A antibody, with GAPDH as loading control.
Quantification of the MT‐flux rates upon KIF4A overexpression. The individual values and their mean ± SD are plotted. N (number of cells, number of independent experiments): Control (untreated) (23, 3); 1 MOI (33, 3); 2 MOI (26, 3), 4 MOI (9, 1). P‐values were calculated using Mann–Whitney U‐test. **P ≤ 0.01, ****P ≤ 0.0001.
Representative spinning disk confocal live‐cell imaging time series images of U2OS PA-GFP‐α‐tubulin cells conditionally co‐expressing KIF4A shRNA and RNAi‐resistant mCherry‐KIF4A variants induced using doxycycline. Chromosomes were stained using SiR‐DNA. Scale bars, 10 μm. Time, h:min.
Schematic model illustrating KIF4A‐mediated forces in MT‐flux driving. Forces exerted by KIF4A motors promote motion of chromosomes relative to MTs. Once a bi‐oriented chromosome aligns at the metaphase plate, KIF4A forces can no longer do work on it. Rather, the reactive force on MTs may promote non‐KT-MTs to flux toward the poles.
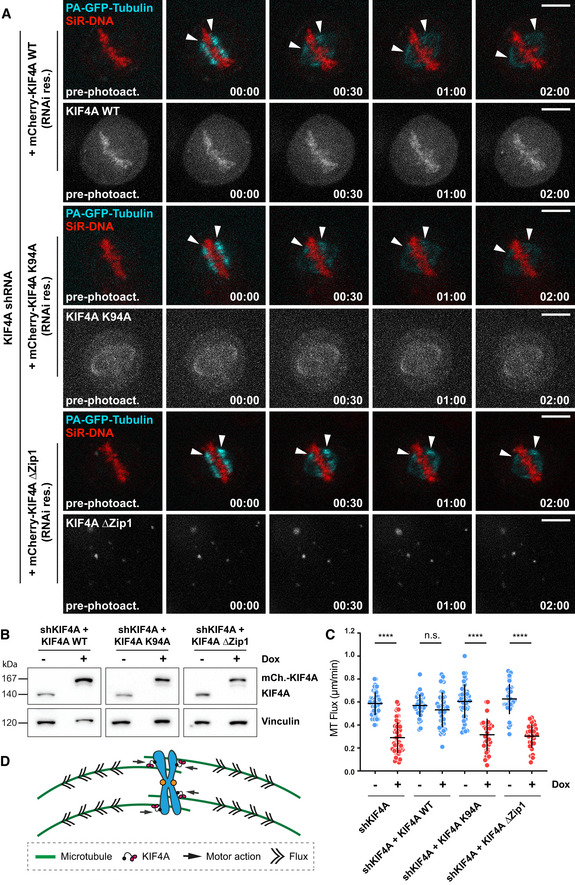
Representative spinning disk confocal live‐cell imaging time series images of U2OS PA-GFP‐α‐tubulin cells conditionally co‐expressing KIF4A shRNA and RNAi‐resistant mCherry‐Kif4A variants induced using doxycycline. Chromosomes were stained using SiR‐DNA. White arrowheads highlight poleward flux of the photoactivated regions. Scale bar, 10 μm. Time, min:s.
Representative immunoblot of cell lysates obtained before and after doxycycline induction to validate the efficiency of KIF4A shRNA construct and expression of the RNAi‐resistant mCherry‐KIF4A variants. The anti‐KIF4A antibody was used, together with anti‐vinculin antibody as a loading control.
Quantification of MT‐flux upon shRNA‐mediated depletion of KIF4A alone or in combination with conditional expression of the RNAi‐resistant mCherry‐KIF4A variants. The bars in graph represent mean ± SD. N (number of cells, number of independent experiments): uninduced shKIF4A (48, 4), shKIF4A (60, 4), uninduced KIF4A WT (36, 5), shKIF4A + KIF4A WT (43, 5), uninduced KIF4A K94A (42, 7), shKIF4A + KIF4A K94A (38, 6), uninduced KIF4A ΔZip1 (32, 4), and shKIF4A + ΔZip1 (30, 4). P‐values were calculated using Student's t‐test and Mann–Whitney U‐test. n.s.—not significant, ****P ≤ 0.0001.
Model illustrating chromosome arms‐localized KIF4A driving MT‐flux.
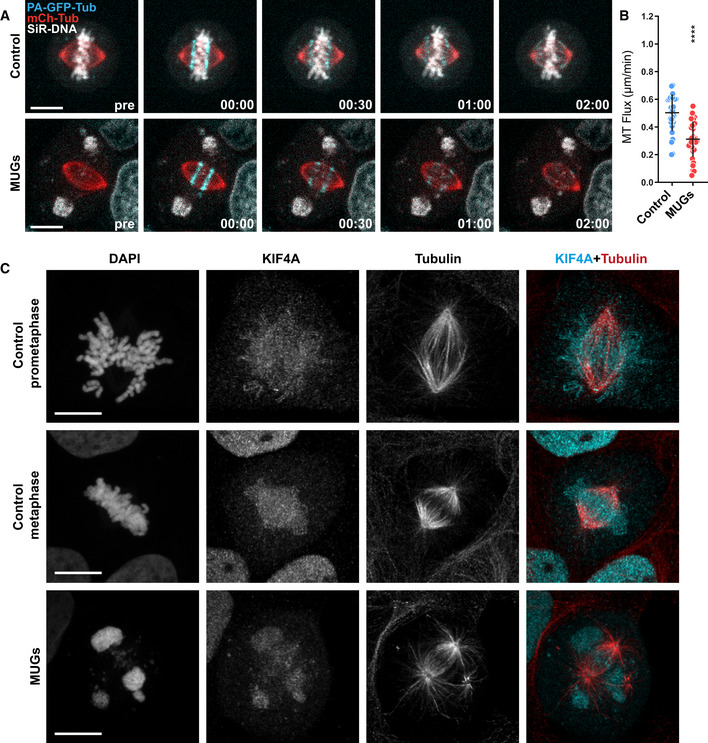
Representative spinning disk confocal time series of MT‐flux in bipolar spindles in control cells and cells undergoing mitosis with unreplicated genomes (MUGs). U2OS cells stably co‐expressing PA‐GFP-α‐tubulin (cyan) and mCherry‐α‐tubulin (red), labeled for chromosomes with SiR‐DNA (gray) are shown, with 5 mM caffeine used as a control. Scale bar, 10 μm. Time, min:s.
Quantification of the MT‐flux rates from indicated conditions. MT‐flux values with mean ± SD are plotted. N (number of cells, number of independent experiments): Caffeine‐only control (30, 3) and MUGs (34, 3). P‐values from Mann–Whitney U‐test. ****P ≤ 0.0001.
Representative point‐scanning confocal maximum‐intensity projected images of mitotic spindles in U2OS cells subjected to indicated conditions, immunostained with antibodies against KIF4A and α‐tubulin. DNA was counterstained with DAPI. KIF4A in cyan and α‐tubulin in red in merged image. Scale bar, 10 μm.
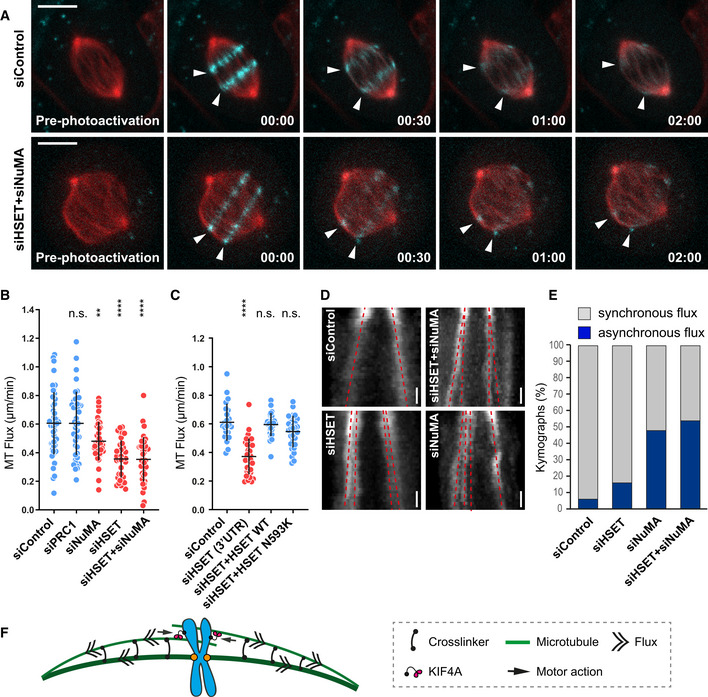
Representative spinning disk confocal live‐cell image series of MT‐flux in U2OS cells stably co‐expressing PA‐GFP-α‐tubulin (cyan) and mCherry‐α‐tubulin (red) treated with indicated siRNAs. White arrowheads highlight poleward motion of the photoactivated regions due to MT‐flux. Scale bars, 10 μm. Time, min:s.
Quantification of the impact of the MT‐crosslinking proteins on MT‐flux in U2OS PA‐GFP/mCherry‐α‐tubulin cells transfected with respective siRNAs. Graph represent MT‐flux values with mean ± SD. N (number of cells, number of independent experiments): siControl (49, 5), siPRC1 (45, 3), siNuMA (40, 3), siHSET (37, 3), and siHSET + siNuMA (39, 3). P‐values were calculated against control using one‐way ANOVA. n.s., not significant, **P ≤ 0.01, ****P ≤ 0.0001.
Quantification of the impact of the motor activity of HSET on MT‐flux in U2OS cells stably expressing mEOS‐α‐tubulin treated with control or HSET 3′UTR siRNAs in presence or absence of the respective RNAi‐resistant GFP‐HSET constructs. Graph represent MT‐flux values with mean ± SD. N (number of cells, number of independent experiments): siControl (23, 3), siHSET 3′UTR (33, 3), siHSET 3′UTR + HSET WT (29, 5), and siHSET 3′UTR + HSET N593K (30, 4). P‐values were calculated against control using one‐way ANOVA. n.s., not significant, ****P ≤ 0.0001.
Representative kymographs of the photoactivated spindles from (B) displaying asynchronous flux motion (split of the two red dashed lines toward individual poles) upon RNAi‐mediated depletion of MT‐crosslinkers. Scale bars, 30 s.
Percentage of cells with asynchronous flux movements calculated from (B).
Model illustrating the role of MT‐crosslinking activities of NuMA and HSET in uniform distribution of poleward forces across the mitotic spindle.
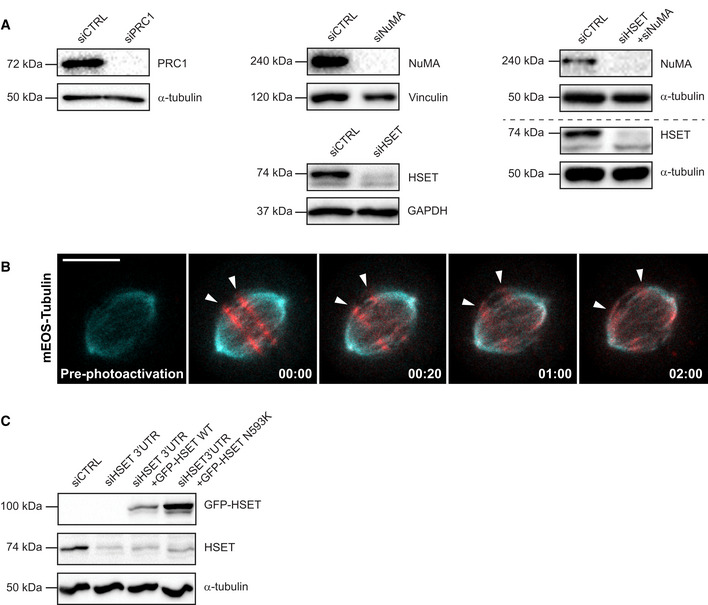
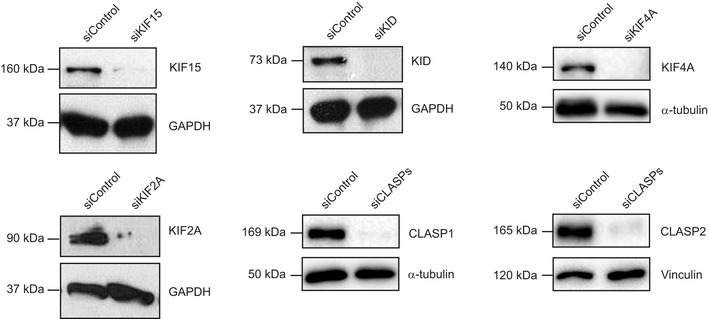
Immunoblot analysis of the respective knockdown efficiencies in U2OS cells stably expressing PA-GFP/mCherry‐α‐tubulin treated with control or indicated siRNAs. GAPDH, α‐tubulin and vinculin were used as a loading control.
Spinning disk confocal time series images of photoconverted mEOS‐α‐tubulin (red) in U2OS cells stably expressing mEOS‐α‐tubulin (cyan). White arrowheads highlight the photoconverted regions fluxing toward the poles. Scale bar, 10 μm. Time, min:s.
Immunoblot analysis of U2OS cells stably expressing mEOS‐α‐tubulin transfected with control or HSET 3′UTR‐targeting siRNAs and co‐transfected with the RNAi‐resistant GFP‐HSET constructs. Expression levels of HSET was observed using anti‐HSET antibody with α‐tubulin serving as the loading control.
Immunoblot analyses of the efficiency of knockdown from U2OS cells stably expressing PA‐GFP/mCherry‐α‐tubulin treated with control or indicated siRNAs, with GAPDH or α‐tubulin used as the loading control.
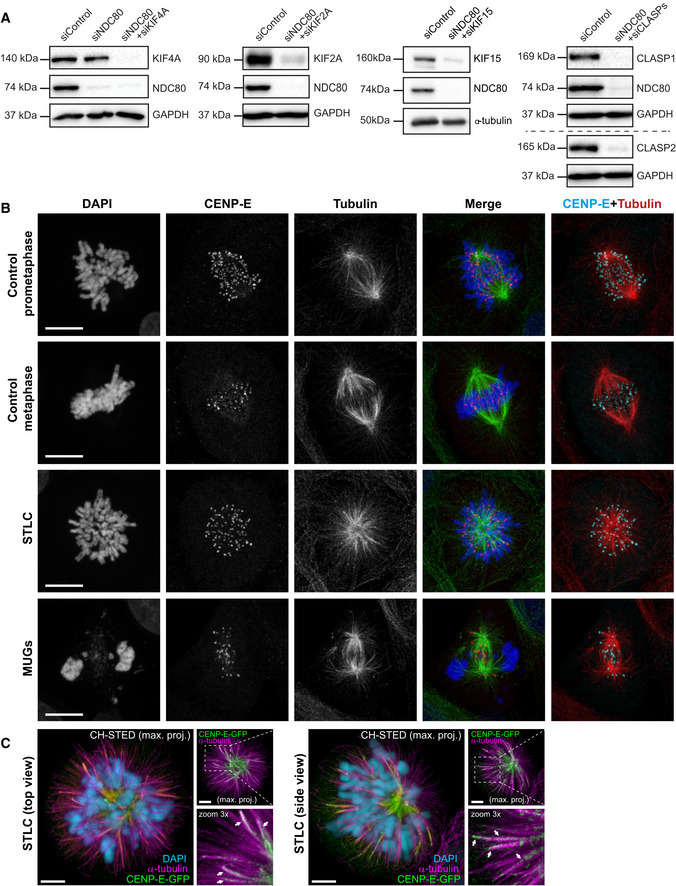
Representative point‐scanning confocal maximum intensity projections of control, STLC‐treated and MUGs mitotic spindles in U2OS cells, immunostained with antibodies against CENP‐E and α‐tubulin. DNA was counterstained with DAPI. CENP‐E in red, α‐tubulin in green and DNA in blue in merged image. Scale bar, 10 μm.
CH‐STED analyses of HeLa cells stably expressing CENP‐E-GFP treated with STLC to induce the formation of monopolar spindles. A top view and a side view of different monopolar spindles are shown. Chromosomes (confocal mode only) were revealed in the larger panels with DAPI (cyan) and MTs (magenta) were detected with an anti‐α‐tubulin antibody. Arrows indicate examples of clear MT bundles. Scale bar in all panels is 5 μm.
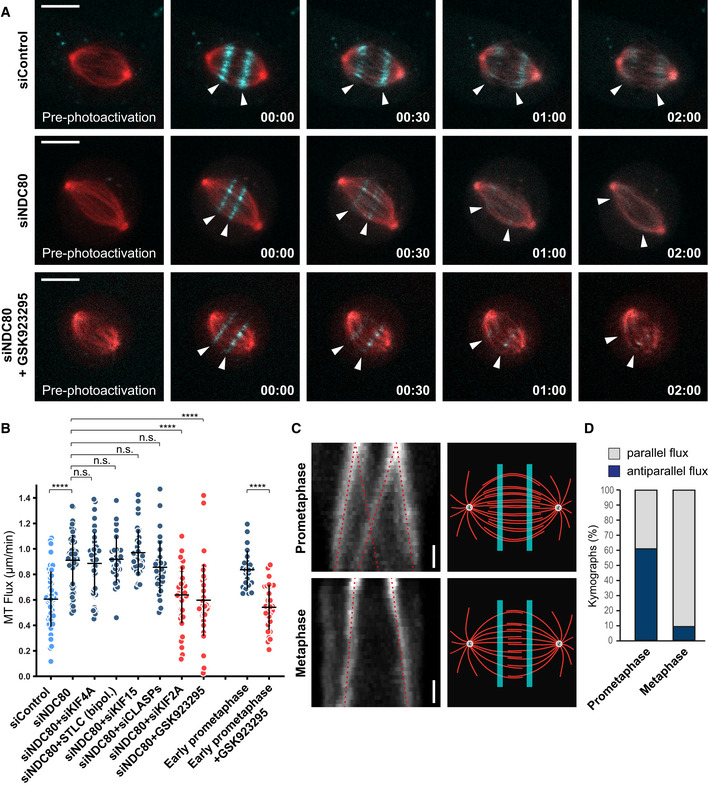
Representative spinning disk confocal live‐cell time series of MT‐flux in U2OS cells stably co‐expressing PA‐GFP-α‐tubulin (cyan) and mCherry‐α‐tubulin (red) treated with indicated conditions. White arrowheads follow the poleward motion of the photoactivated regions due to MT‐flux. Scale bars, 10 μm. Time, min:s.
Quantification of the impact of stable end‐on KT‐MT attachments on MT‐flux in NDC80‐depleted cells under indicated conditions and in early prometaphase cells with and without the CENP‐E inhibitor GSK923295. MT‐flux values are plotted with mean ± SD. N (number of cells, number of independent experiments): siControl (49, 5), siNDC80 (59, 6), siNDC80 + siKIF4A (41, 3), siNDC80 + STLC (bipol.) (28, 3), siNDC80 + siKIF15 (36, 4), siNDC80 + siCLASPs (33, 3), siNDC80 + siKIF2A (38, 4), siNDC80 + GSK923295 (38, 3), early prometaphase (23, 3), and early prometaphase + GSK923295 (28, 3). P‐values were calculated using Kruskal–Wallis H‐test compared with siNDC80, except for early prometaphase data for which Student's t‐test was used. n.s., not significant, ****P ≤ 0.0001.
Kymograph profiles (left) highlighting that the photoactivated regions in prometaphase (upper panel) split and move toward both poles, whereas metaphase spindles (lower panel) flux uniformly toward individual poles (indicated by red dotted lines). Illustration of the photoactivated regions (right) in prometaphase and metaphase spindles, highlighting that interpolar MTs overlap over a broader region in early mitosis, becoming focused at the spindle equator in metaphase. Scale bar, 30 s.
Percentage of cells with parallel and antiparallel flux movements during prometaphase and metaphase. N (number of cells, number of independent experiments): prometaphase (23, 3), metaphase (22, 3).
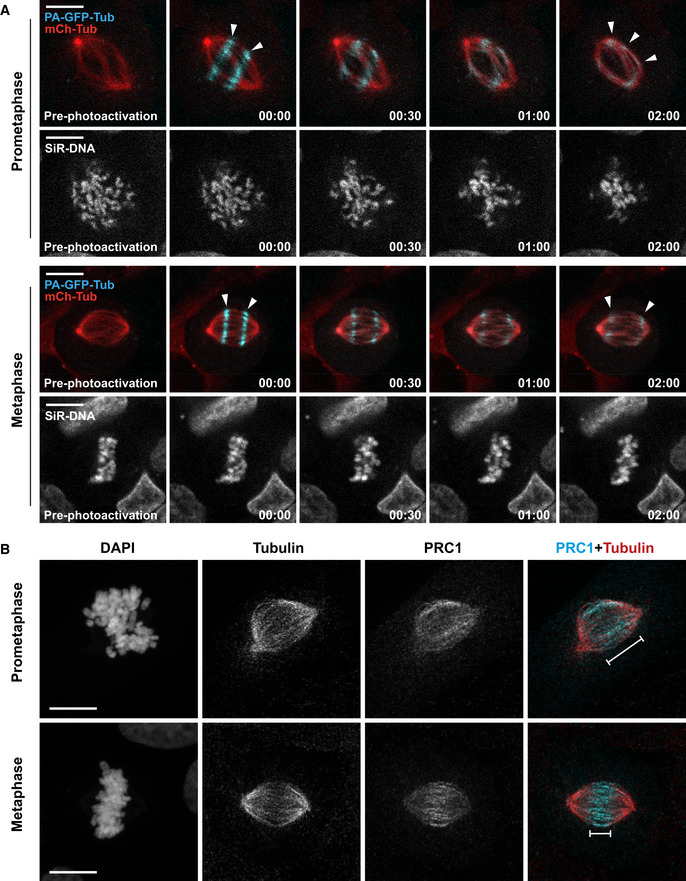
Representative spinning disk confocal time series of MT‐flux during prometaphase (upper panel) and metaphase (lower panel) in U2OS cells stably co‐expressing PA‐GFP-α‐tubulin (cyan) and mCherry‐α‐tubulin (red), with chromosomes labeled using SiR‐DNA (gray). White arrowheads highlight that the photoactivated regions in prometaphase split and move toward both poles (upper panel), whereas metaphase spindles flux uniformly toward individual poles (lower panel). Scale bars, 10 μm. Time, min:s.
Representative maximum projections of point‐scanning confocal immunofluorescence images of prometaphase and metaphase spindles in U2OS cells, stained using antibodies against PRC1 and α‐tubulin. DNA was counterstained with DAPI. PRC1 (cyan) and α‐tubulin (red) are shown in merged image. The white line signifies area of PRC1‐stained antiparallel MTs within the spindle. Scale bar, 10 μm.
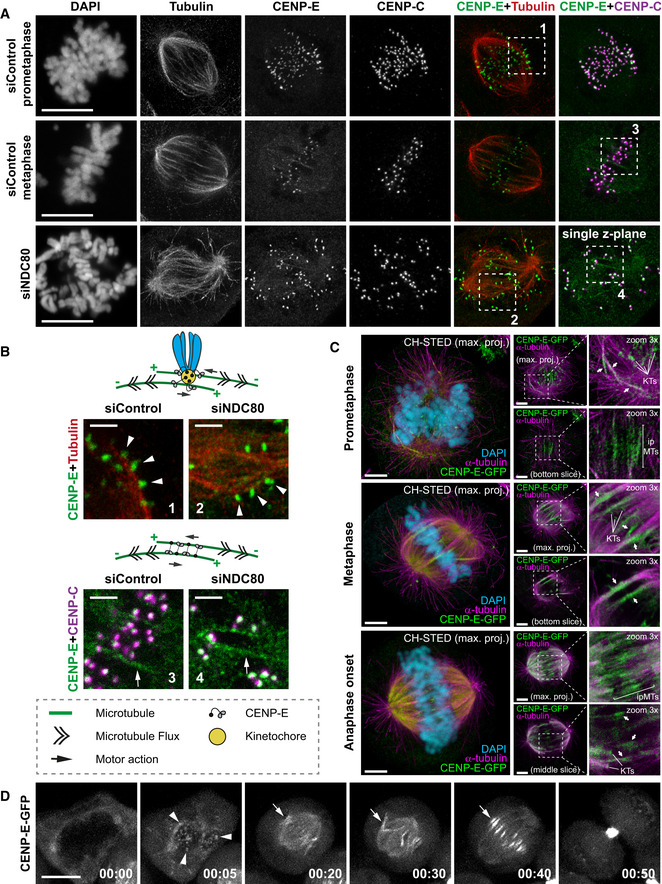
Representative maximum‐intensity projected coherent‐hybrid STED (CH‐STED) images of mitotic spindles in U2OS cells treated with control and NDC80 siRNAs and stained for DNA (DAPI), KTs (CENP‐C, magenta), α‐tubulin (red), and CENP‐E (green). Scale bar, 10 μm.
Model illustrating potential mechanisms for CENP‐E mediated MT‐flux forces either through its KT‐ or antiparallel MT‐based localization and sliding. Zoomed insets from (A) highlight CENP‐E localized at KTs laterally interacting with MTs (white arrowheads in 1, 2), and CENP‐E localized at interpolar MTs (white arrows in 3, 4), in control and NDC80‐depleted mitotic cells. Scale bars, 2 μm.
CH‐STED analyses of HeLa cells stably expressing CENP‐E-GFP illustrating bipolar spindles in prometaphase, metaphase and just after sister‐chromatid separation at anaphase onset. Approximate x–y resolution is 70 nm. The expected/described localization of CENP‐E-GFP (green) at KTs is shown. In addition, CENP‐E-GFP was found associated with interpolar MTs (ipMTs), including regions of overlapping antiparallel MTs, and k‐fibers. Chromosomes (confocal mode only) were revealed in the larger panels with DAPI (cyan) and MTs (magenta) were detected with an anti‐α‐tubulin antibody. Arrows indicate examples of clear MT bundles, including regions of overlapping antiparallel MTs. Scale bar in all panels is 5 μm.
Representative spinning disk confocal live‐cell time series of HeLa cells stably expressing CENP‐E-GFP. White arrowheads highlight CENP‐E-GFP at KTs, white arrows highlight CENP‐E-GFP on interpolar MTs. Scale bar, 10 μm. Time, h:min.
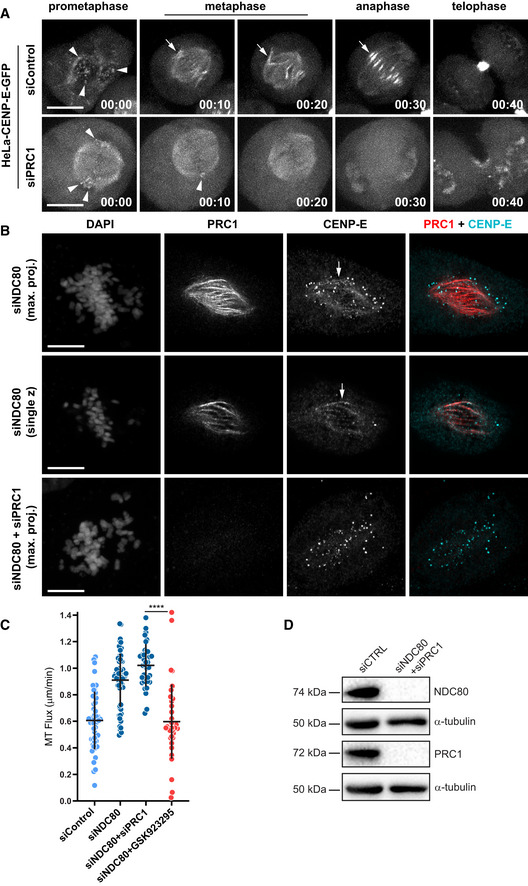
Representative spinning disk confocal live‐cell time series of control and PRC1‐depleted HeLa cells stably expressing CENP‐E-GFP. White arrowheads highlight CENP‐E-GFP at KTs, white arrows highlight CENP‐E-GFP on interpolar MTs. Scale bar, 10 μm. Time, h:min.
Representative point‐scanning confocal immunofluorescence images of U2OS cells, stained using antibodies against PRC1 and CENP‐E. PRC1 (red) and CENP‐E (cyan) are shown in merged image. DNA was counterstained with DAPI. Scale bar, 10 μm. White arrows highlight CENP‐E on interpolar MTs.
Quantification of the impact of PRC1 depletion versus CENP‐E inhibition on MT‐flux in NDC80‐depleted cells. MT‐flux values are plotted with mean ± SD. P‐values were calculated using Mann–Whitney U‐test. ****P ≤ 0.0001. siControl, siNDC80 and siNDC80 + GSK923295 data are from Figs 1E and 5B. N (number of cells, number of independent experiments): siNDC80 + siPRC1 (37, 3).
Immunoblot analyses of the efficiency of knockdown from U2OS cells stably expressing PA‐GFP/mCherry‐α‐tubulin treated with control or indicated siRNAs, with α‐tubulin used as a loading control.
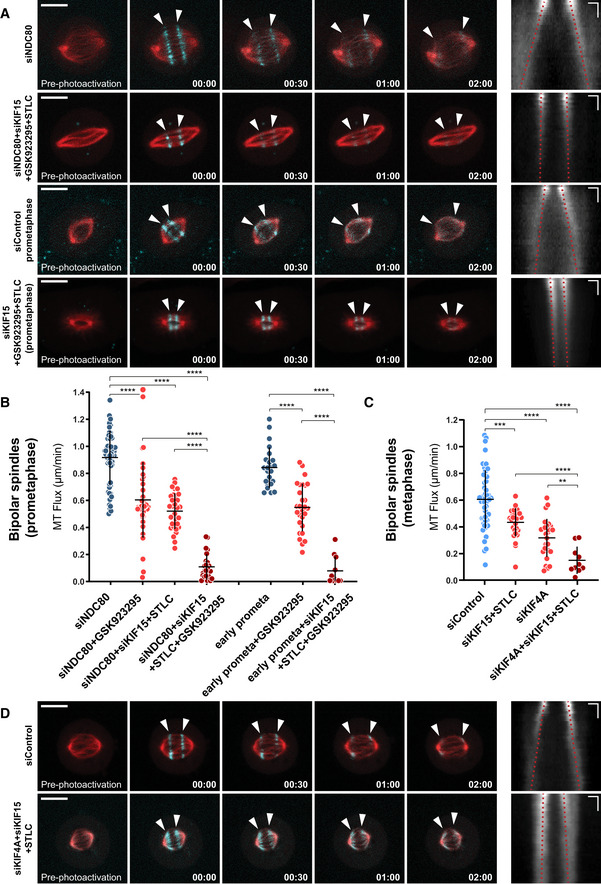
- A
Representative spinning disk confocal time series of U2OS cells stably co‐expressing PA‐GFP-α‐tubulin (cyan) and mCherry‐α‐tubulin (red), with indicated treatments (left). White arrowheads highlight poleward flux of the photoactivated regions. Scale bar, 10 μm. Time, min:s. Right panels display corresponding kymographs of the photoactivated spindles used for quantification of the flux rates (red dotted lines highlight MT‐flux slopes). Scale bars, 2 μm (horizontal) and 30 s (vertical).
- B, C
Quantification of MT‐flux in prometaphase (B) and metaphase (C) bipolar spindles subjected to indicated treatments. Graphs represent MT‐flux of individual cells with mean ± SD. siNDC80, siNDC80 + GSK923295, early prometaphase, early prometaphase + GSK923295, siControl, and siKIF4A data are from Figs 1E and 5B. N (number of cells, number of independent experiments): siNDC80 + KIF15 + STLC (33, 5), siNDC80 + KIF15 + STLC + GSK923295 (25, 3), early prometaphase + KIF15 + STLC + GSK923295 (11, 2), siKIF15 + STLC (29, 3), siKIF4A + siKIF15 + STLC (10, 3). P‐values were calculated using Student's t‐test and Mann–Whitney U‐test. **P ≤ 0.01, ***P ≤ 0.001 ****P ≤ 0.0001.
- D
Representative spinning disk confocal time series of U2OS cells stably co‐expressing PA‐GFP-α‐tubulin (cyan) and mCherry‐α‐tubulin (red), with indicated treatments (left) and corresponding kymographs (right) as described in (A). Scale bars, 2 μm (horizontal) and 30 s (vertical).
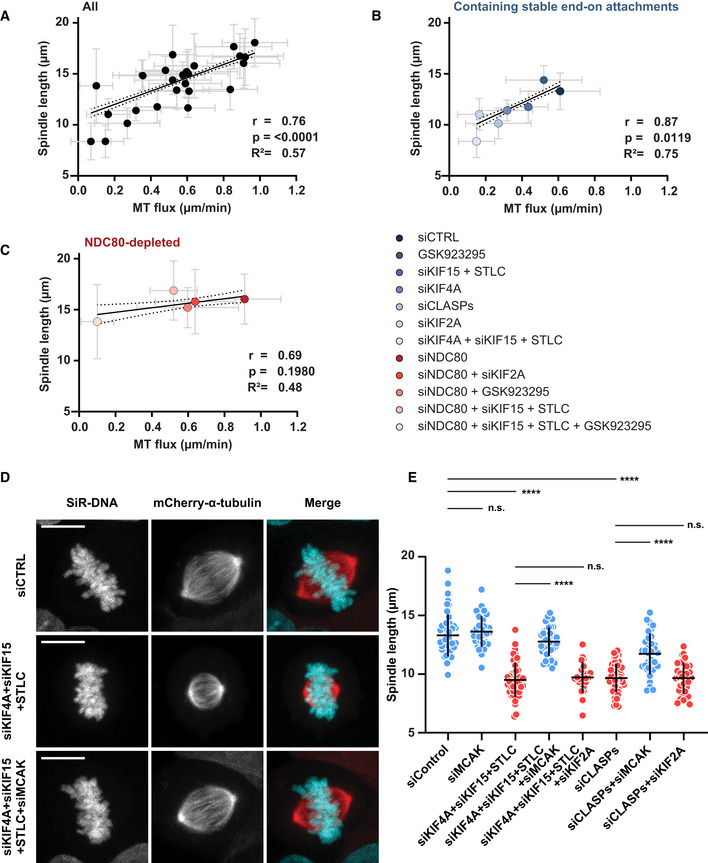
- A–C
Graph depicting a direct correlation between MT‐flux and mitotic spindle where mean spindle length is plotted over mean MT‐flux rates for all indicated conditions (A), mitotic conditions containing stable end‐on attachments (B), and NDC80 depleted conditions lacking stable end‐on attachments (C). Solid and dotted lines represent the linear regression and 95% confidence interval, respectively. Pearson correlation coefficient (r), coefficient of determination (r 2), and corresponding P‐values are indicated. The error bars over x and y axes represent the standard deviation of MT‐flux and spindle length, respectively.
- D
Representative images from spinning disk confocal live‐cell time series of U2OS PA-GFP‐α‐tubulin/mCherry‐α‐tubulin cells under indicated treatments, with SiR‐DNA-labeled DNA. Microtubules are shown in red and DNA in cyan in the merged image. Scale bar: 10 μm.
- E
Quantification of spindle lengths at metaphase following indicated treatments. Graph represents the spindle length of individual cells with mean ± SD. N (number of cells, number of independent experiments): siControl (49, 5), siMCAK (34,3), siKIF4A + siKIF15 + STLC (46, 6), siKIF4A + siKIF15 + STLC + siMCAK (43, 3), siKIF4A + siKIF15 + STLC + siKIF2A (22, 3), siCLASPs (64, 6), siCLASPs + siMCAK (33, 3), siCLASPs + siKIF2A (32, 3). P‐values were calculated using Student's t‐test and Mann–Whitney U‐test. n.s.—not significant, ****P ≤ 0.0001.
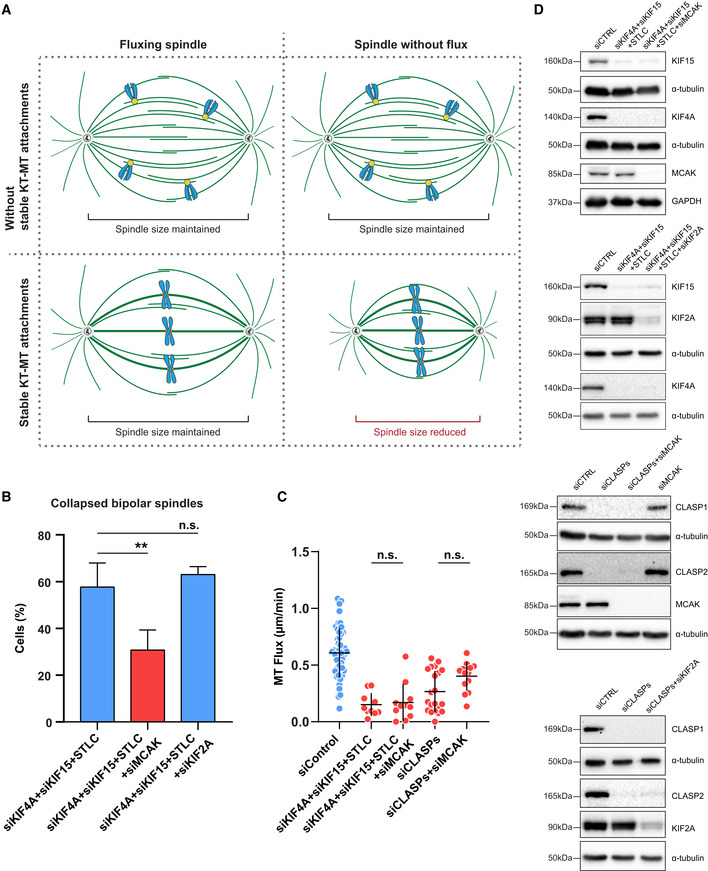
Illustration of the relationship between MT‐flux and spindle length in the presence or absence of stable KT‐MT end‐on attachments.
Percentage of cells where bipolar spindle collapses to become monopolar after indicated treatments. N (number of cells, number of independent experiments): siKIF4A + siKIF15 + STLC (80, 6), siKIF4A + siKIF15 + STLC + siMCAK (94, 3), siKIF4A + siKIF15 + STLC + siKIF2A (37, 3). Graph represents the mean values of individual experiments ± SD. P‐values were calculated using Student's t‐test. **P ≤ 0.01, n.s.—not significant.
Quantification of the impact of MCAK‐mediated recovery on MT‐flux. MT‐flux with mean ± SD are plotted. siControl, siKIF4A + siKIF15 + STLC and siCLASPs values are from Figs 1E and 7C. N (number of cells, number of independent experiments): siKIF4A + siKIF15 + STLC + siMCAK (11, 3) siCLASPs + siMCAK (14, 3). P‐values were calculated using Student's t‐test. n.s.—not significant.
Immunoblot analysis of the knockdown efficiency of indicated proteins in U2OS PA‐GFP/mCherry‐α‐tubulin cells treated with control or target‐specific siRNAs. GAPDH and α‐tubulin serve as the loading controls.
References
-
- Antonio C, Ferby I, Wilhelm H, Jones M, Karsenti E, Nebreda AR, Vernos I (2000) Xkid, a chromokinesin required for chromosome alignment on the metaphase plate. Cell 102: 425–435 - PubMed
-
- Bajer AS, Molè‐Bajer J (1972) Spindle dynamics and chromosome movements. Int Rev Cytol Supplement 3: 271
-
- Barisic M, Aguiar P, Geley S, Maiato H (2014) Kinetochore motors drive congression of peripheral polar chromosomes by overcoming random arm‐ejection forces. Nat Cell Biol 16: 1249–1256 - PubMed
-
- Brinkley BR, Zinkowski RP, Mollon WL, Davis FM, Pisegna MA, Pershouse M, Rao PN (1988) Movement and segregation of kinetochores experimentally detached from mammalian chromosomes. Nature 336: 251–254 - PubMed
Publication types
MeSH terms
Substances
Grants and funding
LinkOut - more resources
Full Text Sources
Other Literature Sources
Research Materials
Miscellaneous
